Low Energy Investigations at Kamioka Observatory
Abstract
At Kamioka Observatory many activities for low energy rare event search are ongoing. Super-Kamiokande(SK), the largest water Cherenkov neutrino detector, currently continues data taking as the fourth phase of the experiment (SK-IV). In SK-IV, we have upgraded the water purification system and tuned water flow in the SK tank. Consequently the background level was lowered significantly. This allowed SK-IV to derive solar neutrino results down to 3.5 MeV energy region. With these data, neutrino oscillation parameters are updated from global fit; , , . NEWAGE, the directional sensitive dark matter search experiment, is currently operated as “NEWAGE-0.3a” which is a m3 micro-TPC filled with CF4 gas at 152 Torr. Recently we have developed “NEWAGE-0.3b”. It was succeeded to lower the operation pressure down to 76 Torr and the threshold down to 50 keV (F recoils). XMASS experiment is looking for scintillation signals from dark matter interaction in 1 ton of liquid xenon. It was designed utilizing its self-shielding capability with fiducial volume confinement. However, we could lower the analysis threshold down to 0.3 keVee using whole volume of the detector. In February 2012, low threshold and very large exposure data (5591 kgdays) were collected. With these data, we have excluded some part of the parameter spaces claimed by DAMA/LIBRA and CoGeNT experiments.
1 Kamioka Observatory
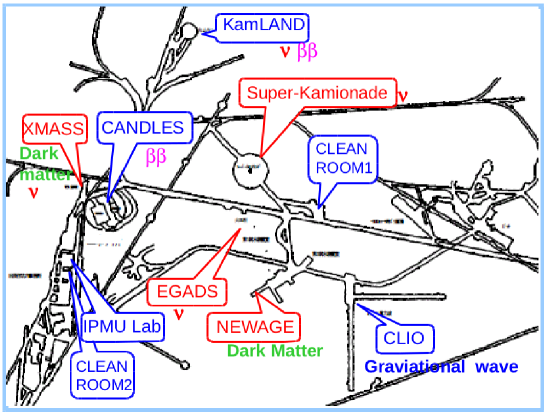
Kamioka Observatory, Institute for Cosmic Ray Research, University of Tokyo, is located in Kamioka-town in the northern part of the Gifu prefecture in Japan. The location of the laboratories is under the peak of Mt. Ikenoyama providing 2,700 meters water equivalent (or 1000 m of rock) overburden. This observatory was established in 1995 to push forward with the Super-Kamiokande experiment and has become a world frontier center of neutrino physics. Many studies complementary to the flagship SK are also ongoing as illustrated in Figure 1. Experiments to search for dark matter and double beta decay are very active now. Further a new 3 km gravitational wave telescope is being constructed and the next generation flagship experiment: Hyper-Kamiokande is seriously discussed in Japanese physics community.
2 Super-Kamiokande
Super-Kamiokande (SK) is a water Cherenkov detector containing 50,000 tons of pure water viewed by 11,129 (inner detector: 32 kton) and 1,885 (outer detector: 18 kton) photomultiplier tubes (PMTs). A broad range of energies is studied with the SK detector, from a few MeV up to (TeV). In the low energy region below 20 MeV, solar neutrino interactions are detected by neutrino-electron scattering. At higher energies, atmospheric neutrino interactions covering 5 orders of magnitude are detectable by neutral- and charged-current neutrino-nucleon interactions.
In this presentation, we focus on the lower energy physics, solar neutrino. SK detects solar neutrinos through neutrino-electron elastic scattering, where the energy, direction, and time of the recoil electron are measured. Due to its large (22.5 kton) fiducial mass SK makes precise measurements of 8B solar neutrinos, including precision information on their energy spectrum and its time variation.
Since SK-III started, we have made many efforts to reduce backgrounds. The most serious background comes from the beta decay of 214Bi, which is produced in the decays of radon in the air and detector materials as well as from radium in the water. In order to reduce the 214Bi background, the SK water system has been upgraded. First, the cooling power of the heat exchanger for the supply water was increased so as not to induce convection in the tank, which transports radon near the PMTs into the fiducial volume. Second, new membrane degasifier units were added to increase the efficiency of radon removal from the supply water. Third, the water flow in the detector was precisely investigated and optimized to reduce the background contamination in the fiducial volume as much as possible. During the SK-IV period we have introduced a precise temperature control system for the inlet water to further reduce convection in the water.
As a result of these improvements, the background rate in the lower energy region in SK-IV has been reduced by a factor of more than three compared to the SK-I period. Further, it has allowed a lower analysis energy threshold. Until the end of March 2012, 1069.3 days of SK-IV solar neutrino data for analysis was taken. A clear solar neutrino signal in the 3.5-4.0 MeV kinetic energy region was observed at more than . In addition, we developed a new analysis method for these low energy regions based on the amount of multiple Coulomb scattering of electrons using the PMT hit pattern of the Cherenkov cone. Lower energy electron hit patterns (i.e. the 214Bi background) are more isotropic than those of the higher energy solar neutrino recoil electrons. This analysis improves the statistical uncertainty of the number of signal events by about 10 %. We use this new method for recoil energies below 7.5 MeV.
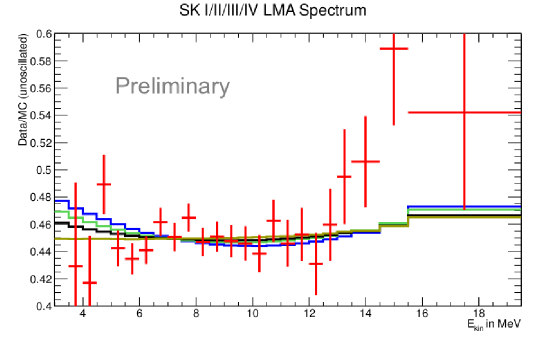
Figure 2 shows SK-I to SK-IV combined energy spectrum with expectations from the solar global and solar+KamLAND as well as flat reduction of the neutrino spectrum. The vertical axis shows the ratio of the observed energy spectrum to the expectation from the unoscillated MC simulation assuming a 8B flux of 5.25 cm-2s-1. The combined energy spectrum is consistent with the flat prediction, but the level of favoring flat over the upturn is 1.11.9 level.
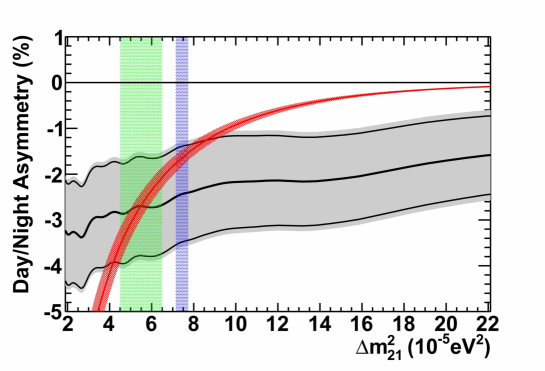
Concerning differences in the day and night fluxes the expected flux asymmetry, defined as , is about based on current understanding of neutrino oscillation parameters. Although this is not a large effect, long term observations by SK enable discussion of a finite value of the day-night asymmetry. The value using the combined SK-I to SK-IV data is , which is a 2.3 difference from zero. Figure.3 shows as a function of together with the expectation. The observed is consistent with the expectation using the best fit from both KamLAND and the global solar analysis.
We performed a global solar neutrino oscillation analysis including all SK data (SK-I [1],SK-II [2], SK-III [3], and SK-IV) as well as the most recent results from SNO [4], the radiochemical experiments [5, 6] and the latest 7Be flux measurement from Borexino [7]. This analysis was then compared and combined with the reactor neutrino results from KamLAND [8]. The obtained range of sin from the solar global analysis is , while the value of the KamLAND reactor analysis is . In the combined fit sin was found to be , which is a roughly 2 hint that is different from zero. This has been already discussed prior to 2010 [3]. After 2011, the T2K and reactor experiments presented indications and later evidence for a finite . The combination of their measurements yields and the result of the combined analysis of the global solar and KamLAND reactor data is consistent with this value.
Assuming is fixed at 0.025, the obtained parameters from the global solar analysis are eV2 and sin. Comparing these values with those from KamLAND, (eV2 and sin), there is a 1.8 level tension in the results. Combining the global solar data with KamLAND, the oscillation parameters become eV2 and sin.
3 NEWAGE
Among the most plausible dark matter candidates, Weakly Interacting Massive Particles (WIMPs), which are expected to couple to ordinary matter primarily through the weak force, can be detected directly through observation of nuclear recoils produced in their elastic scattering interactions with detector nuclei [9]. The most convincing signature of the WIMPs appears in the directions of nuclear recoils. It is provided by the earth’s velocity through the galactic halo (230 km/s) and the distribution of the nuclear recoil direction shows a large asymmetry. Hence, detectors sensitive to the direction of the recoil nucleus would have a great potential to identify WIMPs. Time Projection Chambers (TPCs) with fine spacial resolutions are among such devices, and we are developing a micro-TPC [10, 11], which can detect three-dimensional fine tracks of charged particles. Since the energy deposits of WIMPs to nuclei are only a few tens of keV and the range of nuclei is limited, the micro-TPC should be operated at low pressures. We are interested in operating the micro-TPC with CF4 because 19F has a special sensitivity to SD interactions for its unique spin structure.
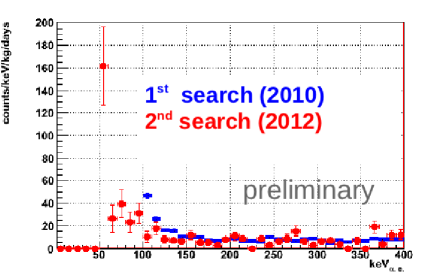
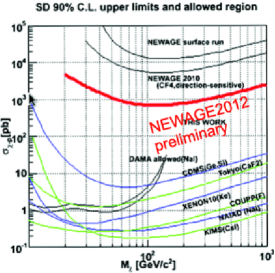
We performed our first dark matter search in 2010 at Kamioka laboratory using NEWAGE-0.3a detector [12]. The exposure was 0.524 kgdays. The gas pressure was 152 Torr and the energy threshold was 100 keV. Then, second search was conducted from January 2012 to May 2012. This exposure was 0.140 kgdays with the same gas pressure as before and the energy threshold was lowered to 50 keV. Figure 4 shows the energy spectra and exclusion limits obtained through these searches. We set a limit of 800 pb for 100 GeV WIMPs, however it is indispensable to lower the threshold and background. In this presentation, we report on the study of lowering the energy threshold via operating the detector in lower pressure.
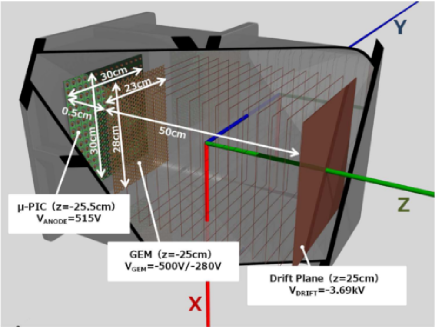
The low pressure gas study was performed using NEWAGE-0.3b detector in the surface laboratory. A schematic drawing of NEWAGE-0.3b is shown in Figure 5 The size of the -PIC (No.SN070309-3) is cm cm, and the number of pixels is 768768. We supply a positive high voltage to the anode electrodes of the -PIC (). A large area GEM, consisting of a 50 mm-thick polyimide layer sandwiched between 5 mm-thick copper electrodes is set at 5 mm above the -PIC to obtain sufficient gain. The size of the GEM is 23 cm28 cm, and this GEM is segmented into 8 parts to reduce the risk by discharges. We supply negative high voltages at the top (gas-volume side: ) and bottom (-PIC side: ) of the GEM. The drift length is 50 cm and the detection volume is surrounded by a drift cage to form the electric field. The size of the drift cage is cm. Copper electrodes are formed on the inner surface of the drift cage by every 1 cm. We supply a positive high voltage () to the drift plane. These detector components are set in a chamber made of SUS304 stainless steel whose inner surface was electro-polished to reduce out-gassing. The chamber was filled with CF4 gas at 76 Torr. A dedicated electronics system was used for the measurement. Details of the electronics are described in [12] and the references therein. Three-dimensional tracks were detected by the discriminated ”hit” signals of 768 anode strips and 768 cathode strips and the anode-cathode coincidence-timing. Energy of each track was determined by the summed waveform.
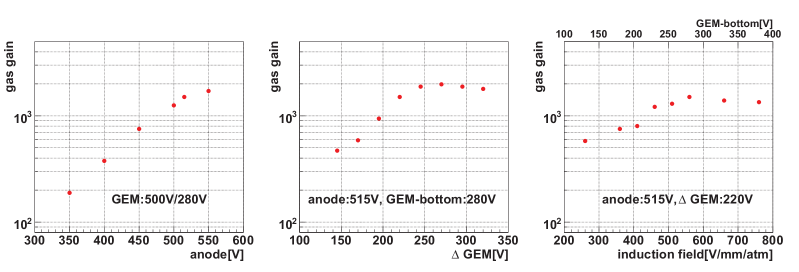
As a beginning, the gain dependence on the bias voltages was measured to optimize operation parameters for CF4 at 76 Torr. We had operated the previous NEWAGE-0.3a at a gas gain of 700 with 152 Torr gas. Accordingly, the optimum gas gain should be 1400 at 76 Torr, because the primary electron density became 1/2 of the previous detector. In Figure 6, the obtained gas gain against , , and the induction field (). The other two parameters are fixed in each plot. The gas gain increased with until the voltage was limited by discharged. As for and , gain curves saturate below 2000. This gain suppression is due to the operation in low gas pressure. The mean free path of an electron in 76 Torr of CF4 gas is several mm, and this length is close to the thickness of the GEM (50 mm), therefore the gas amplification at the GEM is to be suppressed. Although it turned out that the gain is saturated, we have achieved the required gas gain of 1400. The optimized parameters are V, V, V and kV.
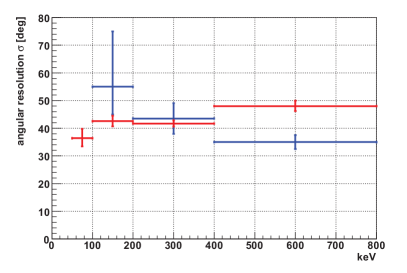
Then, the angular resolution of NEWAGE-0.3b was evaluated using nuclear tracks by neutrons from a 252Cf source. We determined the angular resolution by comparison of measured and simulated distributions of the recoil angle. The results are shown in Figure 7.
We plan to move the NEWAGE-0.3b detector to Kamioka underground in 2013. In order to operate it with lower pressure gas, we need an even higher gas gain. As shown in above the gain is saturated at around 2000 in the current set up, therefore we have started to test a new GEM which has a thickness of 100 mm instead of 50 mm. We are also improving the data acquisition system (DAQ) for recording the time-over-threshold (TOT) of the -PIC signals in order that we can measure the energy deposition at each strip.
4 XMASS
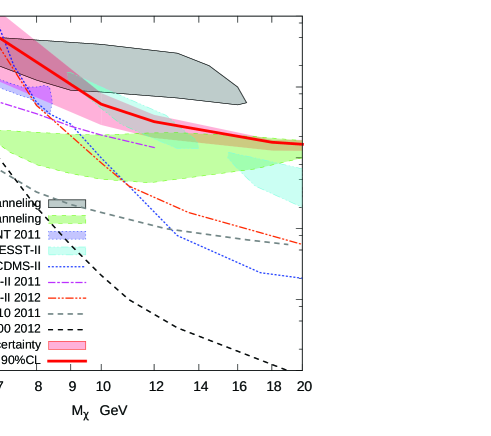
Over the past 10 years, some experiments indicate a possible WIMP signal [13, 14, 15] with a lighter mass of GeV and with a spin-independent cross section of the order of . These positive signals have come predominantly from experiments without the capability to discriminate between electromagnetic and nuclear recoils, while other experiments that have this ability have excluded light WIMPs at these cross-sections [16, 17, 18]. In this presentation, a search for light WIMPs using a 5591.4 kgday exposure of the XMASS experiment without nuclear recoil discrimination is presented.
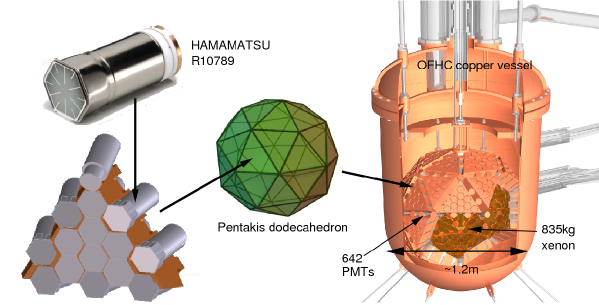
XMASS is a single phase liquid xenon scintillator detector containing 1050 kg of Xe in an OFHC copper vessel. As shown in Figure. 8 xenon scintillation light is collected by 630 hexagonal and 12 cylindrical inward-pointing Hamamatsu R10789 series photomultiplier tubes (PMTs) arranged on an 80 cm diameter pentakis-dodecahedron support structure within the vessel to give a total photocathode coverage of 62.4 %. These PMTs view an active target region containing 835 kg of liquid xenon. In order to monitor the PMT stability and measure the trigger efficiency, eight blue LEDs with Teflon diffusers are mounted to the support structure. There are six LEDs arranged along the equator and one each at the top and the bottom of the pentakis-dodecahedron. To shield the scintillator volume from external gammas, neutrons, and muon-induced backgrounds, the copper vessel is placed at the center of a 10 m 11 m cylindrical tank filled with pure water. This volume is viewed by 72 Hamamatsu R3600 20-inch PMTs to provide both an active muon veto and passive shielding against these backgrounds. This is the first water Cherenkov shield used in a dark matter search experiment. To perform energy and position reconstruction calibrations a portal has been prepared along the central vertical axis (-axis) of the PMT support structure through which an OFHC copper rod can be inserted directly into the target volume. Thin cylindrical calibration sources containing either of 55Fe, 57Co, 109Cd, or 241Am are placed at the tip of this rod to perform detector calibrations. A more detailed description of the XMASS detector is presented in [19].
The data used for this analysis, corresponding to 6.70 days of livetime, was taken in February 2012 with a low trigger threshold of four PMT hits [20]. Using 122 keV gammas from the 57Co calibration source the xenon light yield was found to be 14.7 photoelectrons/keVee. This large light yield allows the analysis threshold to be lowered sufficiently for sensitivity to low mass WIMPs. In order to achieve optimal sensitivity, the entire detector volume is used because fiducialization is increasingly difficult at these low energies. A sequence of data reduction is applied to remove events caused by the tail of the scintillation light distribution after energetic events; (1) events triggered only with the liquid xenon detector are selected, (2) events that occurred within 10 ms of the previous event are rejected, and (3) events whose timing distribution has an RMS greater than 100 ns are removed. The last cut is applied to remove Cherenkov events originated from 40K contamination in the PMT photocathodes; events with more than 60% of their PMT hits occurring within the first 20 ns of the event window are removed as Cherenkov-like.
Figure 9 shows simulated WIMPs energy spectra overlaid on the observed spectrum after the data reduction was applied. WIMPs are assumed to be distributed in an isothermal halo with km/s, a galactic escape velocity of km/s, and an average density of 0.3 GeV/cm3. In order to set a conservative upper bound on the spin-independent WIMP-nucleon cross section, the cross section is adjusted until the expected event rate in XMASS does not exceed the observed one in any energy bin above the analysis threshold. It is chosen as the energy at which the trigger efficiency is greater than 50% for 5GeV WIMPs and corresponds to 0.3 keVee.
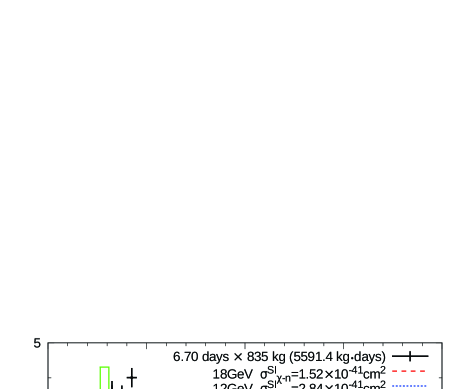
The resulting 90 % confidence level (C.L.) limit is shown in Figure 10. The impact of the uncertainty from [21] is large in this analysis, so its effect on the limit is shown separately in the figure.
After careful study of the events surviving the analysis cuts, their origins are not completely understood. Contamination of 14C in the GORE-TEX sheets between the PMTs and the support structure may explain a fraction of the events. Light leaks through this material are also suspect. Nonetheless, the possible existence of a WIMP signal hidden under these and other backgrounds cannot be excluded. Although no discrimination has been made between nuclear-recoil and electronic events, and many events remain in the analysis sample, the present result excludes part of the parameter space favored by other measurements [13, 14, 15] when those data are interpreted as a signal for light mass WIMPs.
The fiducial volume analysis is ongiong for more sensitive searches. In addition, we are working on modifications to the inner surface of XMASS, especially around the PMTs, to improve the detector performance. Finally, a R&D project aiming at modification to single phase liquid xenon TPC with charge readout has been started.
References
References
- [1] J. Hosaka et al. 2006 Phys. Rev. D 73 112001.
- [2] J. P. Cravens et al. 2008 Phys. Rev. D 78 032002.
- [3] K. Abe at al. 2011 Phys. Rev. D 83 052010.
- [4] B. Aharmim et al. arXiv:1109.0763.
- [5] B. T. Cleveland et al. 1998 Astrophys. J. 496 505.
- [6] J. N. Abdurashitov et al. 2009 Phys. Rev. C 80 015807.
- [7] G. Bellini et al. 2011 Phys. Rev. Lett. 107 141302.
- [8] A. Gando et al. 2011 Phys. Rev. D 83 052002.
- [9] G.Jungman, M.Kamionkowski, and K.Griest, Phys. Rep. 267 (1996) 195.
- [10] H. Nishimura et al. 2009 Astropart. Phys. 31 185.
- [11] H. Sekiya et al. 2006 Nucl. Instr. Meth. A 573 204.
- [12] K. Miuchi et al. 2010 Phys. Lett. B 686 11.
- [13] R. Bernabei et al. 2008 Eur. Phys. J. C 56 333; R. Bernabei et al. 2010 Eur. Phys. J. C 67 39.
- [14] C. E. Aalseth et al. 2011 Phys. Rev. Lett. 106 131301.
- [15] G.Angloher et al. 2012 Eur. Phys. J. C 72 1971.
- [16] E. Aprile et al. arXive:1207.5988; J. Angle et al. 2011 Phys. Rev. Lett. 107 051301.
- [17] Z. Ahmed et al. 1619 Science 327 1619; Z. Ahmed et al. 2011 Phys. Rev. Lett. 106 131302.
- [18] E. Armengaud et al. 2012 Phys. Rev. D 86 051701(R).
- [19] K. Abe et al. arXive:1301.2815.
- [20] K. Abe et al. 2013 Phys. Lett. B 719 78.
- [21] E. Aprile et al. 2011 Phys. Rev. Lett. 107 131302.
- [22] J. Angle et al. 2011 Phys. Rev. Lett. 107 051301.