Virtual water controlled demographic growth of nations
Abstract
Population growth is in general constrained by food production, which in turn depends on the access to water resources. At a country level, some populations use more water than they control because of their ability to import food and the virtual water required for its production. Here, we investigate the dependence of demographic growth on available water resources for exporting and importing nations. By quantifying the carrying capacity of nations based on calculations of the virtual water available through the food trade network, we point to the existence of a global water unbalance. We suggest that current export rates will not be maintained and consequently we question the long-run sustainability of the food trade system as a whole. Water rich regions are likely to soon reduce the amount of virtual water they export, thus leaving import-dependent regions without enough water to sustain their populations. We also investigate the potential impact of possible scenarios that might mitigate these effects through (1) cooperative interactions among nations whereby water rich countries maintain a tiny fraction of their food production available for export; (2) changes in consumption patterns; and (3) a positive feedback between demographic growth and technological innovations. We find that these strategies may indeed reduce the vulnerability of water-controlled societies.
1 Introduction
Most of the water we use is to produce the food we eat. With the world’s population that has doubled every 40 years there is a growing concern that water limitations will soon impede humanity to meet its food requirements (1-7). The urgency to deal with this alarming situation by developing durable socio-political and economic strategies that promote a sustainable use of the environment and its natural resources, was at the core of the recent Rio+20 Earth Summit organized by United Nations (7-8). In recent years a number of studies have combined projections of population growth with predictions of water availability and agricultural productivity under a variety of climate change and land use scenarios. These predictions have been used to assess whether mankind will run out of water in the next few decades, and to investigate possible strategies to deal with the global water and food crisis (9-15). At the regional scale, there exist several areas of the world where the demand has already exceeded the supply of renewable freshwater resources (16-19). How can this negative water budget be sustained? Mainly by importing food. The import of food commodities is associated with a virtual transfer of freshwater resources from production to consumption areas (20). Virtual water trade allows some populations to exceed the limits imposed by their local water resources (14, 21-22). By sustaining demographic growth above the regional carrying capacity, virtual water trade has mitigated the effects of drought and famine in many regions of world (14,23). Thus, the redistribution of virtual water (VW) resources often appears as a remedy to regional water crises (22-23). Even though, presently, most exporting countries can afford to sustain VW exports, their demographic growth might soon limit the amount of VW resources they can place on the global market. At some point these societies will have to decide whether they want to sustain the existing export rates, or prefer to reduce the exports in order to meet their own food demand. What are the global implications of these two scenarios? To answer to this question, we need to relate demographic growth both to the available freshwater resources and to global patterns of VW trade. We first investigate current trends of demographic growth and then develop model-based predictions of how population is expected to change as water rich countries start reducing their exports.
2 The Carrying Capacities of Nations
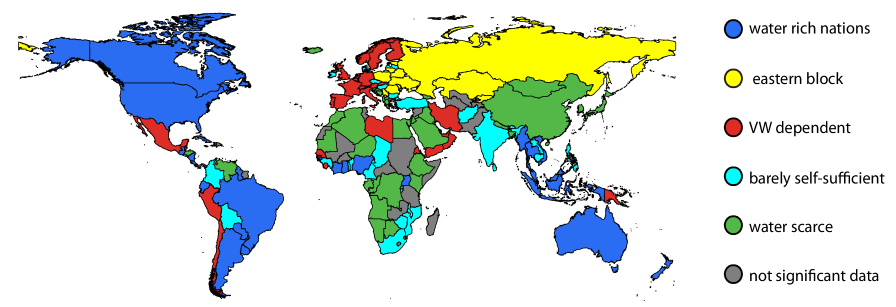
We classify all countries around the world into five groups, depending on their supply and demand of VW, and on the resulting balance or unbalance between available and consumed water resources (see Figure 1). We observe that the water-rich regions are in North and South America, Australia, and the former Soviet Union (or ”eastern block”). These regions are known for being major VW exporters (26,27). Virtual water dependent regions (i.e., regions that need VW imports to meet their demand) are mainly in Europe, Mexico, and the western side of South America. Despite VW trade, large parts of Africa and Asia remain affected by water stress. Because food production is the major form of freshwater consumption by human societies (24-25), we calculate the ”carrying capacity” of a nation, i.e. its maximum sustainable population, based on the water resources currently available for agriculture and livestock. The carrying capacity, though difficult to quantify, is a key notion for characterizing the relation existing between demographic dynamics and their possible resource limitation (7-9). In here we will show that for almost one third of all world nations (i.e. water rich and VW dependent countries), the carrying capacity depends on their food availability, which, in turn, depends on the available water resources. Therefore, a quantitative estimate of the average local carrying capacity of country is obtained dividing the total water currently available for food production in that country (i.e., the current footprint of crops, grazing and livestocks (20,21,26)), by the volume of water, , used to produce the food consumed on average by one individual in that nation (16,19,20). is the maximum population sustainable with the available local freshwater resources of country and is expressed in terms of number of individuals. The virtual carrying capacity is the maximum sustainable population of country when VW imports and exports are accounted for. Thus, the virtual carrying capacity depends on the structure of the global VW trade network (26,27). We also may incorporate in our modeling approach the impact on of changes in consumption patterns, crops expansion, and increase in the efficiency of agricultural production (26).
2.1 Relation between demographic growth and water avaliability
We analyze and model the relation between demographic growth and the water balance of water rich and VW dependent countries (for a total of N=52 nations) using a stochastic logistic model. The population dynamics, , of nation are expressed as (26)
| (1) |
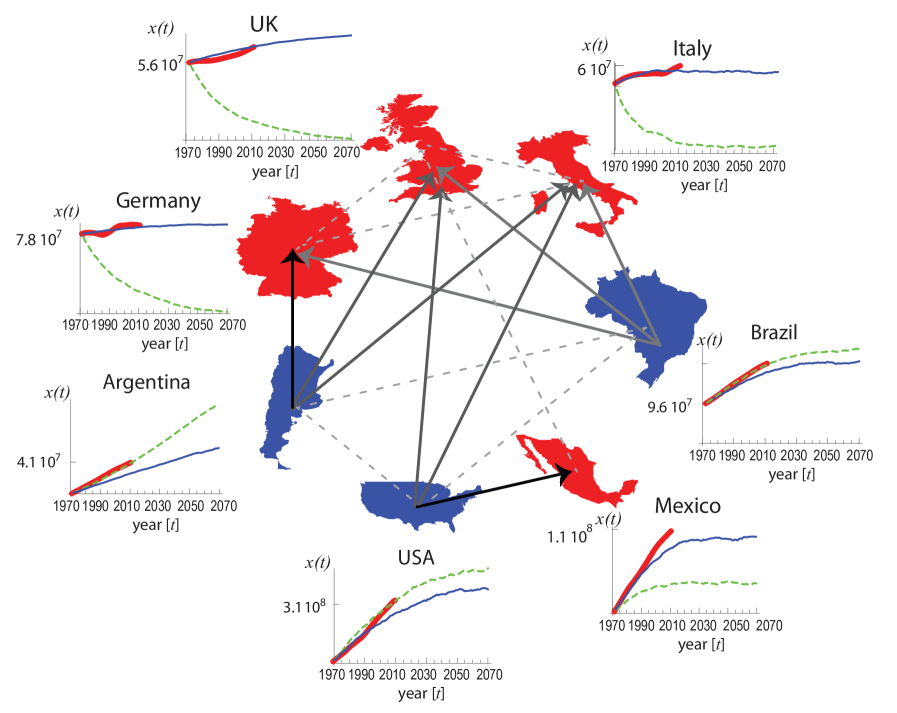
where . is treated as a random variable to account for stochastic fluctuations in available resources and for uncertainties in their estimate. Thus, is expressed as , is a white Gaussian noise with mean and covariance (26). denotes the average with respect to the stochastic fluctuations, while is the intensity of the fluctuations, and the Dirac’s delta function. The model is based on two key parameters: and . The mean population growth coefficient , is determined for each nation using demographic data for the period of record 1970-2010 (26-28). To assess whether the demographic growth of a nation is driven by either local or virtual water availability, we consider both the case of population dynamics controlled by local water resources (i.e., with average ”carrying capacity”, ) and the effect of VW trade (i.e., ).
Figures 2-3 summarize the results of this analysis. We stress that the effective carrying capacities are obtained from direct evaluation of the actual virtual water availability and water footprint calculations (26) and not from fit of demographic data. The average demographic growth of water-rich countries is well described by the logistic model (Eq. (1)) with , which indicates that the growth of these populations is driven by local water availability and is not limited by the important export of VW sustained by these nations. Interestingly, several nations seem to have just reached a critical phase in their demographic growth: the point of separation between the local water and the VW regime (see (26)). On the other hand, demographic growth of VW trade dependent nations follows the logistic model with ; thus, VW inputs may sustain the demographic growth of populations that increasingly rely on external VW resources (26). In these countries population growth would not be sustainable without the import of VW from other regions. The fact that demographic growth in water-rich countries is independent of their VW exports, while water-poor nations increasingly rely on VW imports highlights a situation that, in the long run, will be unbalanced and unsustainable. These results indicate that both water-rich and trade dependent populations are growing relying on the same pool of resources. At some point it will happen that, to meet their own demand, water-rich countries will have to reduce their exports, thereby causing the emergence of water limitations in trade dependent countries. Unless new freshwater resources become available or investments for a more water-efficient agriculture are made, these populations will have to decrease.
3 Sustainability of Future Scenarios
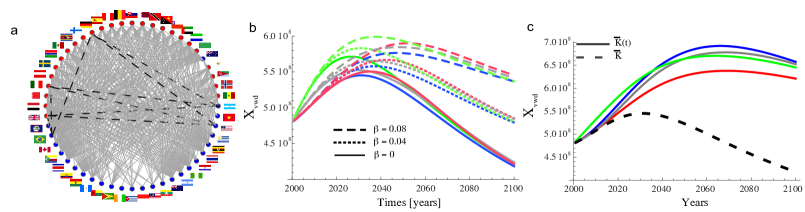
To investigate these effects we use the logistic model (Eq. (1)) coupled with the dynamics of food trade through the VW network (Figure 3a). We first build a bipartite network with nodes that interconnects water rich nations (blue nodes ) to VW trade dependent countries (red nodes ). We investigate two scenarios. In the first one,the population in blue nodes grows following Eq. (1) with , where is the maximum fraction of that water-rich countries are willing to place in the long term () in the global VW trade market. At any time , a water rich country, , with population shares with trade dependent nations a volume of water equivalent to ; we assume that this water is equally partitioned among all the trade dependent countries connected to that blue node (i.e., is the degree of node ). Therefore the population of a red node, , grows according to the Eq. (1) with virtual carrying capacity , where is the adjacency matrix describing the virtual water trade network (=1 if and are connected; =0, otherwise). The case corresponds to the purely competitive case, where in the long run and no water is exported because all resources are used to support the local population of the blue node . The second scenario takes into account plausible crop expansions, increases in agricultural production efficiency, and changes in diet and consumption rates (19,23,26), while the cooperation regime is turned off (). The relevant dynamics are expressed by the same equations as in the previous case, but critically endowed with time dependent local carrying capacities, , and per capita virtual water consumption, . In particular, we impose a growth rate in the local resources (i.e., in ) to account for possible cropland expansions and crop yield enhancement in existing croplands, and a decrease in per capita virtual water consumption (i.e., in ) due to new practices that reduce water loss (19) and changes in consumption patterns (29).
4 Discussion and Conclusions
To evaluate the impact of the network structure, we investigate the system’s dynamics in the two above scenarios using four types of networks with different structural properties but the same number of nodes and average number of links. For the first scenario, we find that in the purely competitive case () the population of trade dependent countries increases in the first 25 years and decreases in the subsequent years as a result of water limitations arising from the exclusion from the access to water resources controlled and claimed by water-rich countries (26,30). This decline continues in the following decades as a results of demographic growth in water-rich populations (Figure 3b). This behavior appears to be very robust and independent of the topological properties of the underlying network. If trade dependent countries use more VW resources than they control, their population will strongly decrease once the water rich countries start reclaiming all the water resources they have access to, no matter how water is redistributed among the trade dependent virtual water countries. The results are robust and do not qualitatively change with different strengths of the fluctuations of in the range . Interestingly, this decrease in trade-dependent population is reduced if a cooperative regime (i.e., ) is considered. If water rich countries keep a fraction, , of their water resources in the VW global market, VW dependent countries can sustain a larger population, which increases as a function of (Figure 3b). The overall effect of a cooperative regime is a long-term increase in the total global population and thus a more sustainable demographic growth. In this cooperative regime, the network topology affects the coupled VW-demographic dynamics (26). We finally note that the sensitivity of the demographic dynamics on is very strong, and just a small departure of from zero, may lead to substantial reductions in the decrease of trade dependent populations (Figure 3b and (26)).Also the second strategy, based on the enhancement of productivity efficiency and a decrease in per capita global consumption, results in a remarkable relief for trade dependent countries, whose populations are subjected to less pronounced declines (Figure 3c). We also find that the increase in food (and virtual water) availability resulting only through changes in consumption patterns and greater equity in per capita consumption would not be sufficient anyhow to meet the increasing demand of a growing human population. In fact, in the long run, if the growth rate of tends to zero, the trade dependent populations will peak and then inevitably decline (26).
Despite the presence of a number of other environmental, cultural, and health related factors not included in this study, this analysis points out how VW trade is only a temporary solution to a local-to-regional unbalance between populations and food production. The existence of this unbalanced condition might be mitigated if a cooperative regime among water rich and VW dependent nations will continue to exist even once the excess of VW in the exporting countries is strongly reduced by their demographic growth (). We finally show that strategies aiming at an increase in productivity efficiency through agricultural practices that enhance crop yields while reducing water losses (e.g., water harvesting, water conservation, genetically modified crops) improve the sustainability of trade dependent societies with respect to a decrease in export rates from water rich countries.
References
1. Brown, L. R., Flavin, C., and Postel, S. (1991). Saving the Planet: How to Shape an Environmentally Sustainable Global Economy, The Worldwatch Environmental Alert Series.
2. Falkenmark, M. J., J. Rockstrom, and H. Savenjie (2004). Balancing Water for Humans and Nature, Earthscan, London.
3. Tilman, D., Balzer, C., Hill, J. et al. (2011). Global food demand and the sustainable intensification of agriculture. PNAS, 108 (50), 20260-20264, doi: 10.1073/pnas.1116437108.
4. Barrett, C.B. (2010), Measuring Food Insecurity, Science 327 (5967), 825-828; doi: 10.1126/science.1182768
5. Gebbers, R. and Adamchuk, V. (2010) Precision Agriculture and Food Security, Science 327 (5967), 828-831; doi: 10.1126/science.1183899
6. Barnaby, W. (2009). Do nations go to war over water? Nature, 458, 282. 283, doi:10.1038/458282a.
7. Ehrlich, P.R., Kareiva, P.M. and Daily G.C. (2012) Securing Natural Capital and Expanding Equity to Rescale and Expanding Civilization. Nature 486, 68-73
8. Science for Sustainable Development (2012) Science 336 (1396)
9. Ehrlich, P.R. and Holdren, J.P. (1971) Impact of Population Growth, Science 171 (1212)
10. Rosegrant MW , M. Paisner, S. Meijer, J. Whitcover (2001) Global Food Projections to 2020: Emerging Trends and Alternative Futures, IFPRI, Washington.
11. Rosegrant, M.W. and Cline, S.A.(2003). Global food security: challenges and policies. Science 302 (5652), 1917-1919.
12. Arnell, N.W. (2004). Climate change and global water resources: SRES emissions and socio-economic scenarios. Global Environmental Change- Human Policy Dimensions, 14(1), 31-52.
13.Foley Jonathan A., et al. (2011). Solutions for a cultivated planet. Nature 478 (7369), 337-342; doi: 10.1038/nature10452
14. Kumar, M.D. and Singh, O.P. (2005) Virtual water in global food and water policy making: Is there a need for rethinking? Water Resources Management, 19 (5), 759-789, 10.1007/s11269-005-3278-0.
15 Foley et al., (2005) Global Consequences of Land Use. Science 309 (570)
16. Oki, T and Kanae, S. , (2004). Virtual water trade and world water resources. Water Science and Technology, 47 (7), 03-209
17. Godfray HCJ, et al. (2010). Food security: The challenge of feeding 9 billion people. Science 327 (5967) ,812 818; 2010 doi:10.1126/science.1185383.
18. Postel, S.L., Daily, G.C. and Ehrlich, P.R. (1996) Human Appropriation of Renewable Fresh Water. Science, 271 (785)
19. Rockstrom, J. Karlberg, J. and Falkenmark, M: (2011) Global food production in a water-constrained world:exploring ’green’, ’blue’challenges and solutions. Cambridge University Press, Cambridge, U.K.
20. Hoekstra, A., and A. Chapagain (2008). Globalization of Water, Wiley Blackwell, Malden, Mass.
21. Mekonnen, M.M. and Hoekstra, A.Y. (2012). Water footprints of humanity. PNAS 109 (9) 3232-3237, doi: 0.1073/pnas.1109936109
22. Allan, J. A. (1998). Virtual water: A strategic resource global solutions to regional deficits. Ground Water, 36(4), 545.546, doi:10.1111/j.1745- 6584.1998.tb02825.x.
23. Hanjra M.A. and M.E. Qureshi (2010). Global water crisis and future food security in an era of climate change. Food Policy, 35, 365-377.
24. Rost, S., Gerten, D., Bondeau, A., Lucht, W., Rohwer, J., Schaphoff, S. (2008). Agricultural green and blue water consumption and its influence on the global water system. Water Resources Research. doi:10.1029/2007WR006331.
25. Fedoroff, N.V., Battisti, D.S., Beachy, R.N., Cooper, P.J.M., Fischhoff, D.A., Hodges, C.N., Knauf, V.C., Lobell, D., Mazur, B.J., Molden, D., Reynolds, M.P., Ronald, P.C., Rosegrant, M.W., Sanchez, P.A., Vonshak, A., Zhu, J.-K., (2010). Radically rethinking agriculture for the 21st century. Science 327 (5967)
26. Materials and methods are available as supporting material on PNAS Online.
27 Suweis, S, Konar M, Dalin C, Hanasaki N, Rinaldo A. and Rodriguez-Iturbe I. (2011). Structure and controls of the global virtual water trade network. Geophys. Res. Lett. 38 L10403. 8.
28. Wolfram, S. (2011) Mathematica, version 8.0. CountryData Source Information.
http://reference.wolfram.com/mathematica/note/CountryDataSourceInformation.html
29. Arrow et al. (2004) Are We Consuming Too Much? Journal of Economic Perspectives, Volume 18, Number 3, 147-172
30. D’Odorico, P., F. Laio, and L. Ridolfi (2010). Does globalization of water reduce societal resilience to drought? Geophys. Res. Lett., 37, L13403, doi:10.1029/2010GL043167.