{name.surname}@barcelonamedia.org
Kaltenbrunner, Aragon, Laniado and Volkovich
Not all paths lead to Rome:
Analysing the network of sister cities
Abstract
This work analyses the practice of sister city pairing. We investigate structural properties of the resulting city and country networks and present rankings of the most central nodes in these networks. We identify different country clusters and find that the practice of sister city pairing is not influenced by geographical proximity but results in highly assortative networks.
Keywords:
Social network analysis, sister cities, social self-organisation1 Introduction
Human social activity in the form of person-to-person interactions has been studied and analysed in many contexts, both for online [7] and off-line behaviour [11]. However, sometimes social interactions give rise to relations not anymore between individuals but rather between entities like companies [4], associations [8] or even countries [2]. Often these relations are associated with economic exchanges [2], sports rivalry [9] or even cooperation [8].
In this work we study one type of such relations expressed in the form of sister city partnerships111Sometimes the same concept is also referred to as twin town, partnership town, partner town or friendship town. Here we use preferentially the term sister city.. The concept of sister cities refers to a partnership between two cities or towns with the aim of cultural and economical exchange. Sometimes these partnerships are also generated as a platform to support democratic processes. Most partnerships connect cities in different countries, however also intra-country city partnerships exist.
We extracted the network of sister cites as reported on the English Wikipedia, as far as we know the most extensive but certainly not complete collection of this kind of relationships. The resulting social network, an example of social self organisation, is analysed in its initial form and aggregated per country. Although there exist studies that analyse networks of cities (e.g. networks generated via aggregating individual phone call interactions [6]) to the best of our knowledge this is the first time that institutional relations between cities are analysed.
2 Dataset description
The dataset used in this study was constructed (using an automated
parser and a manual cleaning process) from the listings of sister
cities on the English Wikipedia.222Starting from http://en.wikipedia.org/wiki/List_of_twin_towns_and_sister_cities,
which includes links to listings of sister cities grouped by
continent, country and/or state. We found 15 225 pairs of sister
cities, which form an undirected333Although only 29.8% of the
links were actually reported for both directions. city
network of 11 618 nodes. Using the Google Maps API we were able
to geo-locate 11 483 of these cities.
We furthermore construct an aggregated undirected and weighted country network, where two countries and are connected if a city of country is twinned with a city of country . The number of these international connections is the edge weight. The country network consists of 207 countries and 2 933 links. Some countries have self-connections (i.e. city partnerships within the same country). Germany has the largest number of such self links as a result of many sister city relations between the formerly separated East and West Germany.
| network | % GC | ||||
|---|---|---|---|---|---|
| city network | % | ||||
| country network | % |
Table 1 lists the principal social network measures of these two networks. The clustering coefficient of the city network is comparable to the values observed in typical social networks [10]. Also the average path-length between two nodes nodes is with in line with the famous six-degrees-of-separation. The country network is denser, witnessed by the remarkably high value of the clustering coefficient (), and a very short average distance of .
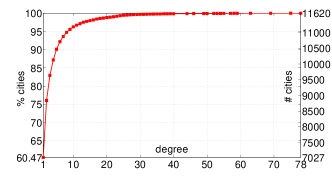
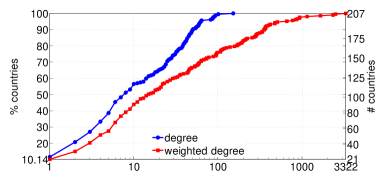
In Figure 1 we plot the degree distributions of both networks. We observe in Figure 1 (left) that more than 60% of the cities have only one sister city, about 16% have two and only less than 4% have more than 10. For the countries we observe in Figure 1 (right) that around 58% of the countries have less than 10 links to other countries, but at the same time more than 20% of the countries have more than 100 sister city connections (i.e. weighted degree ). Both networks have skewed degree-distributions with a relative small number of hubs.
| property | ||||
|---|---|---|---|---|
| city degree | 0.3407 | -0.0037 | 0.0076 | 45.52 |
| Gross Domestic Product (GDP)444Source http://en.wikipedia.org/wiki/List_of_countries_by_GDP_(nominal) | 0.0126 | -0.0005 | 0.0087 | 1.51 |
| GDP per capita555Source: http://en.wikipedia.org/wiki/List_of_countries_by_GDP_(nominal)_per_capita | 0.0777 | 0.0005 | 0.0078 | 9.86 |
| Human Development Index (HDI)666Source: http://en.wikipedia.org/wiki/List_of_countries_by_Human_Development_Index | 0.0630 | -0.0004 | 0.0075 | 8.46 |
| Political Stability Index777Source: http://viewswire.eiu.com/site_info.asp?info_name=social_unrest_table | 0.0626 | 0.0004 | 0.0090 | 6.94 |
3 Assortativity
To understand mixing preferences between cities, we follow the methodology of [3] and calculate an assortativity measure based on the Z-score of a comparison between the original sister city network and 100 randomised equivalents. For degree-assortativity, randomised networks are constructed by reshuffling the connections and preserving the degree; in the other cases, the network structure is preserved while the values of node properties are reshuffled.
Table 2 gives an overview of the results. We find that the city network is highly assortative indicating a clear preference for connections between cities with similar degree. We also analyse assortativity scores for other variables and find that cities from countries with similar Gross Domestic Product (GDP) per capita, Human Development Index or even similar indexes of political stability are more likely to twin. Only for the nominal GDP neutral mixing is observed.
4 Rankings
We discuss now city and country rankings based on centrality measures. For the sister city network we show the top 20 cities ranked by degree (Table 3, left). Saint Petersburg, often referred to as the geographic and cultural border of the West and East, is the most connected and also most central sister city. There are also cities, such as Buenos Aires, Beijing, Rio de Janeiro and Madrid, which have large degrees but exhibit lower betweenness ranks. In particular, the Spanish and the Chinese capitals have significantly lower values of betweenness, which could be caused by the fact that other important cities in these countries (e.g. Barcelona or Shanghai) act as primary international connectors.
In Table 3 (right) we present rankings for the country network. In this case the USA lead the rankings in the two centrality measures we report. The top ranks are nearly exclusively occupied by Group of Eight (G8) countries suggesting a relation between economic power and sister city connections.
| city | degree | betweenness | |
|---|---|---|---|
| Saint Petersburg | 78 | 1 562 697.97 | (1) |
| Shanghai | 75 | 825 512.69 | (4) |
| Istanbul | 69 | 601 099.50 | (12) |
| Kiev | 63 | 758 725.12 | (5) |
| Caracas | 59 | 430 330.45 | (23) |
| Buenos Aires | 58 | 348 594.25 | (36) |
| Beijing | 57 | 184 090.42 | (124) |
| São Paulo | 55 | 427 457.92 | (24) |
| Suzhou | 54 | 740 377.17 | (6) |
| Taipei | 53 | 486 042.21 | (20) |
| Izmir | 52 | 885 338.70 | (3) |
| Bethlehem | 50 | 1 009 707.96 | (2) |
| Moscow | 49 | 553 678.88 | (16) |
| Odessa | 46 | 724 833.39 | (8) |
| Malchow | 46 | 519 872.56 | (17) |
| Guadalajara | 44 | 678 060.06 | (9) |
| Vilnius | 44 | 589 031.92 | (14) |
| Rio de Janeiro | 44 | 381 637.67 | (29) |
| Madrid | 40 | 135 935.80 | (203) |
| Barcelona | 39 | 266 957.88 | (60) |
| country | weighted degree | betweenness | |
|---|---|---|---|
| USA | 4520 | 9855.74 | (1) |
| France | 3313 | 1946.26 | (3) |
| Germany | 2778 | 886.78 | (6) |
| UK | 2318 | 2268.32 | (2) |
| Russia | 1487 | 483.65 | (9) |
| Poland | 1144 | 34.09 | (33) |
| Japan | 1131 | 168.47 | (20) |
| Italy | 1126 | 849.20 | (7) |
| China | 1076 | 1538.42 | (4) |
| Ukraine | 946 | 89.22 | (27) |
| Sweden | 684 | 324.84 | (14) |
| Norway | 608 | 147.06 | (22) |
| Spain | 587 | 429.79 | (11) |
| Finland | 584 | 30.24 | (35) |
| Brazil | 523 | 332.26 | (13) |
| Mexico | 492 | 149.70 | (21) |
| Canada | 476 | 72.01 | (28) |
| Romania | 472 | 34.44 | (32) |
| Belgium | 464 | 145.18 | (23) |
| The Netherlands | 461 | 274.79 | (16) |
5 Clustering of the country network
In Figure 2 we depict the country network. Node size corresponds to the weighted degree, and the width of a connection to the number of city partnerships between the connected countries. The figure shows the central position of countries like the USA, France, UK and China in this network.
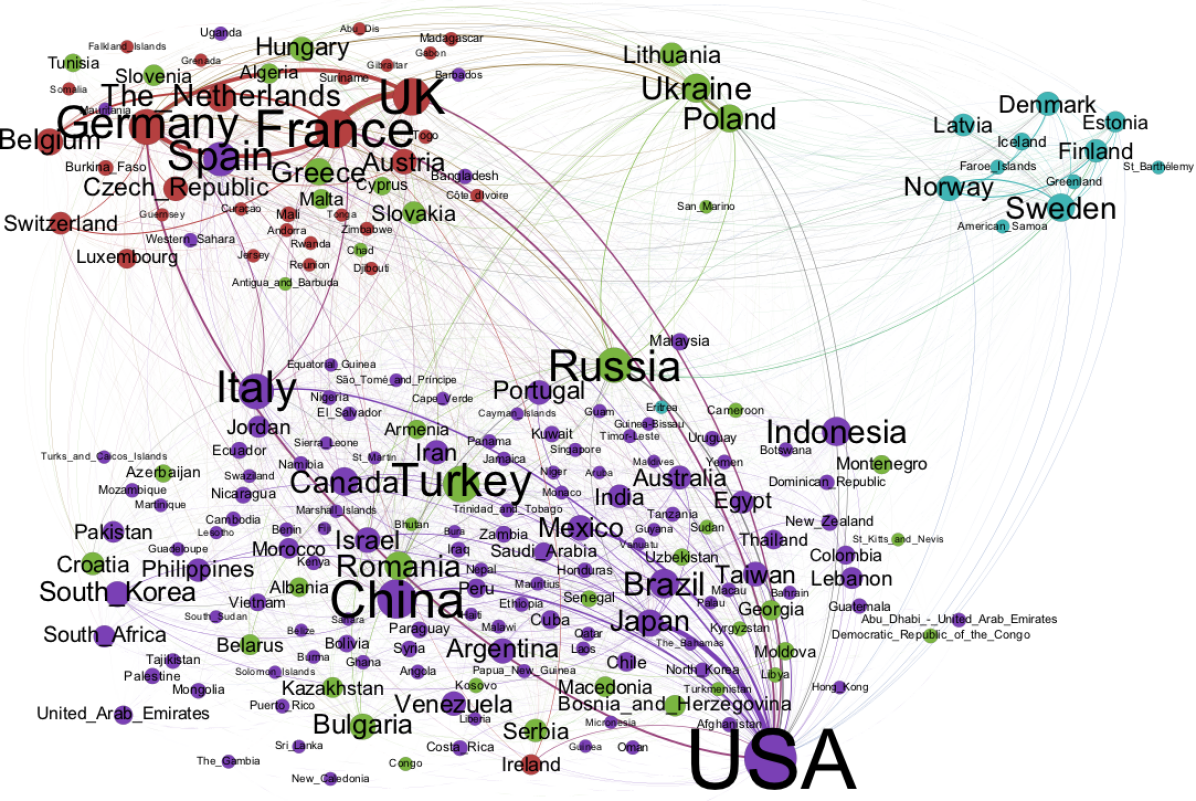
The colours of the nodes correspond to the outcome of node clustering with the Louvain method. We find 4 clusters. The largest one (in violet) includes the USA, Spain and most South American, Asian, and African countries. The second largest (in green) is composed of Eastern-European and Balkan countries: Turkey, Russia, and Poland are the most linked among them. The third cluster (in red) consists of Central and Western-European countries and some of their former colonies. It is dominated by Germany, UK, France and the Netherlands. Finally, the smallest cluster (in cyan) mainly consists of Nordic countries.
The clustering suggests cultural or geographical proximity being a factor in city partnerships. In the next section we will investigate this further.
6 Distances
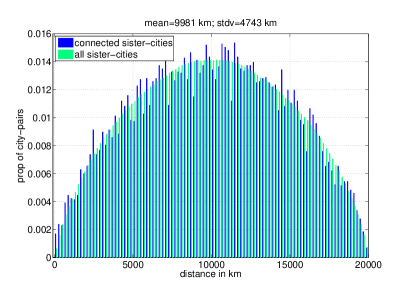
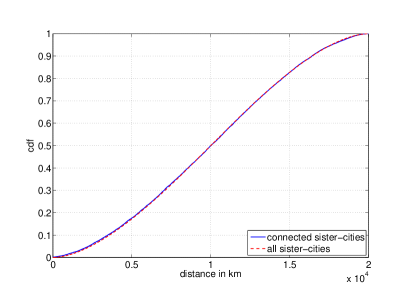
To test the extent to which geographical proximity is a important factor for city partnership we analyse the distribution of geographical distances between all pairs of sister cities.
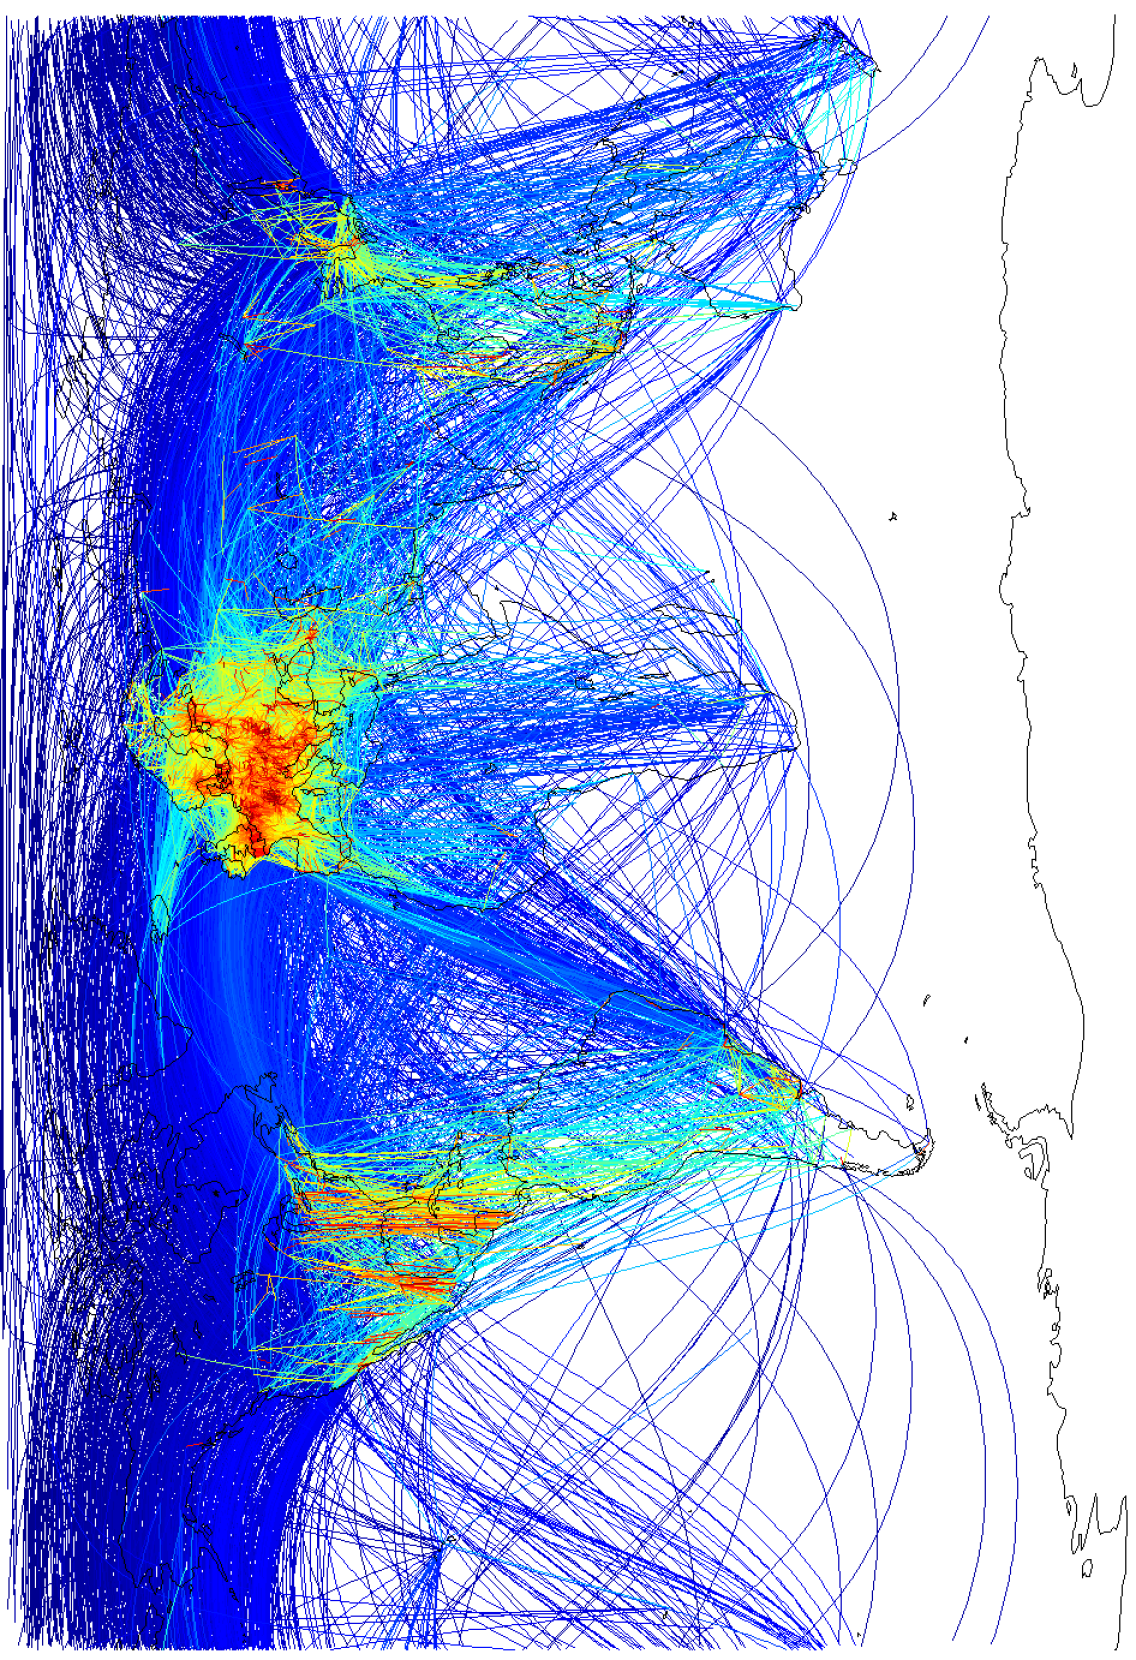
Figure 3 depicts this distribution as a histogram (blue bars in the left sub-figures) or as a cumulative distribution (blue line in the right sub-figure). The figure also shows the overall distance distribution between all geo-located sister cities (green bars and red line). We observe that there is nearly no difference (apart from some random fluctuations) between these two distributions. The fluctuations get cancelled out in the cumulative distributions where the two curves are nearly overlapping. Only for very short distances the likelihood of city partnership with close sites is a bit larger than random. This can also be observed in the very small difference between the average distance of two randomly chosen sister cities ( km) and two connected sister cities ( km). Figure 4 visualises the distances between sister cities overlaid over a World map.
7 Conclusions
We have analysed the practice of establishing sister city connections from a network analysis point of view. Although there is no guarantee that our study covers all existing sister city relations, we are confident that the results obtained give reliable insights into the emerging network structures and country preferences
We have found that sister city relationships reflect certain predilections in and between different cultural clusters, and lead to degree-assortative network structures comparable to other types of small-world social networks. We also observe assortative mixing with respect to economic or political country indexes.
The most noteworthy result may be that the geographical distance has only a negligible influence when a city selects a sister city. This is different from what is observed for person-to-person social relationships (see for example [5]) where the probability of a social connection decays with the geographical distance between the peers. It may, thus, represent the first evidence in real-world social relationships (albeit in its institutional form) for the death of distance, predicted originally as a consequence of decrease of the price of human communication [1].
Possible directions for future work include combination of the analysed networks with the networks of air traffic or goods exchange between countries.
References
- [1] Cairncross, F.: The death of distance: How the communications revolution is changing our lives. Harvard Business Press (2001)
- [2] Caldarelli, G., Cristelli, M., Gabrielli, A., Pietronero, L., Scala, A., Tacchella, A.: A network analysis of countries’ export flows: Firm grounds for the building blocks of the economy. PLoS ONE 7(10) (10 2012) e47278
- [3] Foster, J., Foster, D., Grassberger, P., Paczuski, M.: Edge direction and the structure of networks. PNAS 107(24) (2010) 10815–10820
- [4] Höpner, M., Krempel, L.: The politics of the German company network. Competition and Change 8(4) (2004) 339–356
- [5] Kaltenbrunner, A., Scellato, S., Volkovich, Y., Laniado, D., Currie, D., Jutemar, E.J., Mascolo, C.: Far from the eyes, close on the Web: impact of geographic distance on online social interactions. In: Proceedings of WOSN’12, ACM (2012)
- [6] Krings, G., Calabrese, F., Ratti, C., Blondel, V.: Scaling behaviors in the communication network between cities. In: Computational Science and Engineering, 2009. CSE’09. International Conference on. Volume 4., IEEE (2009) 936–939
- [7] Mislove, A., Marcon, M., Gummadi, K.P., Druschel, P., Bhattacharjee, B.: Measurement and analysis of online social networks. In: Proc. of IMC. (2007)
- [8] Moore, S., Eng, E., Daniel, M.: International NGOs and the role of network centrality in humanitarian aid operations: A case study of coordination during the 2000 Mozambique floods. Disasters 27(4) (2003) 305–318
- [9] Mukherjee, S.: Identifying the greatest team and captain—a complex network approach to cricket matches. Physica A (2012)
- [10] Newman, M., Watts, D., Strogatz, S.: Random graph models of social networks. PNAS 99(Suppl 1) (2002) 2566–2572
- [11] Wasserman, S., Faust, K.: Social network analysis: Methods and applications. Volume 8. Cambridge University Press (1994)