THE OPEN CLUSTER NGC2437 (Messier 46) 11affiliation: Based on observations obtained with MegaPrime/MegaCam, a joint project of CFHT and CEA/DAPNIA, at the Canada-France-Hawaii Telescope (CFHT) which is operated by the National Research Council (NRC) of Canada, the Institut National des Sciences de l’Univers of the Centre National de la Recherche Scientifique (CNRS) of France, and the University of Hawaii.
Abstract
The stellar content of the open cluster NGC 2437 (Messier 46) is investigated using moderately deep and MegaCam images. When compared with solar metallicity isochrones, the and CMDs are consistent with an age log(t, a distance modulus , and a color excess . The luminosity function (LF) of main sequence stars in the magnitude range (i.e. masses M⊙) has a shape that follows solar neighborhood star counts. However, at fainter magnitudes the cluster LF is flat, in contrast with what would be expected from solar neighborhood counts. The clustering properties of stars in NGC 2437 are investigated by examining the two-point angular correlation functions of main sequence stars in different brightness ranges. Main sequence stars fainter than are less centrally concentrated than brighter stars and are found over a larger area of the sky, suggesting that there is a corona of faint main sequence stars around NGC 2437. Based on the flat LF and extended spatial distribution of faint stars, it is concluded that NGC 2437 is actively shedding stars with masses M⊙.
1 INTRODUCTION
Star clusters are basic targets for observational studies of stellar and galactic evolution. However, the majority of clusters are short-lived, being disrupted after only a few Myr (e.g. Lada & Lada 2003) probably due to large-scale mass loss driven by supernovae and stellar winds. The clusters that survive their infancy are likely those with initial conditions that (1) allow them to develop regions early-on where stars are the dominant mass component, thereby reducing the disruptive influence of gas loss, and/or (2) are in a contracting phase of their dynamical evolution at the time of peak gas expulsion (e.g. Smith et al. 2011). Clusters that are seen at the present day may then be biased examples of the majority of clusters that initially formed.
The spatial distribution of stars within clusters provide insights into their past history. Clusters that are younger than a few tens of Myr can be surrounded by diffuse halos that contain some of the most massive cluster members (e.g. Davidge 2012). The spatially dispersed nature of these massive stars is likely the consequence of the large-scale loss of gas early in the evolution of the cluster (Bastian & Goodwin 2006). The central bodies of older clusters are surrounded by coronae populated by low mass stars (e.g. Kholopov 1969), which are expected to move to the cluster periphery due to dynamical relaxation (e.g. Prisinzano et al. 2003; Sharma et al. 2006). Stars in the outermost cluster regions will be the most susceptible to stripping, and as clusters in the disk disperse they may leave debris trails that extend over large swaths of the sky (e.g. Chumak & Rastorguev 2006; Chumak et al. 2009).
In the present study, and images obtained with the Canada-France-Hawaii Telescope (CFHT) MegaCam are used to examine the stellar content of the open cluster NGC 2437. NGC 2437 is an interesting target for investigation as it is nearby and has a mass and age that make it pertinent for studies of cluster disruption. Basic properties of NGC 2437, taken from the WEDBA database (Mermilliod 1995), are listed in Table 1.
It is somewhat surprising that – despite being a relatively nearby and well-populated intermediate age cluster – NGC 2437 has not yet been extensively studied with electronic detectors. Sharma et al. (2006) use CCD images to investigate stars in NGC 2437 to as faint as , and find a distance of 1.51 kpc () and an age log(t. Their data trace the radial distribution of stars out to 20 arcmin from the cluster center. Sharma et al. (2006) find that NGC 2437 is more spatially extended in the near-infrared than at visible wavelengths, hinting that the redder (lower mass) cluster members may be more widely distributed than the bluer (higher mass) members. Still, despite this hint that mass segregation may be underway, Sharma et al. (2008) find that stars as faint as in NGC 2437 have a mass function exponent that is consistent with the Salpeter (1955) value.
The specific goals of the present study are (1) to estimate the age, reddening, and distance of NGC 2437, and (2) to search for signatures of cluster dissruption by examining the cluster luminosity function (LF) and the spatial distribution of cluster stars spanning a range of masses. A discussion of the observations and their reduction is provided in §2. Particulars of the photometric measurements are discussed in §3, while the cluster CMDs and LFs are examined in §§4 and 5. The spatial distribution of stars in the cluster is investigated in §6. A summary and discussion of the results follows in §7. The use of different criteria for identifying objects with suspect photometry and the possible relationship between NGC 2437 and the planetary nebula (PN) NGC 2438 are investigated in the Appendix.
2 OBSERVATIONS
The data were recorded with the CFHT MegaCam (Boulade et al. 2003) as part of program 2010BD89. The detector in MegaCam is a mosaic of thirty-six E2V CCDs arrayed in a format with 0.185 arcsec pixel-1 sampling. There are 80 arcsec gaps between the three CCD banks, and 13 arsec gaps between individual CCDs. A single exposure images a degree2 field.
Details of the observations are summarized in Table 2. Images with short and long integration times were recorded to extend the magnitude range of detected stars. The minimum exposure time in was longer than in the other filters to avoid potential charge transfer problems that could arise from the low sky levels recorded through this filter during dark time.
Initial processing was done with the CFHT ELIXIR pipeline, and this included bias subtraction and flat-fielding. The ELIXIR-processed images were corrected for positional offsets between images that are recorded in different filters. These offsets vary in size with location in the science field, and are typically a few pixels (i.e. arcsec) near the edge of the MegaCam field when and images are aligned near the center of the detector mosaic. Offsets between the and images are much smaller. These distortions were corrected in a differential manner by using the IRAF GEOMAP and GEOTRANS routines to map the and images of each cluster into the reference frame defined by the image.
3 PHOTOMETRIC MEASUREMENTS
3.1 Stellar Brightnesses
Target lists and point spread functions (PSFs) were obtained by running routines in the DAOPHOT (Stetson 1987) package. There are many unsaturated stars with high S/N ratios in the images, and PSFs were constructed by combining 50 – 100 of the most isolated of these in each filter. Faint companions were removed iteratively by subtracting progressively improved versions of the PSF.
Stellar brightnesses were measured with the PSF – fitting routine ALLSTAR (Stetson & Harris 1988). Sources that are not well-matched by the PSF, and/or that hinder convergence to a stable solution are rejected by ALLSTAR. Still, the photometry catalogue that is output by ALLSTAR contains sources with poor photometry, and some of these can be identified using information that is provided by ALLSTAR. Following Davidge (2010), such objects in the CFHT images were identified using , the error in magnitude that is computed by ALLSTAR.
Stars that are neither saturated nor blended define a monotonic relation between and magnitude. Objects that depart from this relation tend to be background galaxies (e.g. Figure 2 of Davidge 2010), unresolved blends, saturated stars, or cosmetic defects, and these were removed from the photometric catalogues. Objects with magnitudes, the majority of which are near the faint limit of the photometry, were also deleted. The use of other ALLSTAR-computed indices to identify objects with suspect photometry is investigated in the Appendix.
3.2 Calibration
Instrumental magnitudes were transformed into the SDSS system by applying linear transformation relations with zeropoints obtained from observations of photometric standards that are recorded during each MegaCam observing period. The transformation warrants some discussion, as the effective wavelengths of the and filters differ by , in the sense that is redder. This difference in effective wavelength is particularly acute as the filter samples the Balmer discontinuity. The difference between the filter passband then affects the ability to obtain reliable magnitudes for intermediate spectral-type high surface gravity stars from magnitudes (Clem et al. 2008). While previous experience demonstrates that a reliable transformation can be acheived using a linear transformation equation, that result is restricted to intrinsically luminous stars with weak Balmer breaks (e.g. Davidge & Puzia 2011; Davidge et al. 2012).
Bright main sequence stars in NGC 2437 have an intermediate spectral-type, and so have strong Balmer discontinuities. Because cluster members have a (more-or-less) common, measureable reddening, their magnitudes could be transformed into magnitudes using – say – a non-linear relation like that found by Clem et al. (2008), which would result in corrections of up to magnitudes being applied to the magnitudes of late B and early A-type main sequence stars. However, the application of a non-linear relation that involves large corrections to field stars, which have a range of reddenings and evolutionary states, is much less secure, as there is the potential to produce final magnitudes that are greatly in error. For example, the large transformation corrections from Clem et al. (2008) that are appropriate for A and B main sequence stars would be applied in error to stars of later spectral-type that have had their reddening underestimated. To prevent introducing such large errors into the transformed magnitudes, a psuedo magnitude, was computed for each source using a linear transformation relation. In §4 it is demonstrated that the SEDs of stars with magnitudes match those computed using over most of the color range sampled in NGC 2437.
3.3 Artificial Star Experiments
Sample completeness and uncertainties in the photometry – both random and systematic – were assessed by running artificial star experiments. The artificial stars were assigned colors and brightnesses that are representative of objects in NGC 2437. As with the actual observations, an artificial star was considered to be detected only if it was recovered in at least two filters (either or ). The photometric catalogues produced by ALLSTAR as part of these experiments were filtered with the -based criteria that were applied to the science data.
Errors in the photometry were estimated by comparing the input and measured brightnesses of artificial stars, and then computing the mean difference and the dispersion about the mean at various magnitudes. Completeness and the uncertainties in the photometry are coupled, in the sense that random and systematic uncertainties in the photometry climb rapidly towards fainter magnitudes when the completeness is below 50%. The magnitude at which 50% completeness occurs, which is near in the deep exposures of NGC 2437, is thus one measure of the photometric faint limit.
4 RESULTS: CMDs
The and CMDs of sources in and around NGC 2437 are shown in Figures 1 and 2. Measurements with and were obtained from the short exposure MegaCam images. The open squares are stars with from Lynga (1960), and the published magnitudes were transformed into the SDSS system using the relations from Smith et al. (2002) and Jordi et al. (2006). The envelope of random errors computed from the artificial star experiments is shown in the lower left hand corner of each CMD. The uncertainties in the photometry become substantial for objects fainter than .
The main sequence of NGC 2437 cuts diagonally across both CMDs, although the ability to trace it is compromised at some points by contamination from non-cluster objects. These contaminants are a mix of field stars and galaxies, although the contribution from galaxies should be modest given the low Galactic latitude of NGC 2437. In addition to producing the diffuse spray of points that is scattered over both CMDs, field stars populate two distinct features, the most prominent of which is a near-vertical blue plume. This feature intersects the main sequence of NGC 2437 near , complicating efforts to trace the cluster sequence in this part of the CMD. Field main sequence stars also populate the vertical plume near the faint end of the CMD. This feature intersects the faint end of the cluster main sequence.
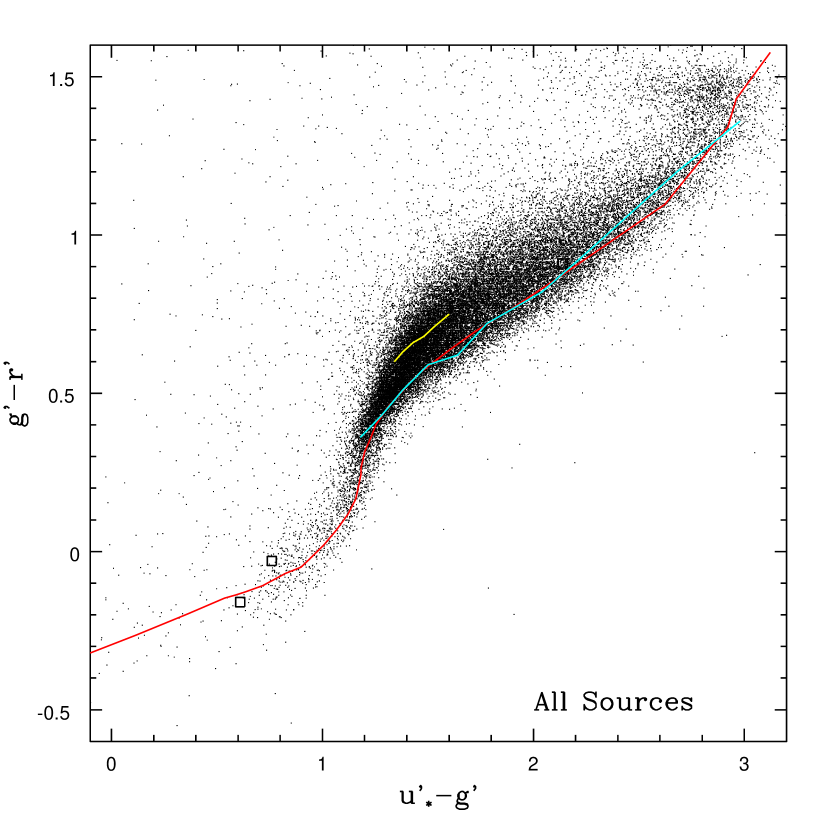
The two-color diagram (TCD) is shown in Figure 3. The cyan line is the locus of main sequence stars traced from the and CMDs of NGC 2437. The red line is the locus of Galactic main sequence stars from Johnson (1966), transformed into the SDSS system using relations from Smith et al. (2002) and Jordi et al. (2006), and then reddened to match the of NGC 2437 using the relations in Table 6 of Schlegel et al. (1998). The agreement between these two sequences suggests that the magnitudes are reasonable proxies for SDSS magnitudes over much of the color range sampled by these data.
The spectral-energy distributions (SEDs) of many non-cluster objects will differ from those of cluster sources, raising the prospect that at least some contaminating objects can be identified based on their location on the TCD. Consider the ridgeline of the field star plume, which is shown as the cyan line in Figure 3. This is an almost vertical feature on the CMDs, and so occupies a comparatively modest range of colors in the TCD when compared with solar neighborhood and NGC 2437 main sequence stars. Still, field stars on this sequence are offset magnitude along the axis from the cluster sequence on the TCD – at least some of the sources on this very prominent feature can be identified based on their locations on the TCD.
For the current study, two samples of objects are defined based on their location on the TCD. ‘Cluster’ stars are those that lie within magnitude in of the NGC 2437 main sequence on the TCD, while ‘non-cluster’ objects are those that occupy the rest of the TCD. Experiments indicated that this color envelope is the narrowest that preserves cluster main sequence stars. The application of a tighter color envelope about the NGC 2437 sequence on the TCD will reject more non-cluster objects, but at the expense of also rejecting cluster main sequence stars.
The CMDs of objects in the cluster and non-cluster samples are compared in Figures 4 and 5, where the data have been sorted into three radial intervals that sample equal areas on the sky to facilitate an assessment of residual contamination from non-cluster objects. While there is residual non-cluster contamination in the cluster sample, the contamination in the upper rows of Figures 4 and 5 is substantially smaller than in Figures 1 and 2. There is no obvious binary sequence above the cluster main sequence, suggesting that the fraction of binaries with mass ratio near unity is modest in NGC 2437.
It is evident from Figures 4 and 5 that all but the bluest field plume stars have been identified as non-cluster objects. The majority of stars that occupy the plume with and in the CMD are also identified as being non-cluster in origin. The number of non-cluster objects in each radial interval is more-or-less constant, as expected if these objects are uniformly distributed on the sky.
Isochrones with from Marigo et al. (2008) are compared with the cleaned inner annulus CMDs in Figure 6. The distance modulus and reddening listed in the WEDBA database as of mid-2012 have been assumed for this initial comparison. As discussed in §3, the MegaCam data are not in the SDSS system. Therefore, the isochrones were transformed into the system by finding the offset in between the observed and model main sequences at a given color on the TCD. This offset was then applied to the model magnitudes.
The isochrones in Figure 6 fall above the cluster main sequence, indicating that the adopted distance modulus is too small. The distance modulus and reddening were adjusted to obtain better agreement with the observations, and the results for and , which are adopted for the remainder of the paper, are shown in Figure 7. Comparisons with a grid of and values indicated that variations in these quantities that exceed magnitude () and magnitude () could be identified, and so these are adopted as the estimated uncertainties. The reader should keep in mind that these uncertainties assume that the stars in NGC 2437 have a known metallicity (Z = 0.019).
The models shown in Figure 7 suggest an age log(t based on the CMD, and log(t based on the CMD. Therefore, log(t is adopted for NGC 2437, and additional support for this comes from the bright end of the cluster LF (§5). Isochrones with this age do not pass through the two bright blue objects observed by Lynga (1960). To the extent that the models are correct, then this suggests that these stars (1) are not cluster members, (2) are variable stars, (3) are binaries, and/or (4) are not experiencing ‘normal’ evolution of the type assumed by the models.
5 RESULTS: LFs
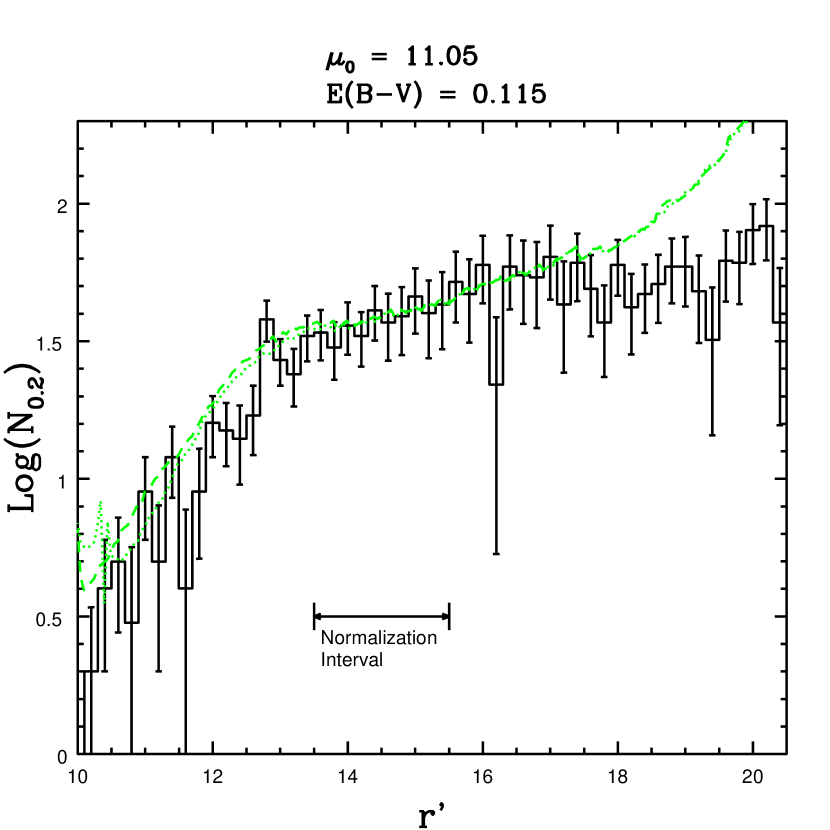
The LF of objects that (1) have within magnitudes of the NGC 2437 main sequence on the CMD, and (2) are within 19.3 arcmin of the center of NGC 2437 – where the density of cluster stars is highest (Figures 4 and 5) – is shown in Figure 8. The faint limit of the LF is defined by the measurements, and the artificial star experiments indicate that the data are 100% complete for , which corresponds to M⊙. The LF in Figure 8 has been corrected for non-cluster objects using source counts in the outer annulus.
The LF can be divided into three magnitude regimes. At the bright end (), the LF climbs steadily towards fainter magnitudes. There is then a break in the LF at , which is due to an inflexion in the mass–magnitude relation near M⊙. Finally, the LF is more-or-less flat when (i.e. for masses M⊙). It is demonstrated in the Appendix that the flat nature of the LF at these magnitudes is a robust result that is reproduced using different criteria to cull sources with poor photometric measurements.
Model LFs, generated from the Marigo et al. (2008) isochrones and downloaded from the Padova database of evolutionary tracks and isochrones web site, 222http://stev.oapd.inaf.it/cgi-bin/cmd are also shown in Figure 8. The models assume Z = 0.019, and have ages Myr (dashed line) and 300 Myr (dotted line). A Kroupa (1998) Initial Mass Function (IMF), which is based on solar neighborhood star counts, was adopted. The models have been scaled to match the LF between and 15.5.
The change in the character of the LF near provides a loose check on the distance modulus, and the agreement with the models at this magnitude suggests that the adopted distance modulus is correct to within magnitude. While the 300 Myr model provides a better match to the observations at the bright end than the 200 Myr model, there is a tendency for both models to fall above the NGC 2437 LF at the bright end. Near the oberved number counts differ from the 300 Myr models at more than the level. Better agreement with the model LFs would result with an apparent distance modulus that is dex greater than deduced from the CMDs, although this would come at the expense of degrading the agreement between the isochrones and the cluster main sequence on the CMDs at intermediate brightnesses.
The models depart significantly from the observed LF when , with the size of the disagreement increasing steadily towards fainter . At (main sequence mass M⊙), the number of stars predicted by the model is roughly an order of magnitude greater than observed. The LF of the inner regions of NGC 2437 thus differs significantly from that of the solar neighborhood when (i.e. M⊙). Possible causes of this difference are examined in §7.
6 CLUSTER STRUCTURE
The spatial distribution of stars in a cluster contains clues about its past history. The spatial distribution and clustering properties of stars in and around NGC 2437 are examined in this section using two approaches. The two-point angular correlation function (TPCF) of cluster stars is examined in §6.1, while the physical distribution of cluster stars on the sky is considered in §6.2.
As with the analysis of the LF in §5, objects within magnitude in about the main sequence ridgeline are adopted as cluster members, although the result of applying a narrower extraction window is also investigated. Cluster stars are divided into various brightness regimes using the comparison between the observed LF and models in Figure 8 as a guide. The BMS (bright main sequence) sample includes the most massive main sequence stars in the cluster, which have . The IMS (intermediate main sequence) sample includes objects from to . The LF increases slowly towards fainter magnitudes in this magnitude interval, at a rate that is more-or-less consistent with that expected from the models shown in Figure 8. The LMS (lower main sequence) sample runs from to . This is the magnitude interval where significant departures from the model LFs occur. Finally, a field star (FS) sample is defined that consists of all objects that are outside of the magnitude main sequence extraction region. The objects in the FS sample are uniformly distributed across the field, and are used to remove signatures in the TPCF that arise from detector geometry – such as gaps between detectors and the finite size of the MegaCam science field.
6.1 The TPCF
The TPCF multiplexes information by considering all possible object-object pairings in a sample, and so makes efficient use of the available information. However, as the correlation properties of all objects are considered in concert then there is not a direct relation between features in the TPCF and location within the area examined. Still, some generalizations can be drawn about the locations of groups that contribute signal to the TPCF. Basic geometric arguments imply that signal at the largest possible separations must originate near the edges of the sampled area. The potential for ambiguity grows as progressively smaller separations are considered, as these separations can be measured over a larger fraction of the field. Another mitigating factor is the density distribution of stars in a cluster.
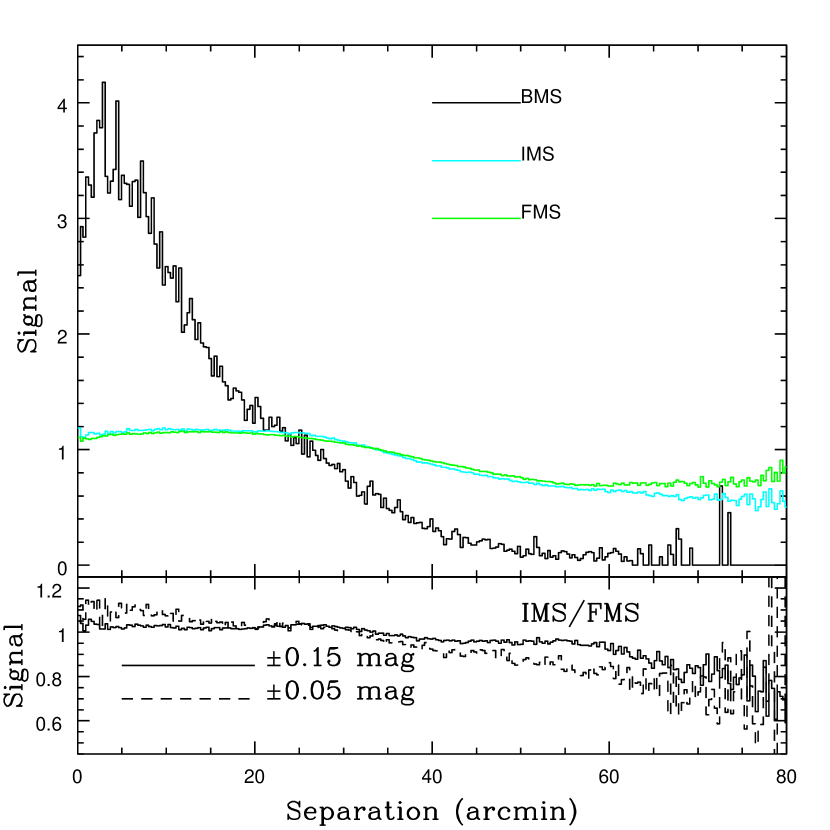
The distributions of separations obtained for all possible object pairings (hereafter ‘separation functions’ – SFs) were calculated for sources in each of the samples. TPCFs were then constructed by dividing the SFs of the BMS, IMS, and FMS samples by the SF of the FS sample, and scaling the results according to the number of pairings. The resulting TPCFs are compared in the top panel of Figure 9.
The objects in the three samples have different clustering properties. The TPCF of the BMS sample has by far the largest amplitude, with power exceeding zero detected out to separations of arcmin. An inflexion point in the TPCF of the BMS sample occurs near separations of 20 – 25 arcmin ( parcsecs), hinting at a possible change in the structural characteristics of the cluster 10 – 12.5 arcmin from its center. A discontinuity is also seen in the TPCFs of IMS and FMS stars at this separation.
A complication in interpreting the TPCFs is that field stars are located over a wide range of distances along the line of sight, and so binaries with a range of different physical separations are included in each angular interval. Consider very wide stellar binaries, which have spatial separations parcsecs (e.g. Larson 1995; Simon 1997). Binaries in the field with separations of 0.04 parsecs would be separated by a few arcmin if viewed at a distance of 100 – 200 parcsecs, but similar binaries at the distance of NGC 2437 will have separations arcsec. It is thus of interest to consider the ratios of SFs of objects that are in the cluster.
The ratio of the IMS and FMS SFs is shown in the lower panel of Figure 9. The IMS and FMS samples have similar clustering properties at separations arcmin. However, at larger separations IMS stars are less clustered. This is consistent with objects in the FMS sample contributing a larger fraction of the objects in the outermost regions of NGC 2437 than stars in the IMS sample.
The TPCFs of the IMS and FMS samples have substantially smaller amplitudes than the BMS TPCF. This reduction in amplitude is due – at least in part – to differences in contamination from field stars, which are uniformly distributed across the field and cause the TPCFs of field star-contaminated samples to be flatter than those of samples that are free of such contamination. Star counts in the inner and outer annuli (§5) suggest that as many as of the stars in the IMS and FMS samples may be field objects, while only of the BMS sample may be field stars.
The extent to which non-cluster objects affect the TPCFs can be assessed by comparing the TPCFs of samples constructed using different extraction widths along the color axis on the CMD. The fractional contamination from field stars is reduced as progressively narrower extraction windows are applied, although this reduction is obtained at the expense of also culling cluster stars that scatter about the main sequence on the CMD. To investigate the impact of non-cluster contamination on these data, a second set of TPCFs were computed for the IMS and FMS samples using a magnitude wide band in . While not shown in Figure 9, the TPCFs of the IMS and FMS samples constructed with this narrower window have amplitudes that are larger than those obtained with a magnitude cut. This is consistent with reduced levels of non-cluster contamination.
The ratio of the SFs constructed with the mag extraction window is shown as a dashed line in the lower panel of Figure 9. The ratio of the IMS and FMS SFs obtained with the mag window differs from that obtained with the mag window, in the sense that the IMS sample is more centrally concentrated than the FMS sample when the narrower extraction window is used. This comparison reinforces the result discussed above that the cluster stars in the FMS sample are more diffusely distributed than those in the IMS sample.
6.2 The Projected Distribution of Stars
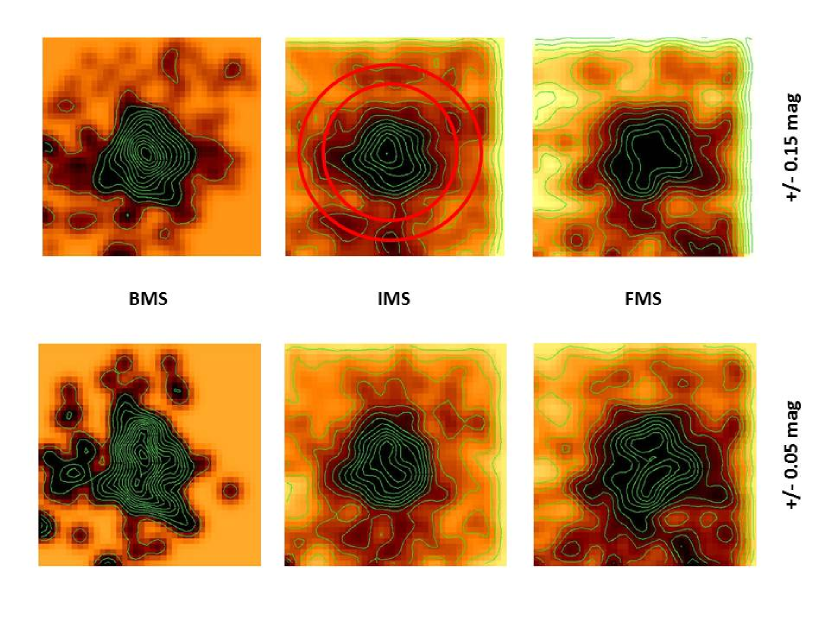
Additional insights into the structure of NGC 2437 can be obtained by visually examining the spatial distribution of objects. The distributions of sources in the BMS, IMS, and FMS samples are shown in Figure 10. The top row shows the source distributions of objects that fall within a mag extraction window about the main sequence locus on the CMD, while the bottom rows shows the distribution of sources within a mag extraction window. The pixel intensities reflect the number of stars within arcmin gathers. This coarse bin size was adopted to suppress stochastic fluctuations in the star counts. still, the BMS distributions are dominated by single objects outside the main body of the cluster.
Features that are present in the top row of Figure 10 also tend to be present in the bottom row. That the spatial distributions of each sample type are not sensitive to the width of the extraction window on the CMD suggests that prominent structures in Figure 10 are dominated by cluster stars, and not field stars. The objects in the various samples have different spatial distributions, with the BMS and IMS samples being more compactly distributed than the FMS sample. This is consistent with the comparisons between the TPCFs of the samples in the previous section.
The IMS and FMS distributions have irregular morphologies at large radii, and the FMS distributions show a concentration of objects to the south and west of the cluster center. This feature is likely not due to field stars, as it is equally strong in the top and bottom rows of Figure 10, indicating that it is populated by objects with photometric properties that tightly follow the cluster main sequence. The nature of this feature is discussed further in the next Section.
7 SUMMARY AND DISCUSSION
The stellar content of the open cluster NGC 2437 (Messier 46) has been investigated. Despite being a moderately massive nearby intermediate age cluster, NGC 2437 has not yet been extensively surveyed with modern detectors; the one exception is the study by Sharma et al. (2006). The angular size of NGC 2437 is well-suited to the 1 degree2 MegaCam science field, and the data discussed here are the deepest wide-field images of this cluster that have been recorded to date.
The and CMDs of NGC 2437 have been compared with solar metallicity isochrones, and a distance modulus and a color excess were obtained. These comparisons also suggest an age years. Star counts near the bright end of the LF favor values near the upper limit of this age range. The distance modulus, reddening, and age deduced for NGC 2437 from the MegaCam data are not significantly different from those found by Sharma et al. (2006). However, the distance modulus found here is larger than that computed by Stetson (1981) from multicolor photoelectric observations of A stars. Given its age, NGC 2437 likely formed as part of the recent ‘local starburst’ (e.g. Bonatto & Bica 2011).
The main sequence of NGC 2437 can be traced to in these data, allowing the LF of stars with masses M⊙ to be investigated. After correcting for contamination by non-cluster objects, the shape of the LF for stars with ( M⊙) within 19.3 arcmin of the cluster center is consistent with solar neighborhood star counts. However, at fainter magnitudes the central regions of NGC 2437 appear to be deficient in stars.
At first glance, such a deficiency among faint stars seems to contradict the results from Sharma et al. (2008), who find that the mass function of NGC 2437 has an exponent that (1) is comparable to the Salpeter (1955) value, and (2) is consistent with that of other clusters in their sample. However, the faint limit of the Sharma et al. (2008) data is , which corresponds to . Their data is thus limited to the magnitude range that the MegaCam data finds is in agreement with the models.
Velocity dispersion measurements suggest that there is a high binary fraction in NGC 2437 (Kiss et al. 2008), while modelling of the cluster CMD suggests that the binary fraction may be 30 – 40% (Sharma et al. 2008). If stars in binary systems form in numbers that follow the IMF, then binarity will have the greatest impact near the faint end of the LF, where the incidence of binaries with mass ratios approaching unity will be highest. While the model LFs considered here do not include binaries, a deficiency of stars with sub-solar masses would still remain in NGC 2437 if models that include binaries had been used. Indeed, when compared with models that do not include binaries the addition of binaries typically changes the mass function exponent inferred from LFs by only a few tenths (e.g. Sagar & Richtler 1991; Sharma et al. 2008). This is roughly an order of magnitude smaller than what is needed to explain the differences between the models and observations at faint magnitudes in Figure 8.
A deficiency in stars at the faint end of the NGC 2437 LF could occur if stars with masses M⊙ have been dispersed from the central regions of the cluster. This could result from mass segregation, the structural signatures of which may be detectable after only a few cluster crossing times. Prisinzano et al. (2003) find evidence for mass segregation in the Myr cluster NGC 2422, while Delgado et al. (2011) find evidence of mass segregation in even younger clusters. Sharma et al (2006) find differences in open cluster radii measured from optical and 2MASS data, in the sense that some clusters – including NGC 2437 – are more extended spatially in the near-infrared than at shorter wavelengths. Given that the optical and near-infrared wavelength regimes are sensitive to different stellar mass ranges, then this suggests that the structural properties of some clusters in their sample, including NGC 2437, depend on stellar mass in a way that is consistent with mass segregation. The investigation of the TPCF in §6 provides further evidence to support the presence of mass segregation, as it indicates that the clustering properties of stars in NGC 2437 depend on magnitude, in the sense that bright main sequence stars have a more compact spatial distribution than faint main sequence stars.
A picture is thus emerging in which NGC 2437 has a diffuse corona that contains a larger fraction of stars with sub-solar masses than near the cluster center. Such a diffuse circumcluster structure will be more susceptible to tidal stripping than the dense inner cluster environment, and so will likely be the source of stars that are shed from the cluster. Given that stars are fed into the peripheral regions of the cluster as mass segregation proceeds, then the corona will be replenished as stars are stripped away. In fact, the prognosis for the long-term survival of NGC 2437 is not good, and NGC 2437 may actively be shedding stars. Lamers et al. (2005) find that a cluster in the Galactic disk with a mass 104 M⊙ – which is substantially larger than NGC 2437 – may survive for only 1.3 Gyr. With a mass of M⊙ (Sharma et al. 2008), then NGC 2437 will probably evaporate on the timescale of only a few disk crossing times.
Is there evidence of mass loss from NGC 2437? The spatial distribution of main sequence stars in Figure 10 indicates that low mass stars at large radii in NGC 2437 may extend to the south and west of the cluster, and we suggest that this may be the roots of a tidal debris trail. Such trails may not be rare in the Galactic disk, and simulations suggest that clusters that are a few 100 Myr older than NGC 2437 may leave debris trails that extent over many hundreds of parsecs (Chumak & Rastorguev 2006). If the stars to the south and west of NGC 2437 are part of such a debris trail then they may belong to a much larger coherent structure, only a modest fraction of which can be captured with a single MegaCam pointing.
Appendix A AN INVESTIGATION OF DIFFERENT CULLING CRITERIA ON THE CLUSTER LF
A procedure for identifying and deleting objects with suspect photometry using is described in §3, and the dataset that was culled in this manner has been adopted as the baseline for this study. has the merit of being easily related to stellar magnitudes, and so provides – at least in principle – an intuitive basis for understanding biases that may be introduced by source culling. Still, is not the only parameter that can be used to identify objects with suspect photometric measurements. Here, the use of two other parameters that are computed by ALLSTAR – sharp and – to identify objects with suspect photometry are also explored. These parameters are described in detail by Stetson et al. (2003). They measure source characteristics that differ from those used to compute , and so provide a means of identifying biases that may be introduced in the culling process.
As is the case with , sources with sharp and that depart significantly from the mean value at a given magnitude may be galaxies, stellar blends, or cosmetic artifacts. Following the procedure employed to filter the photometric catalogue using , a function was fit to the envelope of the main body of objects on the sharp magnitude and magnitude relations. Objects that fall outside of the fitted relations were then deleted. Near the faint limit of the data sharp and also show markedly greater scatter than at brighter magnitudes, and it was also decided to delete all objects with and .
The background-subtracted LFs that result from cleaning the dataset using each parameter independently are compared in Figure A1. The faint end of the LF is shown in this figure, as this is where the majority of points are removed. Given that , sharp, and characterize different source properties, it is not surprising that there are LF-to-LF differences. However, these differences tend to be modest in size. Indeed, the LF-to-LF dispersion falls within the uncertainties predicted by the number counts for the LF constructed using as the culling parameter. The flat nature of the LF at the faint end is present in all three LFs, indicating that the difference between the model and the NGC 2437 LFs at the faint end that are discussed in §5 is not an artifact of the technique used to excise sources with suspect photometry.
Appendix B THE PLANETARY NEBULA NGC 2438
The PN NGC 2438 is located near the central regions of NGC 2437 on the sky. If NGC 2438 is a member of NGC 2437 then this makes that cluster of considerable importance for studies of the evolution of intermediate mass stars and PN. However, the radial velocity of NGC 2438 differs significantly from that of NGC 2437, suggesting either no physical connection or that the PN progenitor was ejected from the cluster (Kiss et al. 2008).
If NGC 2438 is associated with NGC 2437 then the progenitor likely had a mass that is comparable to those of stars in the BMS sample. When compared with lower mass stars, the BMS stars are tightly clustered on the sky (§6), with a typical separation of arcmin (Figure 9), which corresponds to parsecs at the distance of NGC 2437. Assuming virial eqiuilibrium, then with a total cluster mass of M⊙ the expected velocity dispersion is km sec-1. For comparison, Kiss et al. (2008) find that the difference in velocity between NGC 2438 and the cluster is 30 km sec-1. If the progenitor of NGC 2438 formed as a member of NGC 2437 then its high velocity (and expected large physical displacement from the cluster center) makes it an extremely peculiar object when compared with other cluster members of similar mass.
If NGC 2438 is not associated with NGC 2437 but is part of another – not yet dissolved – cluster that is viewed against/through NGC 2437 then a localized concentration of stars may be present near NGC 2438. There are two peaks in the distribution of FMS stars in the lower panel of Figure 10, and the peak immediately to the north of the MegaCam field center coincides roughly with the location of NGC 2438. In contrast, the BMS and IMS samples are more uniformly distributed near NGC 2438. Radial velocity and proper motion studies of objects within 5 – 10 arcmin of NGC 2438 (the approximate extent of the peak in the FMS sample) should reveal if there is an ensemble of stars that is viewed fortuitously through/against NGC 2437. Of course, if the progenitor of NGC 2438 is older than a few hundred Myr then its host cluster may have long since dissolved, although in that case the PN might be part of an extended debris trail.
| Name | E() | aaDistance modulus | log(tyr) | [M/H] |
|---|---|---|---|---|
| NGC 2437 | 0.154 | 11.17 | 8.4 |
| Cluster | Date Observed | Exposure Times | FWHM |
|---|---|---|---|
| NGC 2437 | October 31, 2010 | 2 sec + 95 sec | 1.0 arcsec |
| 1 sec + 50 sec | 0.9 arcsec | ||
| 1 sec + 60 sec | 0.9 arcsec |
References
- (1)
- (2) Balona, L. A., & Lacey, C. D. 1996, MNRAS, 281, 1341
- (3)
- (4) Bastian, N., & Goodwin, S. P. 2006, MNRAS, 369, L9
- (5)
- (6) Bastian, N., Weisz, D. R., Skillman, E. D., et al. 2011, MNRAS, 412, 1539
- (7)
- (8) Bonatto, C., & Bica, E. 2011, MNRAS, 415, 2827
- (9)
- (10) Boulade, O., et al. 2003, Proc. SPIE, 4841, 72
- (11)
- (12) Chumak, Y. O., & Rastorguev, A. S. 2006, Astron. Lett., 32, 446
- (13)
- (14) Chumak, Y. O., Platais, I., McLaughlin, D. E., Rastorguev, A. S., & Chumak, O. V. 2009, MNRAS, 402, 1841
- (15)
- (16) Clem, J. L., VandenBerg, D. A., & Stetson, P. B. 2008, AJ, 682
- (17)
- (18) Dahm, S. E. 2005, AJ, 130, 611
- (19)
- (20) Davidge, T. J. 2010, ApJ, 725, 1342
- (21)
- (22) Davidge, T. J. 2012, ApJ, 761, 155
- (23)
- (24) Davidge, T. J., & Puzia, T. H. 2011, ApJ, 738, 144
- (25)
- (26) Davidge, T. J., Puzia, T. H., & McConnachie, A. 2011, ApJ, 728, L23
- (27)
- (28) Davidge, T. J., McConnachie, A. W., Fardal, M. A. et al. 2012, ApJ, 751, 74
- (29)
- (30) Delgado, A. J., Gonzalez-Martin, O., Alfaro, E. J., & Yun, J. 2006, ApJ, 646, 269
- (31)
- (32) Delgado, A. J., Alfaro, E. J., & Yun, J. L. 2011, A&A, 531, A141
- (33)
- (34) Dworetsky, M. M. 1975, AJ, 80, 131
- (35)
- (36) Harris, G. L. H., Fitzgerald, M. P. V., Mehta, S., & Reed, B. C. 1993, AJ, 106, 1533
- (37)
- (38) Ianna, P. A., Adler, D. S., Faudree, E. F. 1987, AJ, 92, 347
- (39)
- (40) Johnson, H. L. 1966, ARA&A, 4, 193
- (41)
- (42) Jordi, K., Grebel, E. K., & Ammon, K. 2006, A&A, 460, 339
- (43)
- (44) Kholopov, P. N. 1969, Sov. Astron., 12, 625
- (45)
- (46) Kiss, L. L., Szabo, G. M., Balog, Z., Parker, Q. A., & Frew, D. J. 2008, MNRAS, 391, 399
- (47)
- (48) Kroupa, P. 1998, in Brown Dwarfs and Extrasolar Planets, ASP Conf. 134. 483
- (49)
- (50) Lada, C. J., & Lada, E. A. 2003, ARAA, 41, 57
- (51)
- (52) Lamers, H. J. G. L. M., Gieles, M., Bastian, N., Baumgardt, H., Kharchenko, N. V., & Portegies Zwart, S. 2005, A&A, 441, 117
- (53)
- (54) Larson, R. B. 1995, MNRAS, 272, 213
- (55)
- (56) Lynga, G. 1960, ArA, 2, 379
- (57)
- (58) Marigo, P., Girardi, L., Bressan, A. et al. 2008, A&A, 482, 883
- (59)
- (60) Mermilliod, J.-C. 1995, ASSL, 203, 127
- (61)
- (62) Moitinho, A., Alves, J., Huelamo, N., & Lada, C. J. 2001, ApJ, 563, L73
- (63)
- (64) Perry, C. L. 1973, in Spectral Classification and Multicolor Photometry, IAUS, 50, 192
- (65)
- (66) Prisinzano, L., Mirela, G., Sciortino, S., & Favata, F. 2003, A&A, 404, 927
- (67)
- (68) Rojo Arellano, E., Pena, J. H., Gonzalez, D. 1997, A&AS, 123, 25
- (69)
- (70) Sagar, R., & Richtler, T. 1991, A&A, 250, 324
- (71)
- (72) Salpeter, E. E. 1955, ApJ, 121, 161
- (73)
- (74) Schlegel, D. J., Finkbeiner, D. P., & Davis, M. 1998, ApJ, 500, 525
- (75)
- (76) Sharma, S., Pandey, A. K., Ogura, K., Mito, H., Tarusawa, K., & Sasov, R. 2006, AJ, 132, 1669
- (77)
- (78) Sharma, S., Pandey, A. K., Ogura, K., Aoki, T., Pandey, K., Sandhu, T. S., & Sagar, R. 2008, AJ, 135, 1934
- (79)
- (80) Shobbrook, R. R. 1984, MNRAS, 211, 659
- (81)
- (82) Simon, M. 1997, ApJ, 482, L81
- (83)
- (84) Smith, J. A., Tucker, D. L., Kent, S., et al. 2002, AJ, 123, 2121
- (85)
- (86) Smith, J., Fellhauer, M., Goodwin, S., & Assmann, P. 2011, MNRAS, 414, 3036
- (87)
- (88) Stetson, P. B. 1981, AJ, 86, 1500
- (89)
- (90) Stetson, P. B. 1987, PASP, 99, 191
- (91)
- (92) Stetson, P. B., & Harris, W. E. 1988, AJ, 96, 909
- (93)
- (94) Stetson, P. B., Bruntt, H., & Grundahl, F. 2003, PASP, 115, 413
- (95)
- (96) Tognelli, E., Prada Moroni, P. G., & degl’Innocenti, S. 2011, A&A, 533, A109
- (97)