The Effect of Many Minor Mergers on the Size Growth of Compact Quiescent Galaxies
Abstract
Massive galaxies with a half-mass radius kpc are observed in the early universe (), but not in the local universe. In the local universe similar-mass (within a factor of two) galaxies tend to be a factor of 4 to 5 larger. Dry minor mergers are known to drive the evolution of the size of a galaxy without much increasing the mass, but it is unclear if the growth in size is sufficient to explain the observations. We test the hypothesis that galaxies grow through dry minor mergers by simulating merging galaxies with mass ratios of 1:1 (equal mass) to 1:160. In our -body simulations the total mass of the parent galaxy doubles. We confirm that major mergers do not cause a sufficient growth in size. The observation can be explained with mergers with a mass ratio of 1:5–1:10. Smaller mass ratios cause a more dramatic growth in size, up to a factor of for mergers with a mass ratio of 1:80. For relatively massive minor mergers 1:20 the mass of the incoming child galaxies tend to settle in the halo of the parent galaxy. This is caused by the tidal stripping of the child galaxies by the time they enter the central portion of the parent. When the accretion of minor galaxies becomes more continuous, when 1:40, the foreign mass tends to concentrate more in the central region of the parent galaxy. We speculate that this is caused by dynamic interactions between the child galaxies inside the merger remnant and the longer merging times when the difference in mass is larger. These interactions cause dynamical heating which results in accretion of mass inside the galaxy core and a reduction of the parent’s circular velocity and density.
keywords:
galaxies: evolution – galaxies: interactions – galaxies: kinematics and dynamics – methods: numerical1 Introduction
Hierarchical structure formation drives the growth of mass and size of galaxies with redshift (Peebles, 1980; Lacey & Cole, 1993). In this picture the mass and size of galaxies grow at a similar rate. Recently a population of small but relatively massive elliptical galaxies has been observed at (Daddi et al., 2005; Trujillo et al., 2006; Toft et al., 2007; van Dokkum et al., 2008; Franx et al., 2008; van de Sande et al., 2011; Szomoru et al., 2012). However at low redshift these galaxies are much more rare (Trujillo et al., 2009; van Dokkum et al., 2009; van der Wel et al., 2008; Taylor et al., 2010; Valentinuzzi et al., 2010; Trujillo et al., 2012), whereas there is a rich population of elliptical galaxies with similar mass but which are considerably larger in size (Martinez-Manso et al., 2011). This suggests that small and massive galaxies grow in size without acquiring much mass, which cannot be explained from major mergers as observed in hierarchical structure formation simulations (e.g. Naab et al. (2006); Oser et al. (2012) and references therein).
It has been suggested that dry minor mergers can cause a considerable growth in size without much increasing the mass of the galaxy, whereas major mergers tend to increase the mass without much increasing the size (Miller & Smith, 1980; Naab et al., 2006; Oser et al., 2010, 2012; Trujillo et al., 2011).
Several studies on the topic seem to contradict each other, some argue that minor mergers can drive the observed growth e.g. (Bezanson et al., 2009; Naab et al., 2009; Hopkins et al., 2009, 2010). Others claim that the observed size growth in simulations is not sufficient if one takes into account cosmological scaling relations (Nipoti et al., 2009a, 2012; Cimatti et al., 2012). Encouraged by this discrepancy in the literature we decided to perform a series of simulations in which we model the encounters between compact massive galaxies and smaller, lower-mass counterparts. In our parameter search we included mass ratios from 1:1 all the way to 1:160. Even though such low-mass encounters are unlikely to be common (Oser et al., 2012), they approach a continuous in-fall of material on the parent galaxy.
With the merger simulations we study the growth in mass, size and the effect on the shape of the merger product. Our simulations are performed using the Bonsai tree code (Bédorf et al., 2012) with up to 17.2 million equal-mass particles. This includes the dark-matter as well as the baryonic matter. In our simulations we recognize two regimes of galaxy growth. For 1:20 we confirm the inside-out growth, as discussed by (Hilz et al., 2012b), whereas for 1:40 galaxies tend to form outside-in, meaning that the mass is accreted in the core of the primary galaxy rather than accreted on the outside. This change in behavior is caused by the self-interactions of minor galaxies for mass ratios .
Recently (Hilz et al., 2012a) studied the size increase from major mergers down to 1:10 minor mergers. Their results are consistent with our findings for comparable simulation parameters. The major difference between (Hilz et al., 2012a) and the results presented here are the details regarding the orbital parameters of the merging galaxies; they drop their minor galaxies in one-by-one, whereas we initialize all galaxies in a spherical distribution at the start of the simulation. As a consequence in some of our simulations the merging process with many minor mergers is not completed by Gyr. While the results of our 1:1 to 1:10 mergers are consistent with the growth observed in the simulations of Hilz et al. (2012a); Hilz et al. (2012b) and Oogi & Habe (2012), they are inconsistent with Nipoti et al. (2009b). The reason for this discrepancy cannot be the steeper density slope of the stellar bulge, as was suggested by Hilz et al. (2012a), because we tried even higher density slopes for the minor child galaxies and found that this does not affect the growth of the merger product (see Appendix B). The discrepancy between our results and those of Nipoti et al. (2009b); Nipoti et al. (2009a) could be explained by the averaging of the simulation results, as was also suggested by Hilz et al. (2012a).
2 Constraining the model parameters
To perform the simulations we use an updated version of the gravitational -body tree-code Bonsai (Bédorf et al., 2012). All simulations are performed on workstations with NVIDIA GTX480 graphical processing units. Simulations are run with 1 to 18 GPUs, depending on .
The code has three important parameters; the choice of the time step , the softening length and the tree-code opening angle . The opening angle is set to whereby we use the minimum distance opening criterion (Salmon & Warren, 1994), which is computationally more expensive than the improved Barnes-Hut method (Dubinski, 1996) by about a factor of two, but offers better accuracy (Bédorf et al., 2012).
After having fixed , the choice of and are quite critical for the quality of our results. We measure the quality of the simulation based on the error in the energy and the change in size of a galaxy model in isolation. We determine the optimal values for and by performing an analysis in which we run a series of models using a range of values for and . Although the time step and softening are discussed extensively in previous literature (e.g. (Merritt, 1996; Athanassoula et al., 2000; Dehnen, 2001)) we chose to do extra tests our-self. This for a couple of reasons, first most of the previous discussed methods propose a softening that scales with the number of particles. However, we use different number of particles for the primary galaxy and child galaxies so we had to find a configuration that works for both. Second, our tree-code uses an accurate multipole expansion, in combination with a opening angle criteria that is different from used in the previously mentioned papers. And finally we use two component models with power law density distributions while most examples in the previous mentioned papers are based on one component spherical Plummer models. Therefore we decided to rather empirically test how the softening and time-step affected the properties of our initial conditions instead of taking over a previously result obtained in a different setting. The initial conditions for these isolated galaxies are generated using GalactICS (Kuijken & Dubinski, 1995; Widrow & Dubinski, 2005; Widrow et al., 2008) and consist of a dark matter halo and a baryonic bulge. All models represent elliptical E0 galaxies. The bulges are modeled with a Sersic index of 3 and the dark-matter halo is represented by an NFW profile (Navarro et al., 1996).
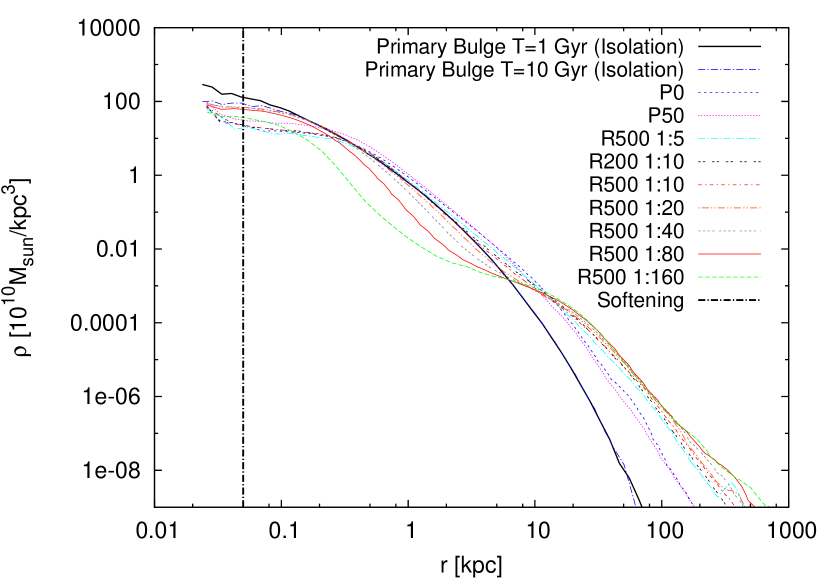
In our simulations we collide the primary galaxy with a number of child galaxies, which are smaller and less massive. The mass ratio and the number of child galaxies which interact with the primary is one of the free parameters in our simulations. We generate the child galaxies using GalactICS by adopting the appropriate mass and size of the dark-matter halo both of which we assume to be a constant factor smaller than in the primary galaxy. This factor is equal to the mass ratio of the child, e.g. for a 1:10 child the mass and cut-off radius is 10 times lower than that of the primary galaxy. As a consequence the density of the child galaxy is smaller by a factor 10 than that of the primary. In Appendix B we demonstrate that the effect of our selected size and mass (and consequently density) of the child galaxy is not critical for our conclusions. In Fig. 1 we present the density profiles of the baryonic bulge and dark matter halo of our selected initial conditions at zero-age, at Gyr which is the moment we intend to use them for the merger simulations in § 3, and at Gyr. It takes a few crossing times for the galaxies to relax after generation, therefore we first let them evolve for Gyr before we use them in a merger configuration. The differences in the density profile for the same component are hardly noticeable as a function of time. To prevent spurious mass segregation all particles in one simulation have the same mass. Mass differences between galaxies and baryonic and dark matter particle distributions are created by using different amounts of particles for each galaxy and galaxy components (see Tab. 1 for details).
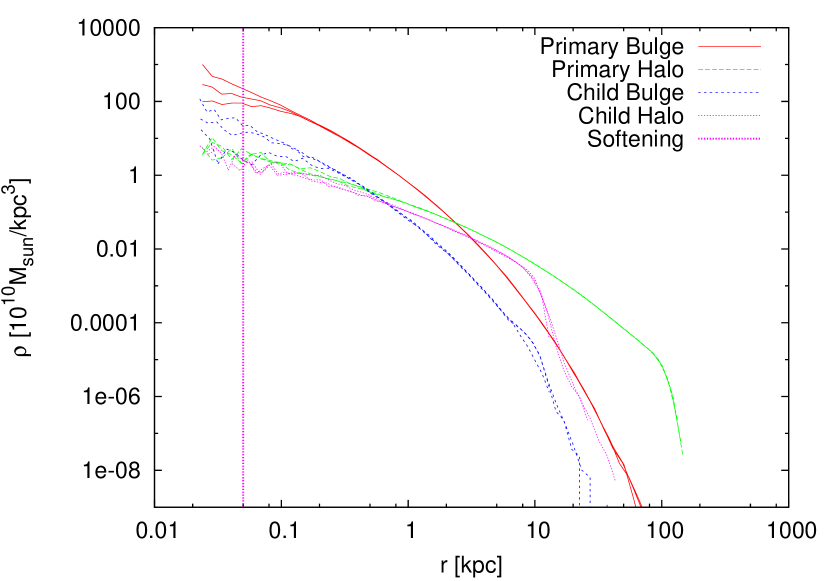
The isolated galaxy simulations were performed for a galaxy with a total mass , and a half-mass radius of 1.36 kpc. which we call the parent or primary galaxy and for each of the child galaxies. The child galaxies have a mass that is times lower than that of the primary. For example the 1:10 child has a mass of . To make sure that the child galaxies consist of enough particles to be accurately resolved and stay stable in isolation we use different resolution models for the initial conditions. Depending on the number of child galaxies (mass ratio) used. We found that using a minimum number of ( particles for the bulge (dark matter) component proofed to be enough to keep the galaxies stable (Tab. 1).
We refer to low-resolution simulations (LR) for those in which the primary galaxy was modeled with and the 1:10 child with . For the high-resolution (HR) simulations we adopted and for the primary and 1:10 child galaxies, respectively. The child galaxies with a different mass ratio are scaled in a similar way as the 1:10 child, namely the number of particles of the primary divided by the mass ratio. Each model was run for 10 Gyr. In Figs. 2 and 3 we present the results of the HR simulations; the error in the energy for the left-hand panels and the expansion factor of the bulge, (t), in isolation in the right-hand panels.
| (1) |
Here is the half-mass radius of the baryonic component of the galaxy at time . In Fig. 2 we present the result for the primaries, and Fig. 3 for the 1:10 children.
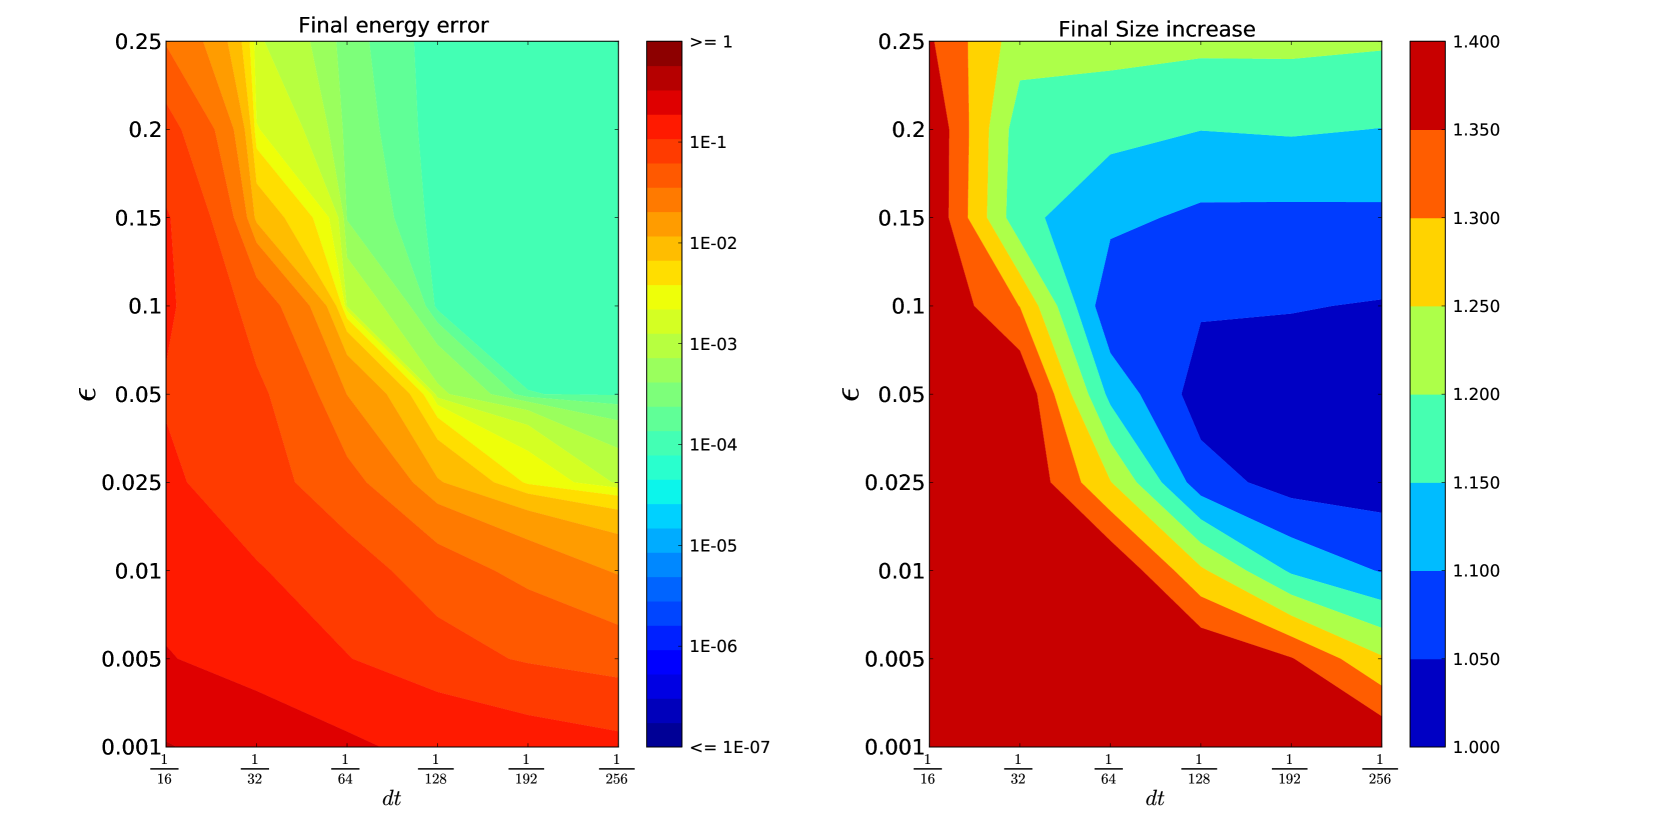
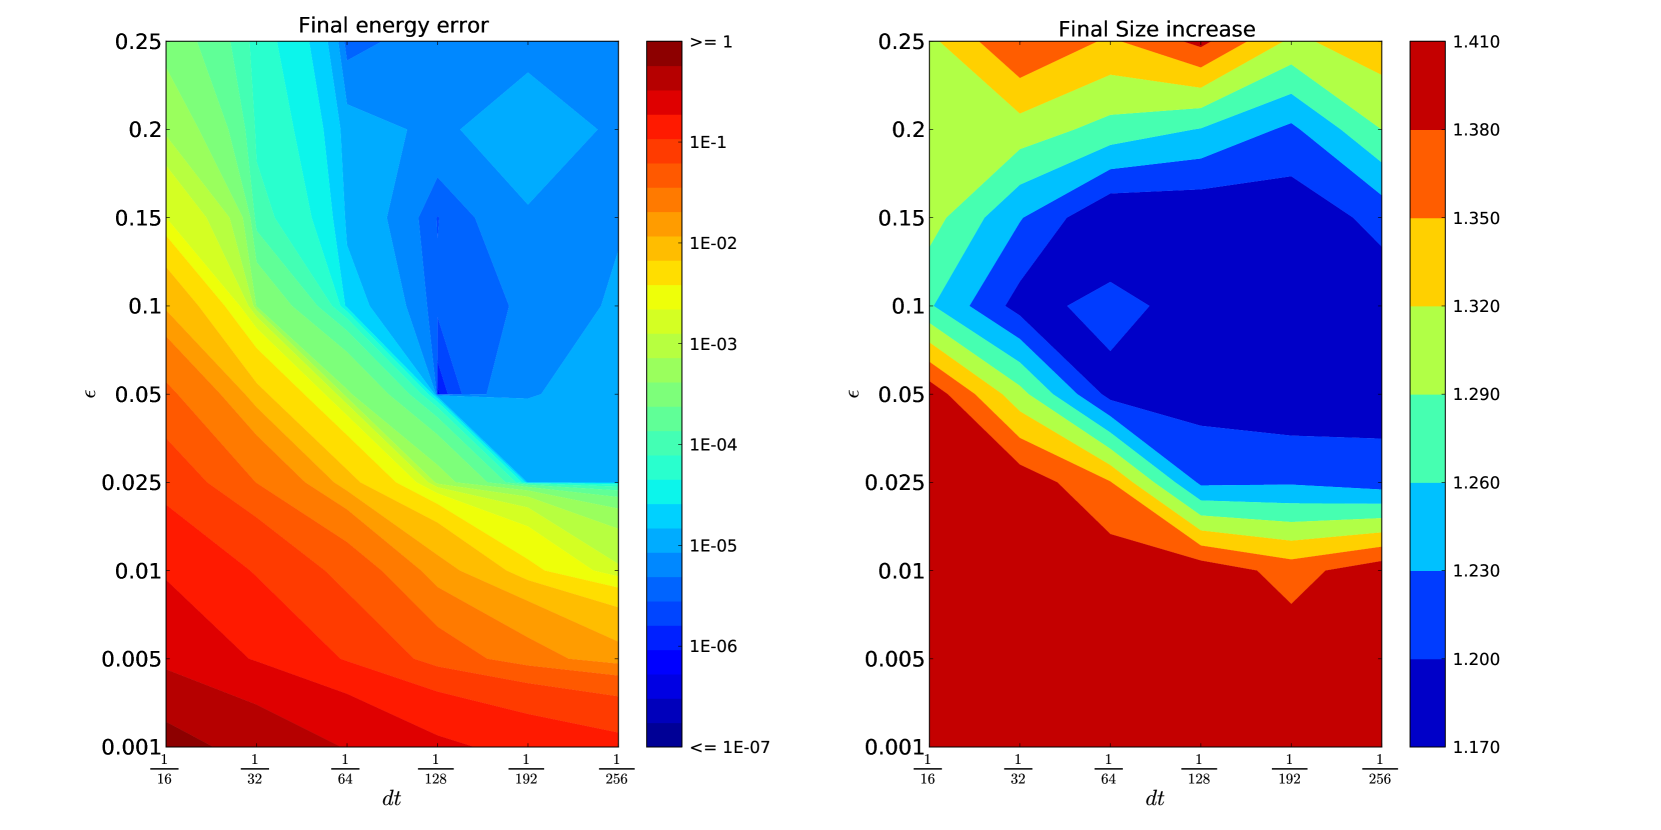
As expected, decreases for decreasing and increasing , for the primary as well as for the child galaxy. The growth in size of the galaxies becomes smaller with decreasing . However, for this is not a trivial matter. For too large a softening the galaxy tends to expand substantially, but the effect is not as dramatic as for a too small value of . The growth for large is caused by spurious suppression of relaxation in the large runs. The growth for small is numerical, caused by strong encounters which are not resolved accurately in our simulation. This limitation in our numerical solver is also noticeable in the energy error for small (see Figs. 2 and Fig. 3).
Because we intend to study the expansion of the primary galaxies caused by mergers they should not expand in isolation. For our production simulations (see § 3) we select the which show the least expansion when the galaxy is run in isolation. The time step is chosen as large as possible (for performance) but giving the smallest possible energy error. We make the choice of and based on the simulations for the primary galaxy, which for the child also turns out to be the bests choice. For the HR simulations and , and for the LR simulations and . Using these settings the energy error of all the merger simulations stays below . These parameters are presented in dimension-less -body units (Heggie & Mathieu, 1986), but in physical units they translate to a time step of Myr for the LR and Myr for the HR simulations, and a softening length of pc, and pc for the LR and HR runs, respectively.
Comparing the most optimal settings with the results of previous work on softening values (Merritt, 1996; Athanassoula et al., 2000; Dehnen, 2001). The chosen softening values are comparable to the values advised in (Athanassoula et al., 2000) and (Dehnen, 2001) with our chosen values being slightly larger to keep the energy error less than while the size growth stays smaller than 10%. The difference between our results and Merritt (1996) is somewhat larger, but still within a factor of three. The difference can be attributed to the fact that we use more particles and use a tree-code instead of direct summation (see also Table 1. of Athanassoula et al. (1998)).
Most of the expansion of our galaxies occurs in the first few 100 Myr of the simulation, and therefore all galaxies are evolved to an age of 1 Gyr in isolation before they are used as initial galaxies in the merger simulations.
As as extra test we ran several of the isolated galaxies using the direct -body code phiGRAPE (Harfst et al., 2007) to confirm that the observed and expansion are not the result of using an approximation based simulation code. The results of these simulations are consistent with the results of Bonsai, but show a of , because of the higher accuracy of phiGRAPE .
With this choice of initial conditions, the child galaxies in the low resolution simulations still expand by at most a factor of 2 before the merger starts. To check how this affects our results we redo the simulation but at the start the child galaxies are represented as point masses. The point mass is replaced by a child galaxy as soon as it enters the dark matter halo of the primary galaxy. This simulation gives a nearly identical expansion of the primary galaxy to that in which the child was resolved from the start of the simulation.
| LR | HR | |||||||
| Model | Type | Total mass | P mass | P mass | ||||
| [] | - | [] | [pc] | - | [] | [pc] | ||
| Primary | Halo | 100 | 50 | |||||
| Bulge | 100 | 50 | ||||||
| Child | Halo | 100 | 50 | |||||
| Bulge | 100 | 50 | ||||||
| Child | Halo | 100 | 50 | |||||
| Bulge | 100 | 50 | ||||||
| Child | Halo | - | - | - | 50 | |||
| Bulge | - | - | - | 50 | ||||
| Child | Halo | - | - | - | 50 | |||
| Bulge | - | - | - | 50 | ||||
| Child | Halo | - | - | - | 50 | |||
| Bulge | - | - | - | 50 | ||||
3 Initializing the galaxy mergers
We use the isolated galaxies discussed in the previous § to study the effect of mergers. For this purpose we adopt the primary galaxy and have it interact with an identical copy or with a number of child galaxies. We refer to minor mergers when the primary:child mass 1:5. Major mergers in our study have equal mass.
3.1 Configuring the major mergers
In the major merger simulations two identical copies of the primary galaxy are placed on an elliptical orbit. The initial distance between the two galaxies is 400 kpc, which exceeds the size of the dark-matter halos, which is about 200 kpc. The relative velocity is chosen such that the minimal distance of approach during the first perigalactic passage varies. We vary from head-on (0 kpc) to 10, 50, 75 and 100 kpc for the widest encounters. All our merger simulations are run until 10 Gyr, after which both galaxies have merged to a single galaxy, except for the kpc configurations (see § 4).
Because we use two identical copies of the primary galaxy the galaxies will be co-rotating during the collision. To study the influence of the rotation angle on the size of the merger product we run the simulations for and kpc with co-rotating and counter-rotating galaxies. This is done by changing the inclination and of one of the two galaxies between 0 ∘ and 270 ∘ in steps of 90 ∘ using a rotation matrix. After the rotation the galaxies are put on their elliptical orbit as described in the previous §. The stability of the isolated galaxies is not affected, because the positions and velocities are rotated in a consistent way. We did not perform this study on the other major mergers, because the effect of the inclination and on the expansion factor turns out to be negligible (variation of the final size between the 16 configurations is kpc).
3.2 Configuring the minor mergers
The easiest way to generate an initial configuration with 1 primary galaxy and child galaxies is by randomly positioning them in a spherical distribution. For each simulation we generate a Plummer distribution (Plummer, 1915) of particles. We then select a random particle and reposition it in the center of mass. We assign the mass of the parent galaxy to this central particle. The other particles are assigned the mass of the child galaxies. The total mass of all child galaxies in each simulation is the same as that of the primary galaxy. The model is then rescaled to a virial radius, , and virial ratio (temperature), . We run 10 sets of initial conditions for each selected mass ratio. In the next section we discuss the results of a number of simulations with varying mass-ratio, and . Using this procedure we created a range of minor merger models with varying , and , see Tab. 2. In Section 3.2.1 we relax this assumption and allow to study the effect of the temperature on the size of the merger product.
| mass ratio | R | Q | resolution | name |
|---|---|---|---|---|
| 1:5 | 500 | 0 | LR | 1:5 |
| 1:10 | 200 | 0 | LR | 1:10, R200 |
| 1:10111based on same Plummer distribution as the models. | 500 | 0 | LR | 1:10, R500 |
| 1:20 | 500 | 0 | HR | 1:20 |
| 1:40 | 500 | 0 | HR | 1:40 |
| 1:80 | 500 | 0 | HR | 1:80 |
| 1:10 | 200 | 0.0 | LR | |
| 1:10 | 200 | 0.05 | LR | |
| 1:10 | 200 | 0.1 | LR | |
| 1:10 | 200 | 0.3 | LR | |
| 1:10 | 200 | 0.5 | LR | |
| 1:10 | 200 | 1.0 | LR | |
| 1:10 | 500 | 0.0 | LR | |
| 1:10 | 500 | 0.05 | LR | |
| 1:10 | 500 | 0.1 | LR | |
| 1:10 | 500 | 0.3 | LR | |
| 1:10 | 500 | 0.5 | LR | |
| 1:10 | 500 | 1.0 | LR |
For the 1:10 minor mergers we adopted kpc as well as kpc. In the configurations the child galaxies have a 50% probability of being placed initially within the dark matter halo of the primary. For the configurations, which are based on the same random Plummer realization but scaled to a larger virial radius, this is only 15%.
3.2.1 Plummer models - Varying virial temperatures
In order to study the effect of on our results we selected one of the 1:10 models. The merger remnant of the selected model has roughly the same mass in both the and configurations indicating that they were involved in an equal number of mergers by the end of the simulation. We used this initial configuration to vary between 0 (cold) and 1 (warm), see Tab. 2. Each run was repeated with kpc and for kpc. This results in a total of 12 different configurations, all of which are based on the same spatial distribution but with different virial radii and virial temperatures.
4 Results
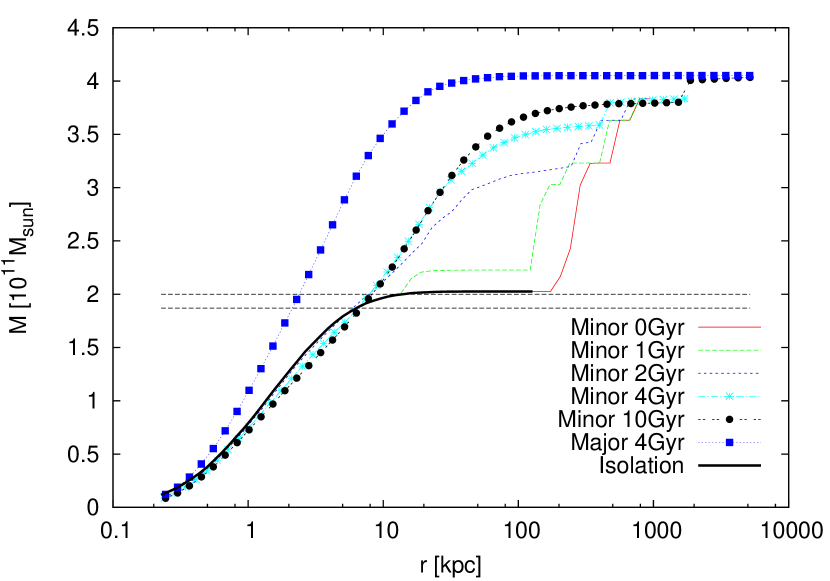
During the simulation snapshots are taken every 100M year and post-processed using tipsy 222http://www-hpcc.astro.washington.edu/tools/tipsy/tipsy.html. We compute the density and cumulative mass profiles which are subsequently used to determine the half-mass radius (), measured using the baryonic particles only. To compute the profiles tipsy computes the densest point in the simulation and then uses spherical shells centered on the densest point to bin the particles. To compute we can not simply take the radius that contains half of the total mass in the merger system, because depending on the time of the snapshot, not all child galaxies have merged with the primary galaxy. Therefore we analyze the cumulative mass profile (based on all baryonic particles in the system) of the galaxy and take as total mass the point where the profile flattens. This flattening indicates that all child galaxies within that radius have merged333We chose this method over a method where we check if particles are bound, since in this method we include child galaxies that would add to the luminosity of the remnant galaxy if they would be observed. with the primary galaxy and that the unmerged child galaxies are too far away to be counted as part of the merger remnant. This total mass is then used to determine . We illustrate this procedure in Fig. 4.
In Fig. 4 we present the cumulative mass-profiles of one of the 1:10 mergers with and , for the major merger with kpc and the profile of the isolated primary galaxy. During the first four Gyr of evolution the cumulative mass of the minor merger simulation gradually increases each time one of the child galaxies is accreted. We determine the total mass of the merger remnant by determining the first moment that the cumulative mass profile becomes flat. This happens, for example, for the 1 Gyr situation at a mass of , and for 2 Gyr at . We further notice that the minor merger remnant has grown in size with respect to the major merger remnant, even though it has accreted less mass. The major merger remnant ends up with twice the mass of the primary galaxy, e.g. a complete merger of all mass in the system. Whereas in the minor merger only 8 child galaxies have been accreted in the 4 Gyr after the start of the simulation. At the end of the simulation (T=10 Gyr) 9 child galaxies have merged with the primary galaxy. The last unmerged child appears in the cumulative mass distribution (striped line with solid circles), represented by the bump in the line at kpc (Fig. 4). As a consequence the total mass of the merger product at the end of the simulation is larger for the major merger than for the minor merger.
4.1 The growth of the primary due to subsequent mergers
We run each major merger model 16 times (with different inclination and ) and average the . For each set of minor merger initial conditions ( and , see Tab. 2.) we perform 10 simulations and as in the major mergers we average . These results are presented in Fig. 5 for the growth in size, and Fig. 6 for the growth in mass. The shaded areas are the deviation from the mean, but for the major mergers the areas are barely visible in comparison with the width of the line. This indicates that the inclination and the angle hardly affects the growth of the merger product. Only during the merger event itself some deviation is noticeable (at about 3 Gyr for the simulation with kpc). The head-on configuration () grows from an initial size of kpc to 3.4 kpc, whereas the to 75 kpc simulations grow to only about 2.4 kpc (only the kpc is presented in Fig. 5). The kpc did not experience a merger in our simulation within the time frame of 10 Gyr. For the minor merger configurations the result is quite different as can be seen in Fig. 5. The shaded areas indicate that there is variation in size between the different configurations. The size growth however is larger than that of the major mergers. The results indicate that the growth in size is directly related to the mass ratio of the child galaxies, the larger the difference in mass the larger the growth in size. For the 1:10 simulations the is at least 7 kpc and for the 1:80 simulations the average is at least 20 kpc while at the start of the simulation the primary galaxy has a of 1.3 kpc.
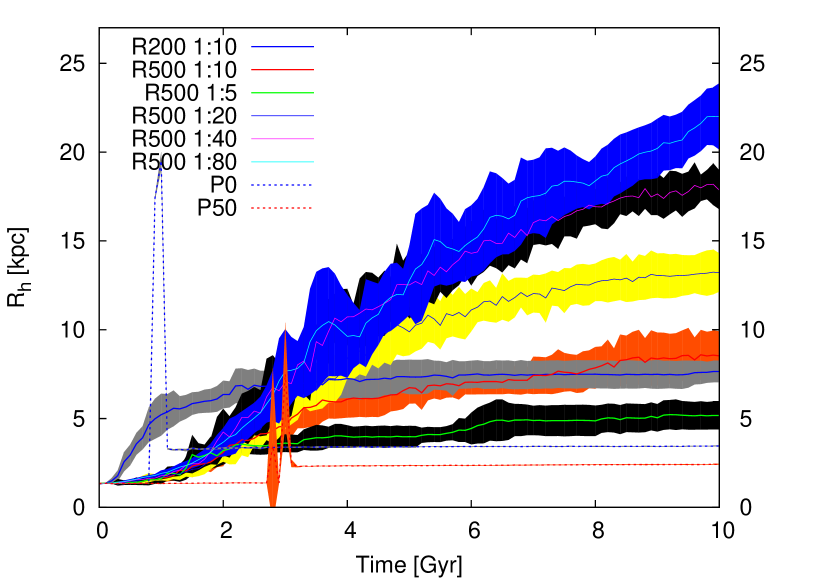
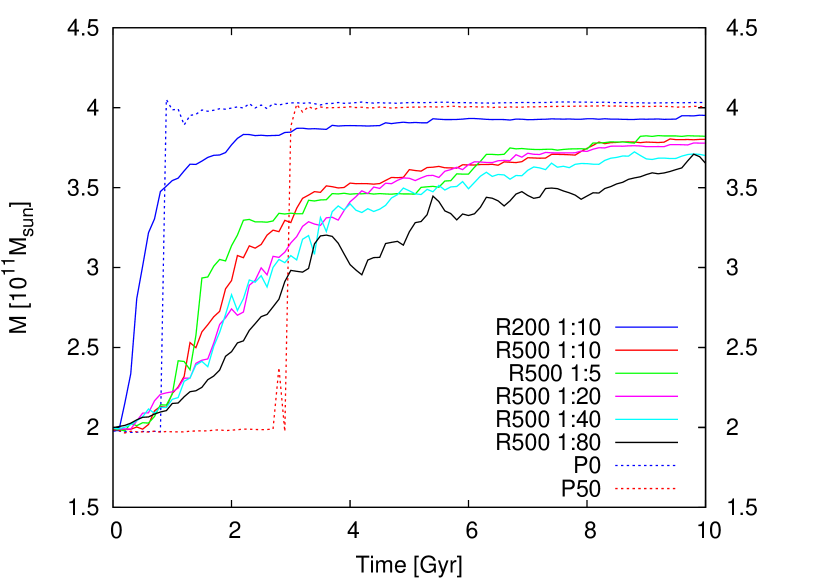
To study the effect of increasing the number of minor mergers (and decreasing the mass per child galaxy) in more detail we start by comparing the major merger with the 1:5 minor merger. This case results in a of 5.1 kpc, averaged over 10 simulations. The deviation indicates that the result is rather consistent when rerunning with a different initial Plummer realization. The extreme values of after 10 Gyr range between 4 and 6 kpc. Even the increase due to the 1:5 minor merger exceeds the major merger case by a factor of to 1.8. By the end of the simulation at 10 Gyr on average 4 out of the 5 minor galaxies have merged with the primary galaxy, and we expect that if the last child galaxy would be accreted the increase in size would be even larger. The 1:10, R200 kpc minor mergers show an average size of 7.6 kpc, and 8.5 kpc for the 1:10, R500 kpc models; an increase of 5.8 to 6.5. The kpc simulations merge on a shorter time scale compared to the kpc, which results in a smaller expansion, but higher mass of the simulations performed in a smaller volume. This is also visible in Fig. 6 where the kpc increases faster in mass and ends up being more massive than the kpc case. Even though kpc results in a less massive merger remnant than the kpc simulations, it grows to a larger size. This is caused by the disturbing effect that the dark-matter halo of the primary galaxy has on the child galaxies. With more galaxies placed outside the halo for the kpc case this effect will be more pronounced. While we continue to increase the number of child galaxies the size of the merger remnant continues to grow. We stopped with children, at which moment the increase in size compared to the major merger exceeded a factor 17. The main reason for the growth of the merger remnant when increasing the number of child galaxies is by the heating of the merger remnant. For each doubling of the number of child galaxies from 1:5 to 1:10, etc., the growth in size of the merger product is about constant by kpc. The growth in mass for each of these initial configurations is comparable, except for the 1:80, which grows less quickly. The smaller mass growth in the 1:80 is attributed to increased dynamical interactions among the child galaxies. These interactions cause the merging times per galaxy to take longer than when they would merge sequentially.
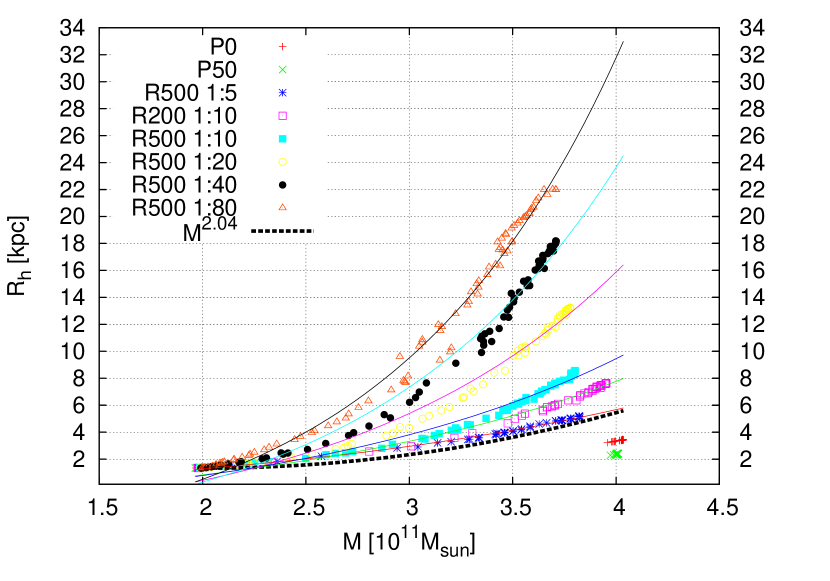
The combined growth in size and mass indicates an other effect, namely the larger the mass ratio the higher the growth in size. This is indicated in Fig. 7 where we present as a function of the merger remnant mass (which is a function of time). This figure quantifies the growth in size of the merger remnant while increasing the number of mergers. Note that the mass ratio between the merger remnant and the child galaxies changes over time. For example the 1:10 minor mergers start with a mass difference of a factor 10 between one child galaxy and the primary galaxy, but after the primary galaxy has merged with 5 child galaxies the mass ratio between the merger remnant and one child galaxy is 1:15. Interestingly it is not necessarily the mass that drives the merger remnant size, but it is the number of children that merges with the primary galaxy. The solid curves are fits through the data, and represent exponential curves. The dashed line is the observed scaling relation of (van Dokkum et al., 2010). As we can see our minor mergers are above this relation while the major mergers are clearly smaller than the observational results. Indicating that the minor mergers can cause a size increase comparable or even larger than that observed.
4.2 The effect on the galaxy shape due to subsequent mergers
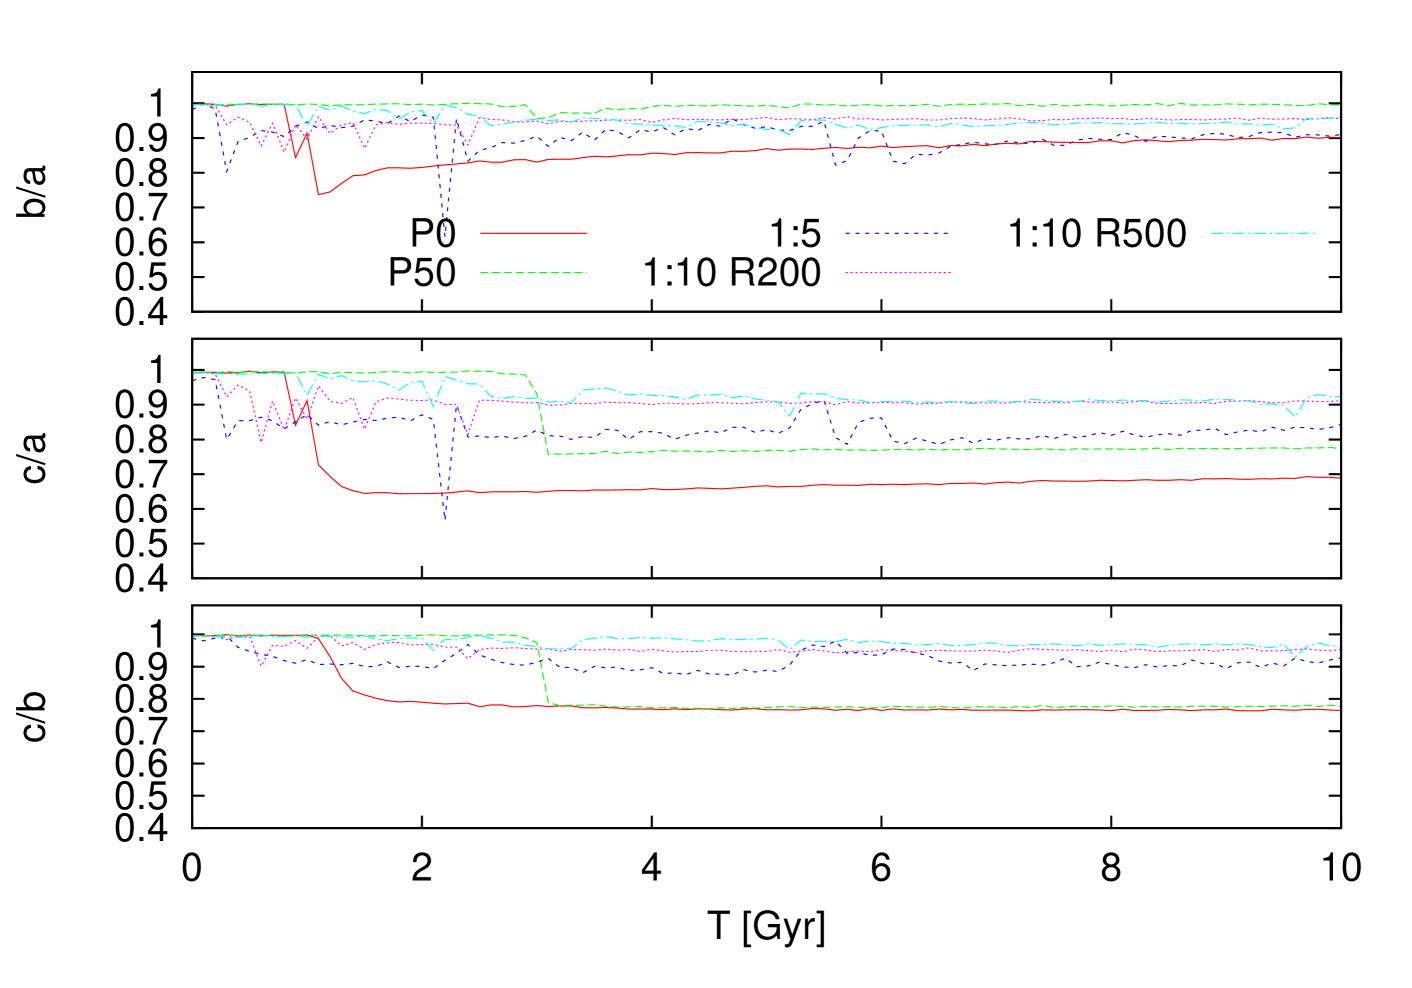
Now that we have established that the minor mergers can have a pronounced effect on the size of the galaxy remnant it will be interesting to see if we can recognize this galaxy growth by the shape of the merger remnant. To test the effect that the mergers have on the shape we measure the semi-principal axes , and of the ellipsoidal with . The axes lengths are obtained by computing the eigenvalues of the inertial tensor of the galaxy. Using this we plot the three axis ratios , and , if these three ratios are 1 then the elliptical is perfectly spherical. If one of the axis is much smaller than the other two the galaxy is a flattened spherical.
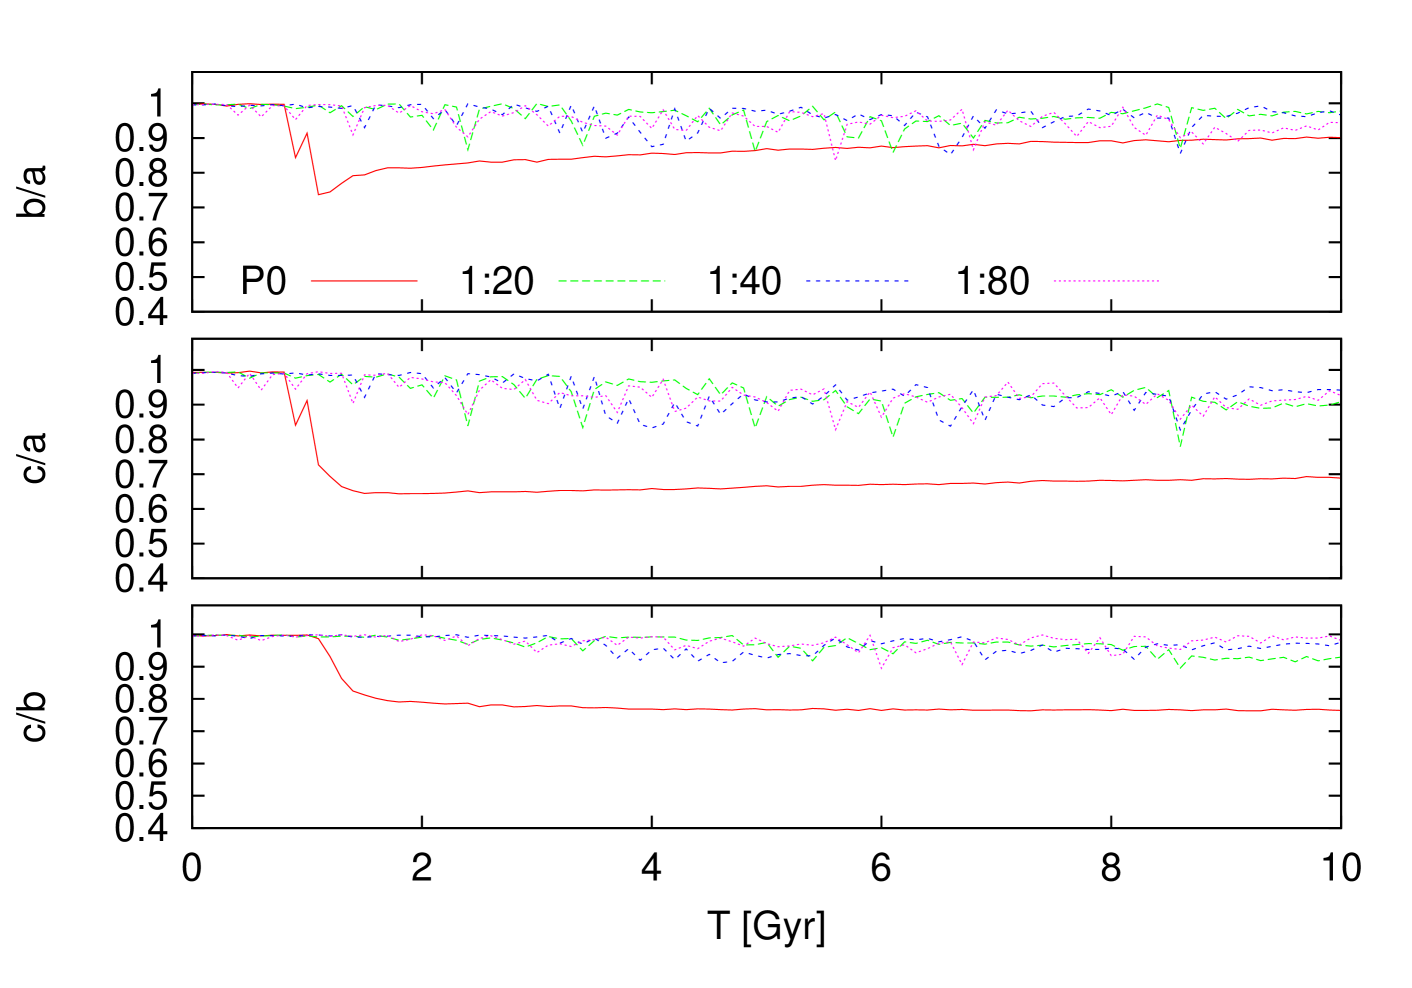
In Figs. 8 and 9 we present how the shape of the merger remnant (measured at ) evolves over time (baryonic component only). For the major mergers we used the default configurations with and 50 kpc and for the minor merger configurations we randomly took one of the 10 realisations for each of the used mass ratios. The x-axis shows the simulation time while each of the three panels presents one of the aforementioned axis ratios. Visible is that all galaxies start of as a perfect sphere, which is the initial condition, but over time the merger remnants deform. The major mergers show the highest degree of deformation with large differences between the different axis. The effect is most severe for the heads-on collision which is expected as it is the most violent collision of all our configurations. Although the major merger remnants become slightly more spherical after the mergers are complete the galaxies will not become perfectly spherical within a Hubble time.
For 1:5 we notice, as with the the major mergers, a clear deformation from spherical, but the effect is less strong than for the major mergers. The individual merger events of 1:5 are visible by the spikes in the axis ratios. The impact that a merger event has on the shape of the merger remnant becomes smaller when the mass difference between merger remnant and the infalling galaxy increases. For the 1:10 configurations, we do see slight deformations during the merger events (the shark tooth’s in the lines), but when the merger is complete the remnant settles back to spherical. The same effect is visible for 1:20, 1:40 and 1:80 (Fig. 9). The final merger remnant of the minor merger configurations is no longer perfectly spherical, but it clearly is not as flat as the major merger configurations. Indicating that the accreted mass is distributed differently through out the merger remnant in the minor merger simulations than in the major merger simulations. We cover the location of the accreted mass in more detail in Section 5.
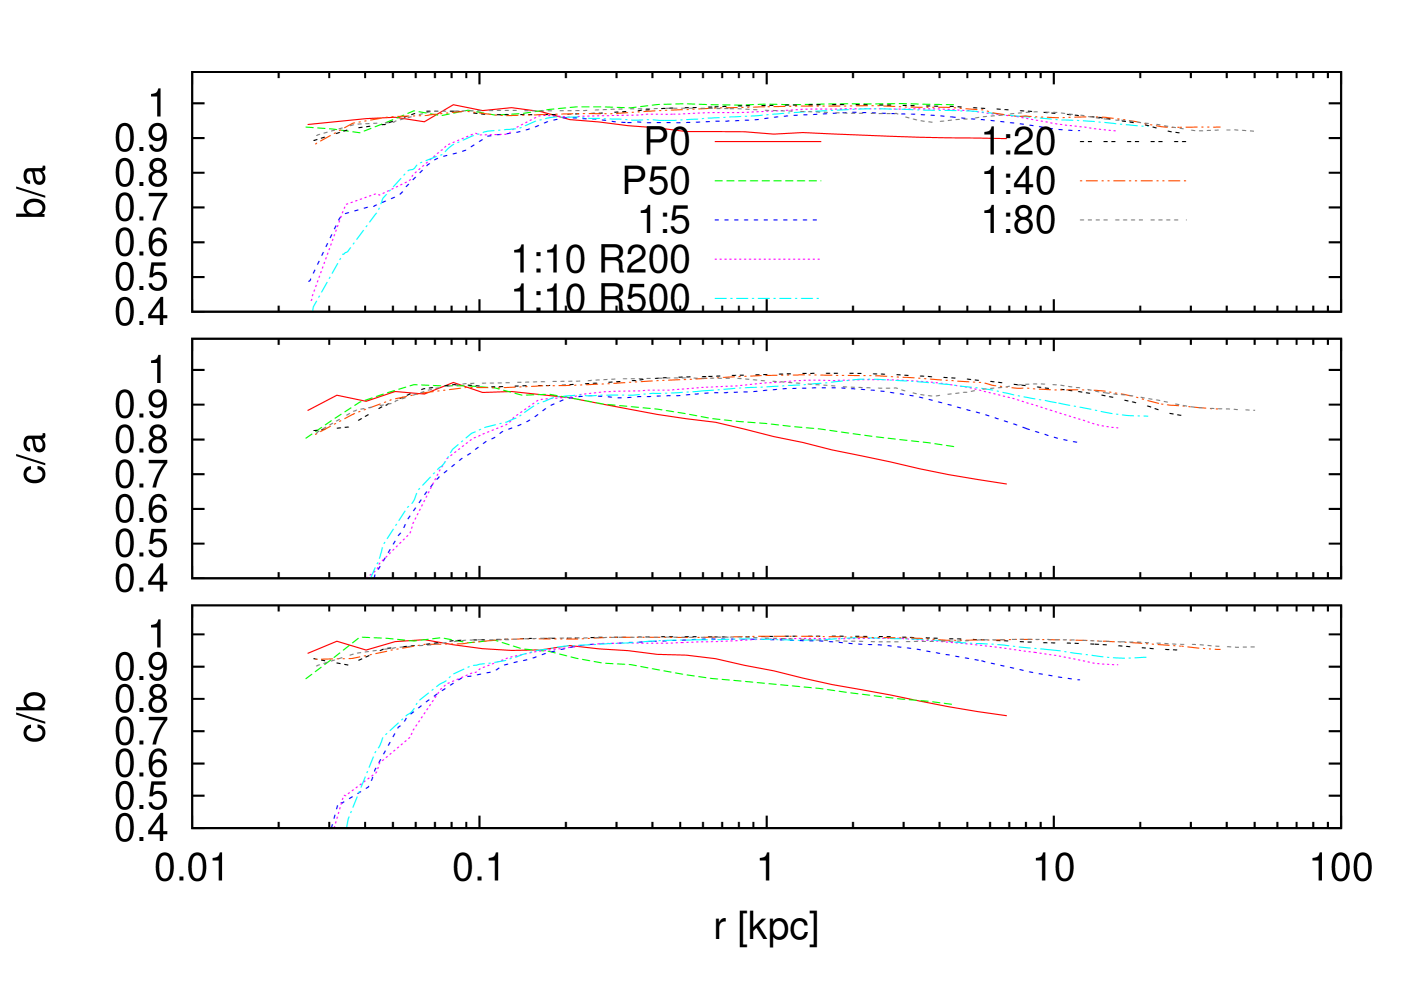
In Fig. 10 we present the galaxy shape at Gyr from the core of the merger remnant up to , while in the previous paragraph we looked at the shape of the merger over time and only at the location. Because is different for each configuration the lines representing the configurations in Fig. 10 have different lengths. The minor merger results are averaged over the different realisations of the model. We notice that the larger the differences in mass between the the primary galaxy and the child galaxies the more spherical the merger remnant stays (axis ratios near 1). The differences between the major and minor mergers are especially visible on the outsides of the merger remnant (). The major mergers are much more deformed from perfectly spherical into flattened ellipticals while the minor mergers stay near spherical all the way to the outskirts of the galaxy. The difference in the core of 1:5 and 1:10 with respect to the other configurations is the result of running these simulations with only particles and accompanying larger softening. We checked this by comparing the individual results of one of the major mergers and a 1:10 high resolution simulation with the comparable configurations in low resolution. In the high resolution simulations we do not observe the deformation in the core, instead the axis-ratios have a similar profile as the other high resolution configurations.
4.3 The effect of the virial temperature
In the previous section the virial temperature () of the minor merger configurations was always set to zero. This resulted in cold collapse and consequently the fastest possible merger. In this section we investigate the configurations described in Section 3.2.1 where is varied. The results are presented in Fig. 11 where we present as a function of the merger remnant mass444We filtered the results to not include fly-by events which temporarily increases . (which is a function of time). In the top panel the results for the kpc are presented and the bottom panel presents the results for the kpc configurations. The results for the major mergers with 0, 10 and 50 kpc are presented in both panels.
The major mergers are the same as the ones presented in the previous section and end up with a final mass that is double that of the isolated galaxy (). Indicating that in all major merger configurations the two galaxies fully merge. The horizontal distribution in mass is caused by accretion of stars that were flung out and later fell back onto the merger product, thereby increasing the mass of the merger remnant.
The merger events that occur in the minor merger simulations can be seen in the horizontal distribution of the points. The horizontal distance between the points compares to a separation equal to the mass of a 1:10 child galaxy. Even though the minor merger configurations are based on the same spatial distribution, they are not per se involved in the same amount of mergers, this depends on and . Comparing the cold () and warm () configurations we notice that at the end of the simulation the cold configurations have a higher mass than the warm case. In the warm configurations the child galaxies have a higher velocity which increases their merging times. However, both warm and cold show a size increase larger than that of the major merger simulations. This is confirmed by the lines that show exponential fits555Note that the fits through the results are based on only 4 (1) merger events in the kpc ( kpc) configurations. The observed trend however is the same as for the configuration which is based on 10 (9) mergers. through the configurations with , and .
The fits indicate that if all child galaxies merge with the primary, the merger remnant would have a size that is at least a factor of two larger than the remnants formed by major merging independent of . For the mergers this is even three times as large as the major mergers. Also visible in Fig. 11 is the difference between the kpc and kpc configurations. Here we notice, as in Fig. 5, that the kpc configurations show a larger size increase than the kpc configurations, even though the amount of completed mergers in the kpc is less than in the matching kpc configuration. This is attributed by the higher energy input that the child galaxies give in the kpc configuration compared to the kpc situation where half the child galaxies are already within the dark matter halo of the primary galaxy at .
5 Discussion
The simulations indicate that the effects of the minor mergers becomes more pronounced when more mergers are involved in the mass growth. To test if this trend continues we performed three extra simulations with 160 child galaxies (mass ratio 1:160). With this many children the simulation approaches the regime of a continuous stream of infalling material. The three simulations gave very similar results with little variation between the runs. With this many child galaxies their distribution around the primary galaxy becomes almost uniform. The effect of the random placement of the child galaxies is therefore much smaller than in the simulations for 5 to 20 child galaxies. Furthermore some of the children will merge with other children before they reach the primary galaxy. For the 1:160 simulations we use particles evenly divided over the primary () and the child galaxies ( per galaxy).
5.1 Properties of the merger remnant
The circular velocity ( ) and the cumulative mass profile at the end of the simulations (at Gyr), both are presented in Fig. 12. The top panel shows and the bottom panel presents the cumulative mass profile over the same distance from the core. For the mergers we averaged the results of the random realizations.
The major mergers cause an increase in the compared to the isolated model. Whereby the remnants formed by major mergers with an elliptic orbit ( kpc) have a which is 100 km/s higher than that of the isolated galaxy. For the remnants that formed by minor mergers we see a decrease in compared to the isolated galaxy. Especially for the 1:40 and 1:80 the effect is quite pronounced, with the large size increase comes a decrease in velocity. This indicates that the lighter the child galaxies are the lower the becomes, this trend continuous for the 1:160 models. These models have the lowest circular velocity of all the configurations while at the same time showing the largest size increase.
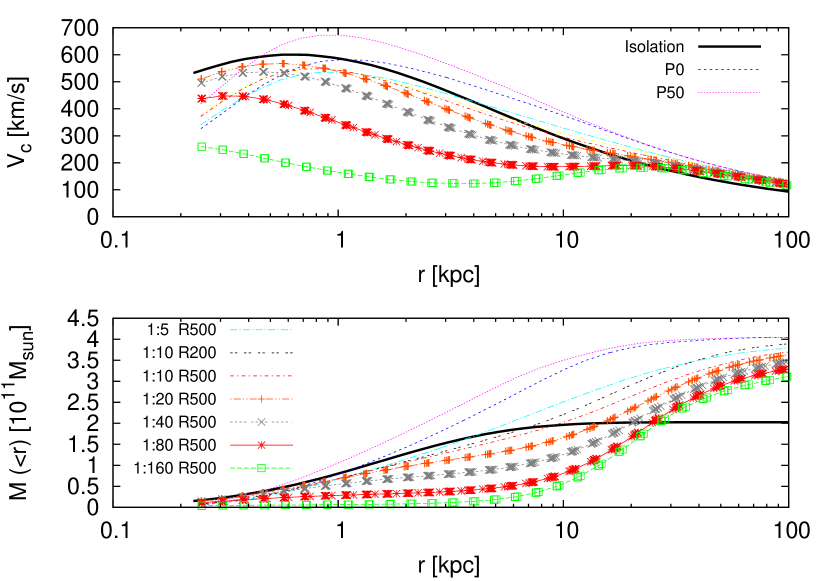
The size increase can be deduced from the cumulative mass profiles presented in the bottom panel of Fig. 12. We notice that the mass in the core of the merger decreases when more child galaxies are involved in the merging process. This effect is especially pronounced for the smaller mass-ratios (1:20). The smaller child galaxies have longer merging times, this combined with their interactions inside the core of the merger remnant does not allow the merger remnant to stabilize. Therefore the mass does not sink back to the core within the simulation period. This is also apparent in the density profiles presented in Fig. 13. Here the major mergers have a density comparable to that of the isolated galaxy which in turn is higher than the density of the minor mergers. For the 1:5 and 1:10 mergers the density profiles have a similar shape to that of the isolated galaxy and the major merger remnants, but the configurations with mass ratios of have a different shape. The relatively sudden depression in the density profiles of 1:80 and 1:160 near kpc is a trend that is visible in the 1:40 configuration and in slightly less pronounced form for the 1:20 configurations. The longer merging times and dynamic interactions that takes place when the number of child galaxies is 20 causes a slowdown in circular velocity, a reduction in mass and therefore a drop in density in the inner parts of the merger remnant.
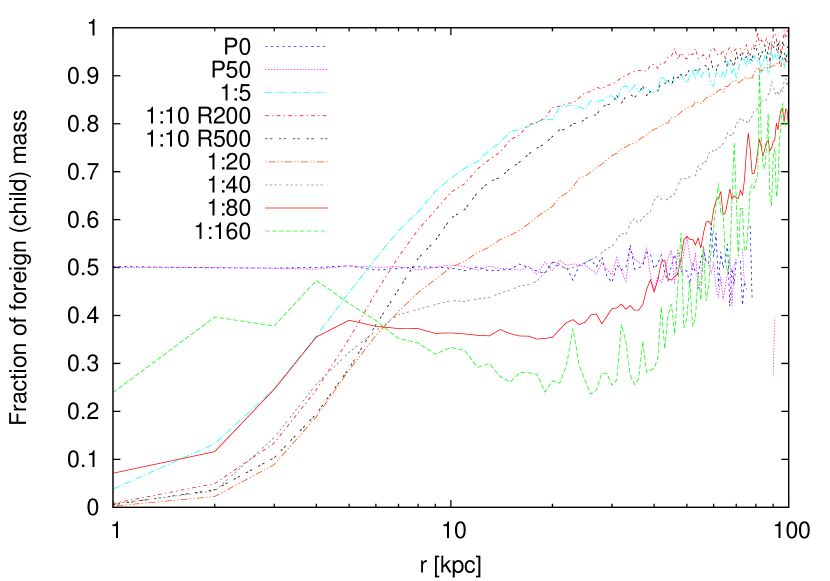
The effects described above influence where the mass of the child galaxies is accreted in the merger remnant. In Fig. 14 we present the fraction of baryonic mass that originates from the child galaxies as a function of the distance to the center of the merger remnant. The curves are constructed by binning the particles in 1 kpc bins and compute the fraction of mass that was brought in by the child galaxies. The curves representing the major mergers (solid-red for model P0 and dashed-green for P50) are horizontal and at 0.5 in Fig. 14, which indicates that they mix homogeneously. Minor mergers experience a different mixing; the precise effect depends sensitively on the number of infalling galaxies.
We take a closer look at the 1:5 to 1:20 mass ratios mergers. These configurations behave as expected Hilz et al. (2012b); the fraction of child material is small in the core of the merger remnants and high in the outskirts ( kpc). While the mass ratio continues to decrease the fraction of foreign material in the outskirts also decreases; until the majority of outskirt material is original for the most extreme mass ratio (1:160). We have to note here that for the most extreme mass ratio’s the merger process has not completed at Gyr, which is noticeable in Fig. 14 by the mean line appearing smaller than 0.5. In the central portion ( kpc) of the most extreme mass ratio mergers the opposite happens, in the sense that the contribution of foreign material is actually increasing (in particular noticeable for the 1:160 mass ratios).
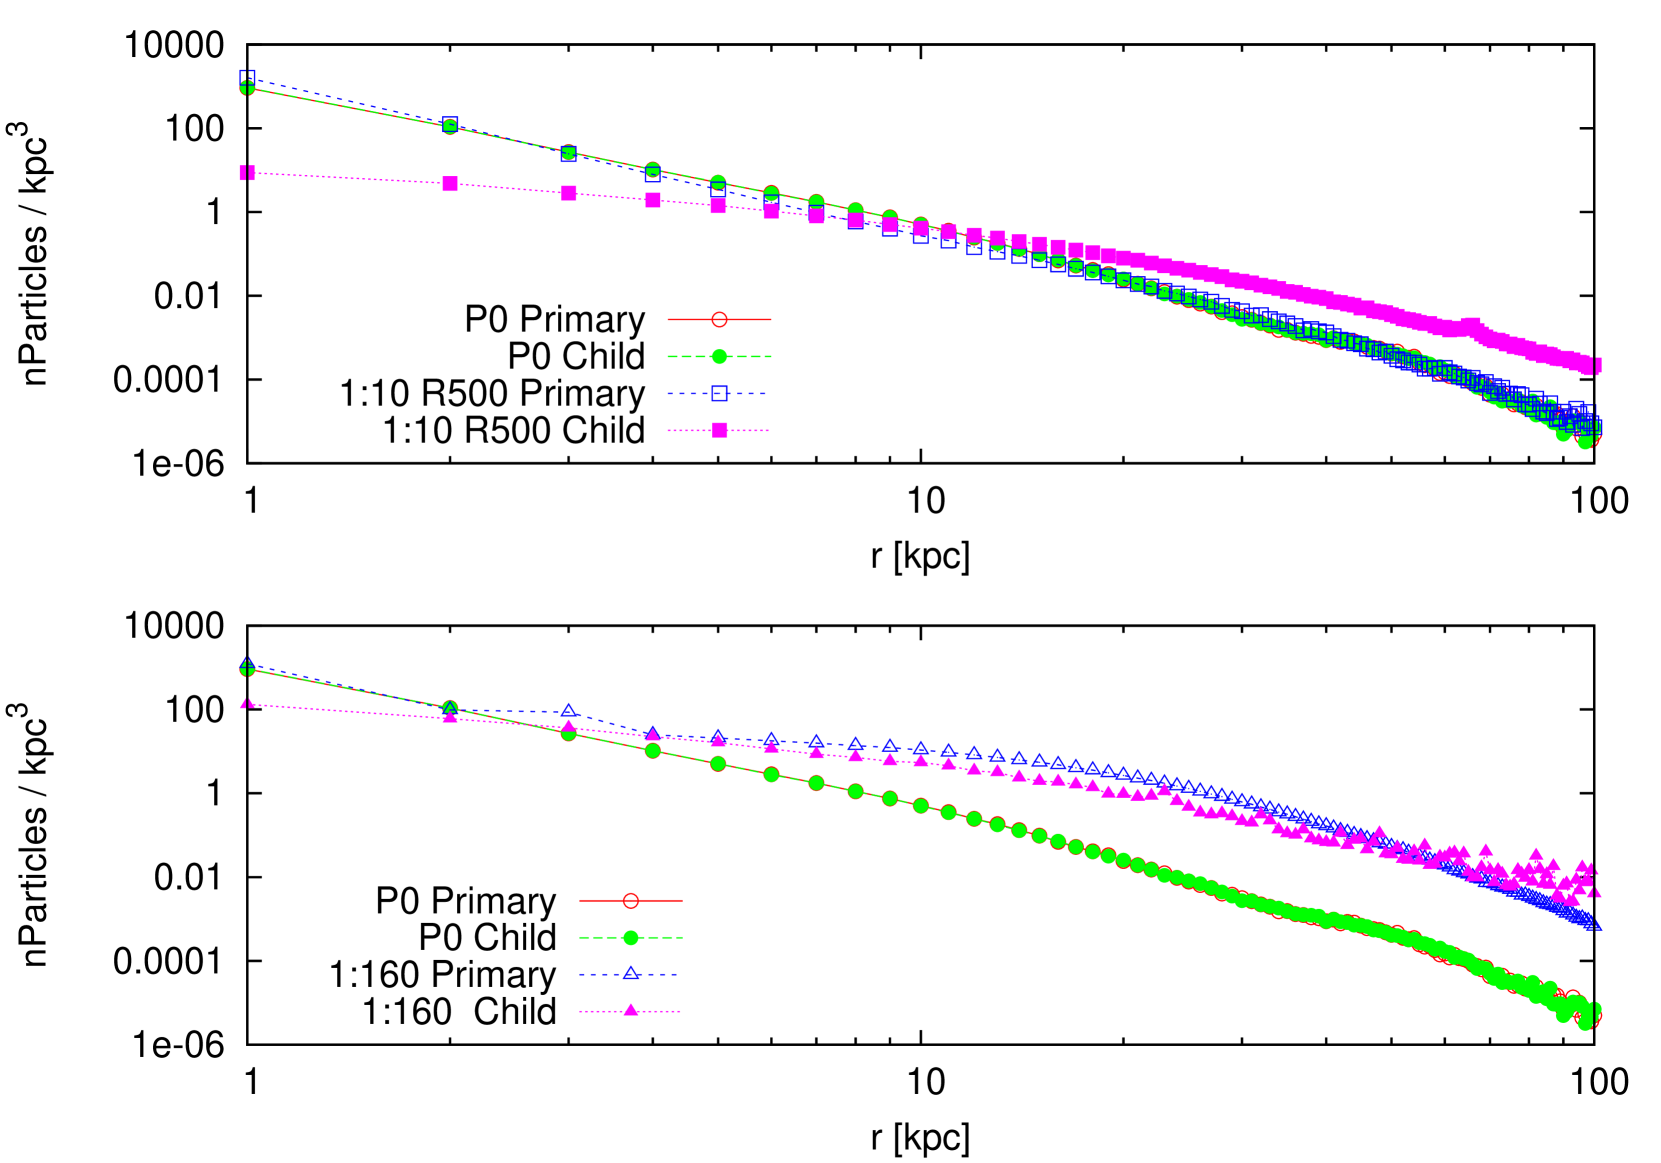
In Fig. 15 we present the number density of the foreign and native particles as a function of the radius. We do this for a mass ratio of 1:1, 1:10 and 1:160. As we already discussed in relation to Fig. 14 the mass in the major merger remnant is evenly distributed between the primary and the infalling galaxy. In the 1:10 merger (top panel) the two curves for the foreign material and for the native material are clearly separated, in contrast to the lines for the major merger. This indicates that the native material is distributed differently than the foreign material. The same effect is noticeable in the 1:160 merger (lower panel in Fig. 15), but less pronounced. This indicates that in the 1:160 merger the material of the primary and child galaxies is mixed more evenly and approaches a mass distribution similar to that of the major mergers, whereas in the 1:10 merger the native and foreign material are distributed quite differently.
The results presented in the previous § indicate that for mass ratios 1:1 to 1:20 the accretion behaves according as if they grew from inside-out; the material of the child galaxies is stripped and deposited in the outside of the primary galaxy (Hilz et al., 2012b). When the number of child galaxies increases beyond 20 this behavior changes in that the mixing becomes more homogeneous. This is caused by the self-interactions of the child galaxies with the nucleus of the primary. These self-interactions prevent the merger galaxy from settling to equilibrium and cause the core to heat up.
We theorize that the continuous bombardment of minor galaxies causes the merger remnant to remain quite dynamic which reduces the dynamical friction. This in itself allows new incomers to penetrate deeper into the parent galaxy. This effect mimics the process of violent relaxation (Lynden-Bell, 1967). This effect becomes more efficient when the number of child galaxies increases. During the in-fall they interact with other infalling children before they break-up, after which their mass is distributed evenly in the merger remnant. The interactions are not strong enough to permanently eject a child. When the child galaxies are more massive 1:5 to 1:20 mergers self interactions between the children is negligible and they tend to be disrupted upon the first pericenter passage of the merger product. As a result their material tends to be deposited in the outskirts.
The net growth in size observed in our simulations exceeds those reported in (Nipoti et al., 2009a, 2012). The initial conditions of (Nipoti et al., 2009a, 2012), however, deviates from ours in the sense that they adopt a more realistic mass and shape distribution than in our more theoretical approach. As a consequence the results cannot be compared trivially. The more efficient growth in our simulations is a result in the distribution of the minor galaxies, and not by the choice of their densities; the effect of the child densities is negligible (see Appendix B). Our results are consistent with those of Hilz et al. (2012a); Oogi & Habe (2012) for mass ratios , in the sense that the growth in size is sufficiently efficient to explain the observational results when the number of infalling galaxies 5 (and consequently a mass ratio ). For more extreme mass ratios we find a gradual change in the behavior. This regime was not simulated by Hilz et al. (2012a) and Oogi & Habe (2012).
6 Conclusion
We have studied dry minor mergers of galaxies in order to understand the observed growth in size without much increasing the mass of compact massive galaxies. The simulations ware performed the Bonsai GPU enabled tree code for op to 17.6 million particles. Our simulations start with a major galaxy and a number of minor galaxies in a kinematically cold (and warm) environment. The total mass of the child galaxies equals that of the primary. The simulation were performed for 10 Gyr, and we study the size growth of the merger remnant. We demonstrate that mergers with a mass ratio 1:5 to 1:20 satisfactory explain the observed growth in size of compact galaxies. The growth of the merger remnant is always at least a factor of two higher than in the case of a major merger. This result is robust against variations in the initial density of the child galaxies. The mass of the minor galaxies tend to be accreted to the outside of the merger remnant. As a consequence the core of the merger remnant, formed by the original primary galaxy, will hardly be affected by the merging process. This ’inside-out-growth’ is consistent with previous studies (Hilz et al., 2012b).
If the number of child galaxies exceeds 20 the behavior of accretion changes, in the sense that the minor galaxies tend to accumulate in the central portion of the merger remnant. Evidence for this ’outside-in’ growth is present in the density and velocity profiles of the merger remnant. The outside-in growth is mediated by self interactions among the child galaxies before they dissolve in the merger remnant.
We conclude that the observed large massive elliptical galaxies can be evolved from compact galaxies at if they have grown in mass by accreting 5-10 minor galaxies with a mass ratio of 1:5 to 1:10. The majority of accreted mass will be deposited in the outskirts of the merger remnant.
Acknowledgments
We thank Marijn Franx and Steven Rieder for discussions. This work is supported by NWO grants (grants #643.000.802 (JB), #639.073.803 (VICI), and #612.071.305 (LGM)) and by the Netherlands Research School for Astronomy (NOVA).
References
- Athanassoula et al. (1998) Athanassoula E., Bosma A., Lambert J.-C., Makino J., 1998, MNRAS, 293, 369
- Athanassoula et al. (2000) Athanassoula E., Fady E., Lambert J. C., Bosma A., 2000, MNRAS, 314, 475
- Bédorf et al. (2012) Bédorf J., Gaburov E., Portegies Zwart S., 2012, Journal of Computational Physics, 231, 2825
- Bezanson et al. (2009) Bezanson R., van Dokkum P. G., Tal T., Marchesini D., Kriek M., Franx M., Coppi P., 2009, ApJ, 697, 1290
- Cimatti et al. (2012) Cimatti A., Nipoti C., Cassata P., 2012, MNRAS, 422, L62
- Daddi et al. (2005) Daddi E., Renzini A., Pirzkal N., Cimatti A., Malhotra S., Stiavelli M., Xu C., Pasquali A., Rhoads J. E., Brusa M., di Serego Alighieri S., Ferguson H. C., Koekemoer A. M., Moustakas L. A., Panagia N., Windhorst R. A., 2005, ApJ, 626, 680
- Dehnen (2001) Dehnen W., 2001, MNRAS, 324, 273
- Dubinski (1996) Dubinski J., 1996, New Astronomy, 1, 133
- Franx et al. (2008) Franx M., van Dokkum P. G., Schreiber N. M. F., Wuyts S., Labbé I., Toft S., 2008, ApJ, 688, 770
- Harfst et al. (2007) Harfst S., Gualandris A., Merritt D., Spurzem R., Portegies Zwart S., Berczik P., 2007, New Astronomy, 12, 357
- Heggie & Mathieu (1986) Heggie D. C., Mathieu R. D., 1986, in Hut P., McMillan S. L. W., eds, The Use of Supercomputers in Stellar Dynamics Vol. 267 of Lecture Notes in Physics, Berlin Springer Verlag, Standardised Units and Time Scales. p. 233
- Hilz et al. (2012b) Hilz M., Naab T., Ostriker J. P., 2012b, ArXiv e-prints 1206.5004
- Hilz et al. (2012a) Hilz M., Naab T., Ostriker J. P., Thomas J., Burkert A., Jesseit R., 2012a, ArXiv e-prints 1206.1597
- Hopkins et al. (2010) Hopkins P. F., Croton D., Bundy K., Khochfar S., van den Bosch F., Somerville R. S., Wetzel A., Keres D., Hernquist L., Stewart K., Younger J. D., Genel S., Ma C.-P., 2010, ApJ, 724, 915
- Hopkins et al. (2009) Hopkins P. F., Hernquist L., Cox T. J., Keres D., Wuyts S., 2009, ApJ, 691, 1424
- Kuijken & Dubinski (1995) Kuijken K., Dubinski J., 1995, MNRAS, 277, 1341
- Lacey & Cole (1993) Lacey C., Cole S., 1993, MNRAS, 262, 627
- Lynden-Bell (1967) Lynden-Bell D., 1967, MNRAS, 136, 101
- Martinez-Manso et al. (2011) Martinez-Manso J., Guzman R., Barro G., Cenarro J., Perez-Gonzalez P., Sanchez-Blazquez P., Trujillo I., Balcells M., Cardiel N., Gallego J., Hempel A., Prieto M., 2011, ApJL, 738, L22
- Merritt (1996) Merritt D., 1996, AJ, 111, 2462
- Miller & Smith (1980) Miller R. H., Smith B. F., 1980, ApJ, 235, 421
- Naab et al. (2009) Naab T., Johansson P. H., Ostriker J. P., 2009, ApJL, 699, L178
- Naab et al. (2006) Naab T., Khochfar S., Burkert A., 2006, ApJL, 636, L81
- Navarro et al. (1996) Navarro J. F., Frenk C. S., White S. D. M., 1996, ApJ, 462, 563
- Nipoti et al. (2009a) Nipoti C., Treu T., Auger M. W., Bolton A. S., 2009a, ApJL, 706, L86
- Nipoti et al. (2009b) Nipoti C., Treu T., Bolton A. S., 2009b, ApJ, 703, 1531
- Nipoti et al. (2012) Nipoti C., Treu T., Leauthaud A., Bundy K., Newman A. B., Auger M. W., 2012, MNRAS, 422, 1714
- Oogi & Habe (2012) Oogi T., Habe A., 2012, MNRAS, p. 42
- Oser et al. (2012) Oser L., Naab T., Ostriker J. P., Johansson P. H., 2012, ApJ, 744, 63
- Oser et al. (2010) Oser L., Ostriker J. P., Naab T., Johansson P. H., Burkert A., 2010, ApJ, 725, 2312
- Peebles (1980) Peebles P. J. E., 1980, The large-scale structure of the universe
- Plummer (1915) Plummer H. C., 1915, MNRAS, 76, 107
- Salmon & Warren (1994) Salmon J. K., Warren M. S., 1994, Journal of Computational Physics, 111, 136
- Szomoru et al. (2012) Szomoru D., Franx M., van Dokkum P. G., 2012, ApJ, 749, 121
- Taylor et al. (2010) Taylor E. N., Franx M., Glazebrook K., Brinchmann J., van der Wel A., van Dokkum P. G., 2010, ApJ, 720, 723
- Toft et al. (2007) Toft S., van Dokkum P., Franx M., Labbe I., Förster Schreiber N. M., Wuyts S., Webb T., Rudnick G., Zirm A., Kriek M., van der Werf P., Blakeslee J. P., Illingworth G., Rix H.-W., Papovich C., Moorwood A., 2007, ApJ, 671, 285
- Trujillo et al. (2012) Trujillo I., Carrasco E. R., Ferré-Mateu A., 2012, ApJ, 751, 45
- Trujillo et al. (2009) Trujillo I., Cenarro A. J., de Lorenzo-Cáceres A., Vazdekis A., de la Rosa I. G., Cava A., 2009, ApJL, 692, L118
- Trujillo et al. (2011) Trujillo I., Ferreras I., de La Rosa I. G., 2011, MNRAS, 415, 3903
- Trujillo et al. (2006) Trujillo I., Förster Schreiber N. M., Rudnick G., Barden M., Franx M., Rix H.-W., Caldwell J. A. R., McIntosh D. H., Toft S., Häussler B., Zirm A., van Dokkum P. G., Labbé I., Moorwood A., Röttgering H., et al. 2006, ApJ, 650, 18
- Valentinuzzi et al. (2010) Valentinuzzi T., Poggianti B. M., Saglia R. P., Aragón-Salamanca A., Simard L., Sánchez-Blázquez P., D’onofrio M., Cava A., Couch W. J., Fritz J., Moretti A., Vulcani B., 2010, ApJL, 721, L19
- van de Sande et al. (2011) van de Sande J., Kriek M., Franx M., van Dokkum P. G., Bezanson R., Whitaker K. E., Brammer G., Labbé I., Groot P. J., Kaper L., 2011, ApJL, 736, L9
- van der Wel et al. (2008) van der Wel A., Holden B. P., Zirm A. W., Franx M., Rettura A., Illingworth G. D., Ford H. C., 2008, ApJ, 688, 48
- van Dokkum et al. (2008) van Dokkum P. G., Franx M., Kriek M., Holden B., Illingworth G. D., Magee D., Bouwens R., Marchesini D., Quadri R., Rudnick G., Taylor E. N., Toft S., 2008, ApJL, 677, L5
- van Dokkum et al. (2009) van Dokkum P. G., Kriek M., Franx M., 2009, Nature, 460, 717
- van Dokkum et al. (2010) van Dokkum P. G., Whitaker K. E., Brammer G., Franx M., Kriek M., Labbé I., Marchesini D., Quadri R., Bezanson R., Illingworth G. D., Muzzin A., Rudnick G., Tal T., Wake D., 2010, ApJ, 709, 1018
- Widrow & Dubinski (2005) Widrow L. M., Dubinski J., 2005, ApJ, 631, 838
- Widrow et al. (2008) Widrow L. M., Pym B., Dubinski J., 2008, ApJ, 679, 1239
Appendix A Resolution effects
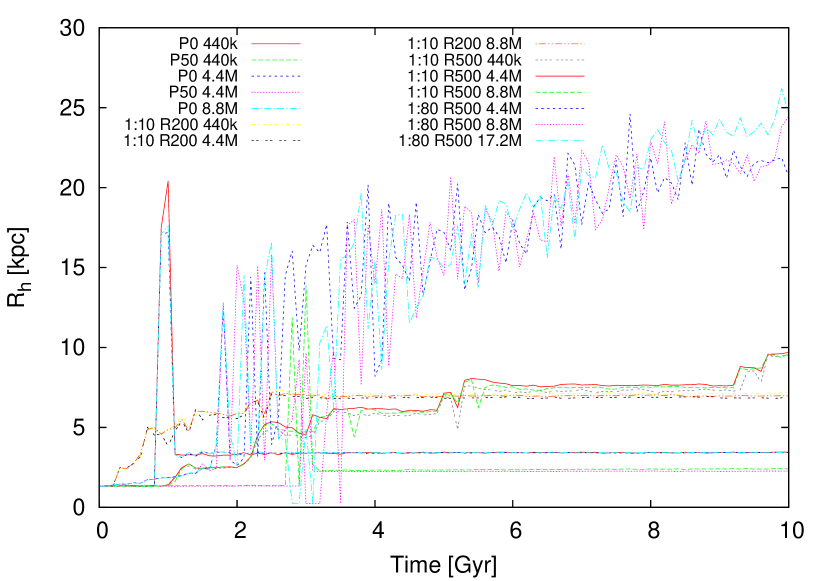
As discussed in Sect. 2 we perform a range of simulations with various resolutions for different major and minor merger setups. Depending on the number of child galaxies we use low (LR) and high (HR) resolution configurations (see Tab. 1). In the LR configurations we adapted particles of which half belongs to the primary and the other half to the child galaxies. For the HR simulations we have . To verify that the chosen resolutions are sufficient we ran a subset of our configurations with even higher resolutions. The results can be seen in Fig. 16. Here we present the size evolution of two major merger configurations, a 1:10 merger with kpc and kpc and one of the 1:80 mergers. Each configuration is run using the default resolution, as specified in Tab. 2, and using two higher resolutions For the 1:80 simulation this translates to , and . For the other configurations we use , and . For each of the resolutions we checked if the chosen time-step and softening was sufficient to keep the model stable in isolation using the method described in Sect. 2. In all but the 1:80 configurations there is little to no difference in the size of the merger remnant over the course of the simulation. Indicating that our choice of is sufficiently large. The large amount of child galaxies in the 1:80 configurations cause child galaxies to interact with each other and not directly merge with the primary galaxy. The galaxies keep flying in and out of the remnant and makes it harder to determine of the merger remnant which causes the large fluctuation in size of the 1:80 merger models. However, the trend of the increase is independent of the used resolution. As final test we performed the 1:80 configuration with particles (not plotted) which quantitatively gives the same result, indicating that is adequate for the 1:80 configurations.
Appendix B The effect of child density
As described in Sect. 2 we do not change the density of the child galaxies when generating the initial conditions. Instead we change the cut-off radius to be a factor, , smaller than that of the primary galaxy. This scales with the mass ratio of the child galaxy. For example the cut-off radius of a child galaxy with mass ratio 1:10 is 10 times smaller than that of the primary. Together with the cut-off radius the mass is also reduced by a factor 10 giving the child galaxies a density lower than that of the primary galaxy (§ 2).
To test the effect of the density on the size growth of the merger product we generated two new 1:10 child galaxies. In addition to the standard child galaxy we created a compact and a supercompact child galaxy. These galaxies are generated such that their densities are higher than that of the standard child galaxy. The galaxy properties are presented in Tab. 3.
| Model | Bulge mass | Cut-off | ||
|---|---|---|---|---|
| [] | [kpc] | [kpc] | [ | |
| Primary | 100 | 1.36 | 1232 | |
| standard | 10 | 1.26 | 142 | |
| compact | 5.1 | 0.68 | 307 | |
| supercompact | 0.9 | 0.25 | 4609 |
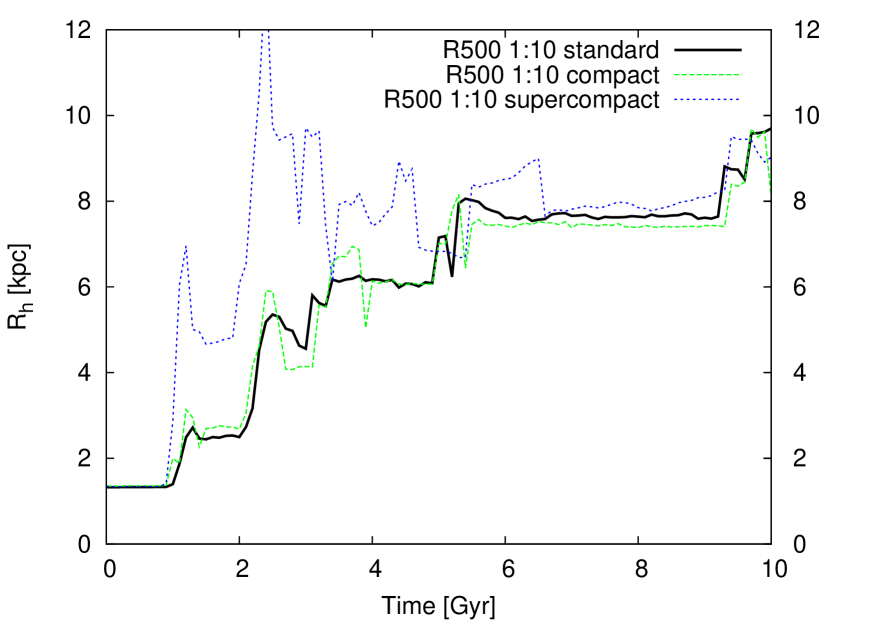
With the new child galaxies in place we selected one of the 1:10 kpc merger configurations and ran this realization with the new child galaxies. Each model is evolved for 10 Gyr using high resolution ().
The effect of the child density on the size growth of the merger remnant is presented in Fig. 17, where we show as a function of time. The standard and compact configurations show similar evolution. The supercompact configuration shows a different behaviour during the first 5 Gyr of the simulation. This is an artifact of the way we determine the size of the merger remnant which does not work perfect in this particular configuration (see § 4). The compactness of the galaxies causes the cumulative mass-profile to be irregular compared to the simulations with less dense child galaxies. As a consequence we are not always able to correctly measure the position in the profile that indicates the end of the merger remnant. After 5 Gyr the procedure works correct, because at this point the child galaxies have been involved in so many interactions that the mass-profile is smooth again. When the method starts working again we notice that all three simulations show similar size growth, independent of their density.
B.1 Circular velocity
The circular velocity of the standard and high density child simulations is presented in Fig. 18 (top) we notice that the density of the child galaxy does affect the results. The simulation with the most dense child galaxies (striped line with stars) has a circular velocity similar to that of the isolated galaxy (thick solid line). The compact configuration has a circular velocity that is 100 km/s lower than the supercompact configuration. The standard configuration has a circular velocity in between the results of the compact and supercompact models. There is no clear trend in the effect the child density has on the circular velocity. A similar effect can be seen in the cumulative mass distribution of Fig. 18 (bottom). The difference between the runs is caused by the changed merger history. Even though the configurations are based on identical Plummer realisations the difference in density causes the merger history to be altered. Tidal stripping has less effect on the more compact galaxies when they move through the dark-matter halo of the primary than it has on the standard galaxy. Instead the higher density causes these galaxies to stay tightly bound resulting in interactions between other children and the core of the primary galaxy. Because of these interactions some of the child galaxies will be flung from the galaxy during the first passage instead of merging with the primary.
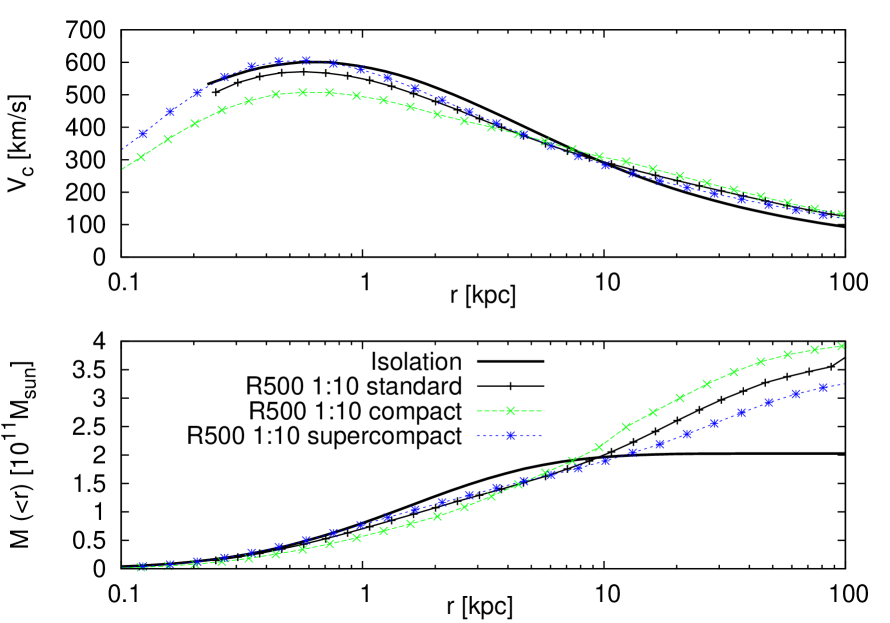
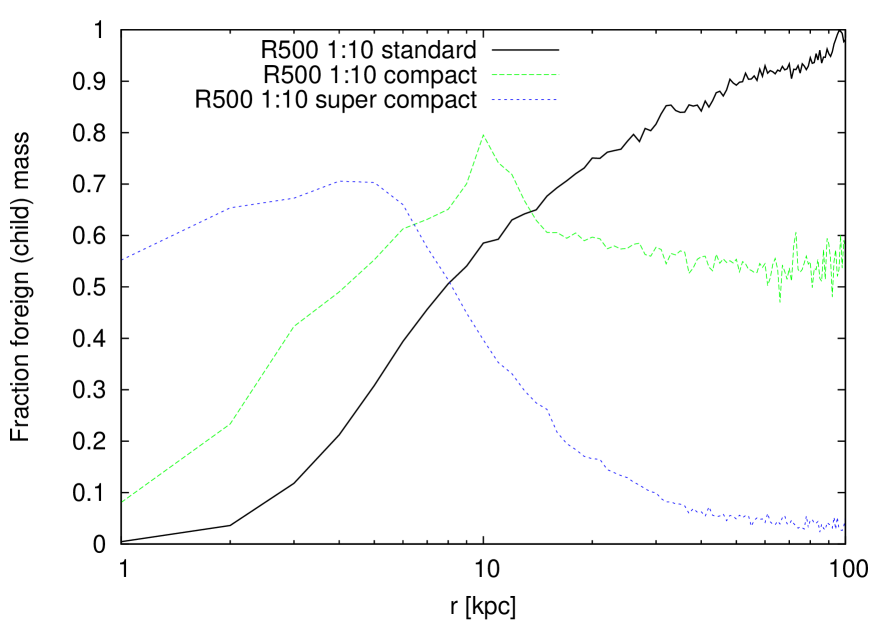
In Fig. 19 we present the distribution of accreted material throughout the merger remnant. In this figure we notice large differences between the different configurations caused by the differences in child density. The solid line represents the standard simulation where the mass is accreted on the outside of the primary (outside-in formation). For the denser children the mass is accreted closer to the core of the primary galaxy. This is the result of the less effective tidal-stripping described in the previous §. The dense child galaxies are able to progress further to the core of the merger remnant before they break up and are accreted. While the standard galaxies loose much of their material outside the core. This effect is best indicated by the supercompact configuration. In the merger remnant of this simulation most of the mass in the inner 8 kpc originates from the child galaxies. While in the other configurations most of the mass in this inner part of the merger remnant originates from the primary.
Concluding we can say that the density has no effect on the size of the merger remnant, but it does have an effect on how the remnant is build-up. With either mass being accreted on the outskirts (low density children) or in the inner parts of the merger remnant (high density children).