The helium-rich cataclysmic variable SBSS 1108+574
Abstract
We present time-resolved spectroscopy and photometry of the dwarf nova SBSS 1108+574, obtained during the 2012 outburst. Its quiescent spectrum is unusually rich in helium, showing broad, double-peaked emission lines from the accretion disc. We measure a line flux ratio He i 5875/H = 0.81 0.04, a much higher ratio than typically observed in cataclysmic variables (CVs). The outburst spectrum shows hydrogen and helium in absorption, with weak emission of H and He i 6678, as well as strong He ii emission.
From our photometry, we find the superhump period to be 56.34 0.18 minutes, in agreement with the previously published result. The spectroscopic period, derived from the radial velocities of the emission lines, is found to be 55.3 0.8 minutes, consistent with a previously identified photometric orbital period, and significantly below the normal CV period minimum. This indicates that the donor in SBSS 1108+574 is highly evolved. The superhump excess derived from our photometry implies a mass ratio of = 0.086 0.014. Our spectroscopy reveals a grazing eclipse of the large outbursting disc. As the disc is significantly larger during outburst, it is unlikely that an eclipse will be detectable in quiescence. The relatively high accretion rate implied by the detection of outbursts, together with the large mass ratio, suggests that SBSS 1108+574 is still evolving towards its period minimum.
keywords:
accretion, accretion discs – binaries: close – stars: individual: SBSS 1108+574 – novae, cataclysmic variables – white dwarfs.1 Introduction
Cataclysmic variable stars (CVs) consist of a white dwarf accreting from a Roche lobe filling main-sequence, slightly evolved, or brown dwarf companion. In systems where the white dwarf only has a weak or no magnetic field, an accretion disc forms around the white dwarf. See Warner (1995) for a detailed review.
From the start of mass transfer, CVs evolve towards shorter orbital periods, due to loss of orbital angular momentum via magnetic braking (Verbunt & Zwaan, 1981) and gravitational wave radiation (Faulkner, 1971; King, 1988). A period minimum occurs when the mass of the donor becomes too low to sustain hydrogen burning, and it is driven out of thermal equilibrium, becoming partially degenerate, and no longer shrinks in response to mass loss (Rappaport et al., 1982). As the donor continues to lose mass, the orbital period increases, and the system evolves back to longer periods, with decreasing mass transfer rates. The period minimum for normal hydrogen-rich CVs is predicted theoretically to occur at 65–70 minutes (Rappaport et al., 1982; Kolb & Baraffe, 1999), and is observed at 80 minutes (Gänsicke et al., 2009).
There are a small number of CVs and related systems that have orbital periods below this minimum, including three confirmed CVs that have evolved donors – stars that have been stripped of most of their hydrogen by mass-transfer or prior to the onset of mass-transfer (V485 Cen, Augusteijn et al. 1996; Gänsicke et al. 2003; EI Psc, Thorstensen et al. 2002; CSS100603:112253111037, Breedt et al. 2012). The majority of the known ultracompact mass-transferring binaries belong to the small class known as the AM Canum Venaticorum (AM CVn) binaries. These consist of a white dwarf accreting from a hydrogen-deficient (semi-)degenerate donor, allowing them to reach their short orbital periods (5 to 65 minutes; see Solheim 2010 for a recent review). See Breedt et al. (2012) for further discussion of the evolution and population of systems below the CV period minimum.
A subset of CVs, known as dwarf novae, shows outbursts, in which the system brightens by several magnitudes for a period of days to weeks. These outbursts are thought to be caused by thermal instabilities in the accretion disc (Meyer & Meyer-Hofmeister, 1981; Osaki, 1989), and have been the subject of considerable observational and theoretical study. Some dwarf novae show superoutbursts in addition to the normal outbursts, these last longer and are generally brighter. During a superoutburst, tidal interactions between the disc and the donor star cause the disc to become asymmetric. This results in periodic modulations in the lightcurve, known as superhumps (e.g. Whitehurst 1988). This superhump period is typically a few percent longer than the orbital period, and is related to the mass ratio of the system (e.g. Patterson et al. 2005). The origin of superhumps is discussed in detail by Wood et al. (2011).
Here we present time resolved optical spectroscopy and photometry of the helium rich CV, SBSS 1108+574 (SDSS J111126.83+571238.6). The system was identified via a survey designed to uncover AM CVn binaries in the photometric database of the Sloan Digital Sky Survey (Roelofs et al., 2009; Carter et al., 2012). Its spectrum shows unusually strong He i emission in addition to the Balmer emission lines. It was discovered in outburst on 2012 April 22 by the Catalina Real-Time Transient Survey (CRTS; Drake et al. 2009), and reported as a new SU UMa dwarf nova by Garnavich et al. (2012). Kato et al. (2012) presented photometry of the outburst, and identified a possible orbital period of 55.367 minutes, in addition to superhumps.
2 Observations
2.1 Optical spectroscopy
We obtained time-resolved spectroscopy of SBSS 1108+574 on 2012 February 28 and 2012 April 20 with the Gemini Multi-Object Spectrograph (GMOS; Hook et al. 2004) at the Gemini-North telescope on Mauna Kea, Hawaii. We used the B600+ grating with a 1 arcsec slit. GMOS has three 20484608 e2v deep depletion CCDs, which were used in six amplifier mode. The resulting spectra cover the wavelength range 4120 – 6973 Å, with an average dispersion of 1.85 Å per pixel.
The observations consist of 65 spectra in total, most of which have an exposure time of 173 seconds. The observations in February were cut short after only about one half of the binary orbit, and so are insufficient to determine the orbital period of the system. A second attempt was made to complete a 3 hour observing block on 2012 April 20, when the system was caught in an unexpected outburst (it had not been identified as a dwarf nova prior to this outburst). These spectra cover approximately three binary orbits. The log of our spectroscopic observations is given in Table 1.
| Date | UT | Exposure time (s) | Exposures |
|---|---|---|---|
| 2012 Feb 28 | 10:49–11:24 | 180 | 11 |
| 2012 Apr 20 | 06:06–08:55 | 173 | 54 |
The spectra were reduced using optimal extraction as implemented in the Pamela111Pamela is included in the Starlink distribution ‘Hawaiki’ and later releases. The Starlink Software Group homepage can be found at http://starlink.jach.hawaii.edu/starlink. code (Marsh, 1989), which also uses the Starlink packages Kappa, Figaro and Convert. Wavelength calibration was obtained from copper-argon arc lamp exposures taken at the start of the first set of spectra, and at the start, middle and end of the observations during the second block. About 10 arc lines were identified for each of the six sections of the spectra, and fitted with fourth order polynomials, resulting in root mean square residuals of approximately 0.15 Å.
The spectra were corrected for instrumental response and flux-calibrated using the standard star Feige 34, observed as part of the Gemini baseline calibration programme. The spectra are not corrected for slit losses, so the flux calibration is not absolute, however, the relative flux calibration and continuum slope are reliable.
2.2 Photometry
| MJD | |||||
|---|---|---|---|---|---|
| 52233.50 | 18.92 0.03 | 19.23 0.02 | 19.27 0.02 | 19.29 0.02 | 19.39 0.06 |
| 52704.27 | 15.91 0.01 | 15.62 0.01 | 15.82 0.01 | 16.00 0.01 | 16.17 0.02 |
| 52708.37 | 15.82 0.02 | 15.67 0.02 | 15.85 0.02 | 16.04 0.02 | 16.23 0.03 |
SBSS 1108+574222SBSS 1108+574 was assigned the CRTS ID CSS120422:111127+571239 after the outburst. was detected in outburst on 2012 April 22 by the CRTS, at a magnitude of 15.5. This is the only outburst of the system detected by CRTS during its six year coverage. It has also been observed on three occasions by the SDSS (see Table 2), indicating a previous outburst occurred on 2003 March 6, when it was detected at a -magnitude of 15.6.
Differential photometry was carried out by four observers of the Centre for Backyard Astrophysics (CBA), the observations spanning a total of 135 hours between 2012 April 23 and 2012 May 15. Details of the observers, locations and equipment are given in Table 3, and a log of our observations is given in Table 4. Unfiltered images were taken with exposure times in the range 50–120 seconds, while exposures using the filter had integration times of 120 or 240 seconds. The comparison star was either GSC 3827-0886 or GSC 3827-0824, and all data were placed onto a common magnitude scale with uncertainties no larger than 0.05 mag. Magnitudes reported here are formed from adding the magnitude of the comparison star to our differential magnitudes, and do not correspond to any standard system. Heliocentric corrections were applied to all observation times prior to analysis.
| Observer | Code | Location | Aperture (inch) |
|---|---|---|---|
| Goff | goff | California, USA | 20 |
| Koff | koff | Colorado, USA | 10 |
| Krajci | tomk | New Mexico, USA | 14 |
| de Miguel | edma | Huelva, Spain | 16 |
| HJD start | HJD end | Observer | Exposures | Filter | mean magnitude |
|---|---|---|---|---|---|
| 2456041.359 | 2456041.624 | edma | 356 | C | 16.05 |
| 2456041.627 | 2456041.853 | koff | 257 | C | 16.10 |
| 2456042.354 | 2456042.628 | edma | 368 | C | 16.21 |
| 2456042.622 | 2456042.911 | koff | 248 | C | 16.28 |
| 2456044.755 | 2456044.910 | tomk | 265 | C | 16.38 |
| 2456045.624 | 2456045.919 | koff | 298 | C | 16.44 |
| 2456046.660 | 2456046.938 | goff | 170 | C | 16.53 |
| 2456047.628 | 2456047.914 | koff | 227 | C | 16.60 |
| 2456047.660 | 2456047.958 | goff | 96 | 16.60 | |
| 2456048.411 | 2456048.461 | edma | 48 | C | 16.59 |
| 2456052.698 | 2456052.932 | goff | 150 | 16.76 | |
| 2456053.696 | 2456053.885 | tomk | 178 | C | 16.78 |
| 2456054.382 | 2456054.552 | edma | 156 | C | 16.74 |
| 2456054.670 | 2456054.921 | goff | 150 | 16.70 | |
| 2456055.362 | 2456055.464 | edma | 90 | C | 16.65 |
| 2456056.399 | 2456056.598 | edma | 90 | C | 16.77 |
| 2456056.669 | 2456056.939 | goff | 164 | 16.75 | |
| 2456057.365 | 2456057.549 | edma | 172 | C | 16.69 |
| 2456059.380 | 2456059.463 | edma | 78 | C | 16.88 |
| 2456059.669 | 2456059.928 | goff | 156 | 16.92 | |
| 2456060.669 | 2456060.922 | goff | 151 | 16.87 | |
| 2456061.702 | 2456061.916 | goff | 132 | 16.95 | |
| 2456062.360 | 2456062.546 | edma | 173 | C | 17.07 |
| 2456062.677 | 2456062.809 | goff | 84 | 17.14 | |
| 2456062.658 | 2456062.860 | koff | 155 | C | 17.17 |
| 2456063.371 | 2456063.480 | edma | 102 | C | 17.15 |
3 Results
3.1 Average spectral features
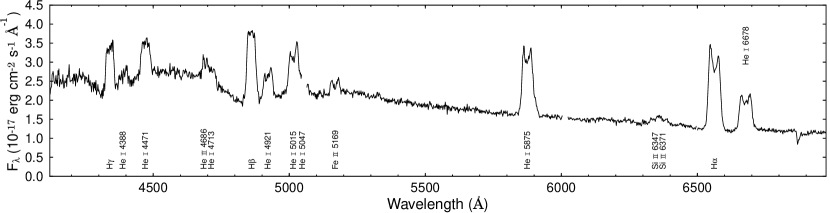
The average quiescent spectrum of SBSS 1108+574 is shown in Fig. 1. It shows a blue continuum with strong broad emission lines of both hydrogen and helium. The helium lines are unusually strong, similarly to those seen in CSS11221110 (Breedt et al., 2012), distinguishing SBSS 1108+574 from other dwarf novae. Fig. 6 in Carter et al. (2012) shows the H and He i 5875 equivalent widths of this system in relation to the normal CV population. It is also worth noting the similarity between the colour of SBSS 1108+574 and the AM CVn binaries, see fig. 11 in Carter et al. (2012).
The He i lines and H all show signs of being triple-peaked, exhibiting a central emission component in addition to the classic double-peaked emission from the accretion disc. A weak ’central spike’ is a phenomenon almost never seen in CVs, but it is seen in the similar system CSS11221110. This central emission component has a low radial velocity amplitude, and is identified as originating on or close to the surface of the accreting white dwarf (Marsh, 1999; Morales-Rueda et al., 2003). It is likely that the appearance of this feature in the average spectrum (Fig. 1) is due to the contribution of the bright spot, which does not completely average out due to incomplete coverage of the binary orbit.
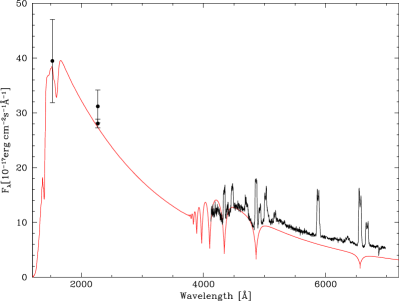
The quiescent Gemini spectrum of SBSS 1108+574 shows broad depressions near 4340 Å and 4870 Å that we identify as H and H absorption lines from the white dwarf photosphere. These absorption profiles are substantially perturbed by the Balmer and He emission lines, preventing a meaningful estimate of the white dwarf atmospheric properties from the optical data alone. GALEX has detected SBSS 1108+574 during its All-Sky Imaging Survey (AIS) in the far-ultraviolet (FUV) and near-ultraviolet (NUV) channel, and again as part of the Medium Imaging Survey (MIS) using the NUV channel only, see Table 5.
| Date | Survey | FUV flux (Jy) | NUV flux (Jy) |
|---|---|---|---|
| 2004 Jan 25 | AIS | ||
| 2005 Jan 25 | MIS |
We modelled the Gemini spectrum (correcting the absolute flux to , measured in quiescence by SDSS) along with the GALEX broad-band fluxes using pure-hydrogen white dwarf atmosphere models from Koester (2010). For an adopted white dwarf mass of we find a temperature of K, and a distance of pc (Fig. 2). Allowing for in the white dwarf mass adds another K in the uncertainty of the temperature.
The vast majority of short-period CVs are relatively old systems with typical ages of several Gyr (e.g. Kolb et al. 1998; Schreiber & Gänsicke 2003; Knigge et al. 2011). The cooling ages implied by their white dwarf primaries are generally much shorter – in the case of SBSS 1108+574, the effective temperature corresponds to yr only. The solution to this conundrum is that the white dwarfs are (re-)heated by accretion. Short-term fluctuations of the mass transfer rate, such as dwarf nova outbursts, affect only their outer envelope of a white dwarf, and the effective temperature responds on time scales of weeks to years (e.g. Gänsicke & Beuermann 1996; Sion et al. 1998; Slevinsky et al. 1999). In contrast, the effective temperature determined sufficiently long after a dwarf nova outburst reflects the secular mean of the accretion rate over yr (for low systems, Townsley & Bildsten 2003; Townsley & Gänsicke 2009). Adopting a white dwarf mass of (), we estimate ().
In addition to the hydrogen and helium lines, Fe ii emission at 5169 Å, and Si emission at 6347 Å and 6371 Å are identified.
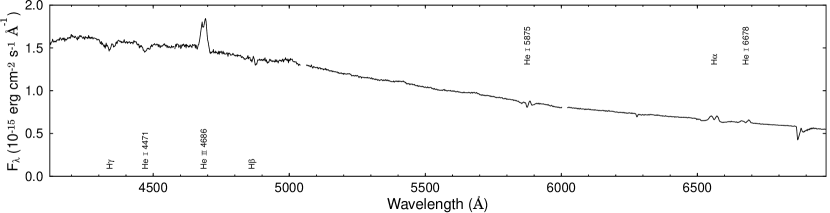
The average outburst spectrum is shown in Fig. 3. It shows a bluer continuum than the quiescent spectrum, and both helium and hydrogen in absorption, a common feature in outbursting dwarf novae due to the bright, optically thick disc. It also shows He ii 4686, H and He i 6678 in emission, with the classic double-peaked profile caused by the accretion disc.
Table 6 shows the reduction in equivalent widths of the prominent lines between quiescence and outburst. The ratio of the equivalent widths of H to He i 5875 is approximately 3 times smaller than typically found in CVs (Carter et al., 2012). From the quiescent spectrum we calculate a line flux ratio He i 5875/H = 0.81 0.04, a much higher ratio than normally observed in cataclysmic variables, where it is typically 0.2 – 0.4 (e.g. Williams & Ferguson 1982; Thorstensen & Taylor 2001; Breedt et al. 2012).
| Line | Quiescent | Outburst 22footnotetext: Values marked ’…’ could not be measured reliably. | ||
| EW (Å) | FWHM (km s-1) | EW (Å) | FWHM (km s-1) | |
| H | 17.4 2.0 | 2100 50 | 3.7 0.3 | 3500 100 |
| He i 4471 | 12.9 1.5 | 2200 50 | 1.5 0.2 | 2000 100 |
| He ii 4686 | 13.7 1.5333Blended with He i 4713. | 3300 200 | 6.9 0.1 | 1600 50 |
| H | 32.0 2.0 | 1900 50 | 1.6 0.3 | 4400 300 |
| He i 4921 | 11.0 1.5 | 1900 100 | … | … |
| He i 5015444The red wing falls in the gap between the CCDs, and may be blended with He i 5047. | 18.8 0.5 | 2400 100 | … | … |
| He i 5875 | 49.0 1.0 | 2100 50 | 1.3 0.5 | 2300 100 |
| H | 84.0 3.0 | 1950 50 | 5.0 1.0 | 1700 50 |
| He i 6678 | 35.5 1.4 | 2000 100 | 1.3 0.5 | 1800 200 |
3.2 Photometric periods
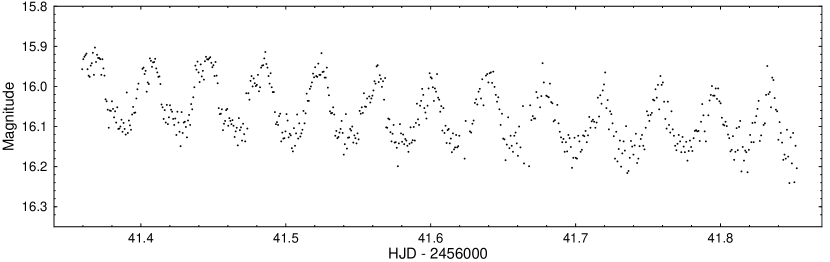
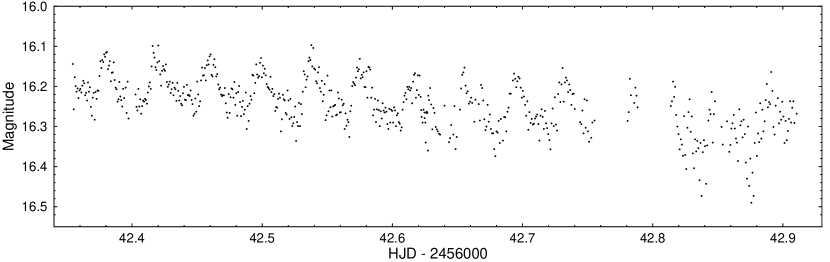
Nightly lightcurves for April 23 and April 24 are shown in Fig. 4. A periodic signal of amplitude 80 mmag is clearly seen during the first two nights.
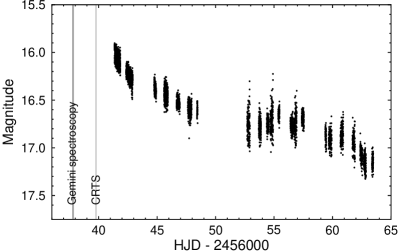
The full lightcurve of our observations is shown in Fig. 5. The system fades at a nearly constant rate of 0.10 mag d-1 over the first week. This is followed by a period of 6 – 10 days over which the mean magnitude remains essentially constant; afterwards, the system resumes its way to its low state. Oscillations were observed in all nightly light curves, although they tended to become less well-defined as the system turned fainter and the signal-to-noise ratio decreased. The amplitude was not seen to change appreciably.
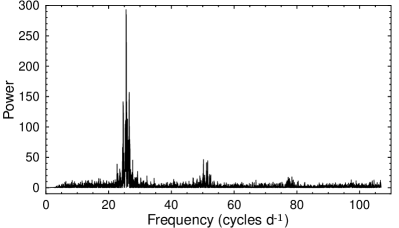
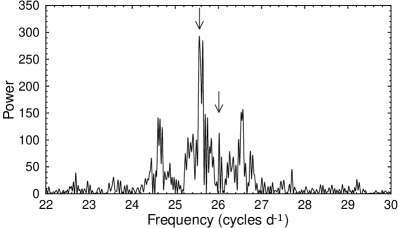
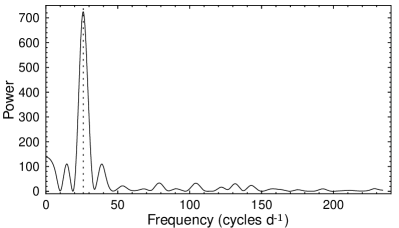
The Lomb-Scargle periodogram of the whole data set is shown in Fig. 6. We first removed any obvious trend in the nightly light curves and subtracted the nightly mean magnitude. The frequency of the fundamental signal is found at 25.56 cycles d-1, corresponding to a period of 56.34 minutes. The presence of a close peak at 25.64 cycles d-1 with nearly the same power is an indication of variations in the periodicity of the fundamental signal during the time spanned by our observations. As the superhump signal is not totally periodic, the power spreads out, resulting in the second peak. This period instability is typical of superhumps and rules out a possible orbital nature of the fundamental signal. The 1 cycle d-1 aliases are also clear in Fig. 6.
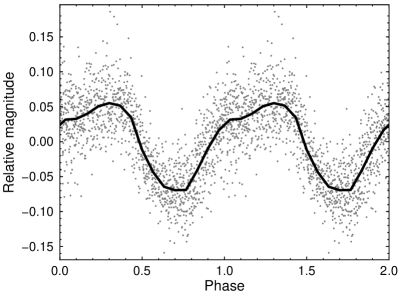
An analysis of our data confirms the variation in the period over the time spanned by our observations. This period instability has a significant impact on the accuracy with which we can determine the superhump period, we therefore take the strongest peak in the periodogram as our superhump period, and use the separation of the two strong peaks as an estimate of the uncertainty on this period, 56.34 0.18 minutes. This estimated uncertainty is consistent with the variation revealed by the analysis. The phase-folded lightcurve constructed from the first two nights of observations is shown in Fig. 7.
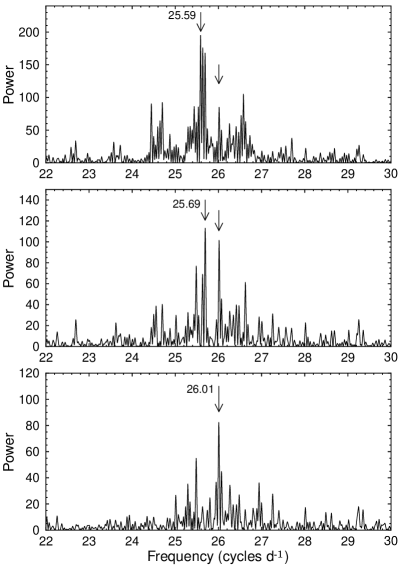
There is an additional peak centred at 26.01 cycles d-1 which seems to bear no relation with the time windowing of our observations. This is identified as corresponding to the underlying orbital motion, giving a period of 55.36 0.03 minutes, and confirming the findings of Kato et al. (2012). This signal remains after prewhitening the light curve with the main frequency at 25.56 cycles d-1, and is the strongest signal remaining after sequentially prewhitening the residual light curve with two further strong frequencies (25.59 and 25.69 cycles d-1) associated with the superhumps (see Fig. 8). We also find relatively strong signals corresponding to the third and fourth harmonics of this frequency. The strength of these peaks would not be unexpected given the sharp dip that would be caused by a possible eclipse of the disc (see section 3.6). This supports the identification of this frequency as corresponding to the orbital period.
3.3 The spectroscopic period
To find the spectroscopic period we measured the radial velocity variation of the emission lines using the single Gaussian technique of Schneider & Young (1980), as implemented in Molly555Molly was written by T. R. Marsh and is available from http://www.warwick.ac.uk/go/trmarsh/software.. We varied the full width half maximum of this Gaussian from 200 to 3000 km s-1. For each resulting radial velocity curve we calculated the Lomb-Scargle periodogram (Scargle, 1982), and fit the radial velocities with a circular orbit of the form
| (1) |
where is derived from the strongest peak in the periodogram.
Examining the results, we determine that the errors are smallest for a FWHM of 2200 km s-1 for the He ii 4686 line. We use such a wide Gaussian as this gives an average of the velocity over the entire line, minimising the errors introduced by the unusual structure of the lines from the outbursting disc. We show the Lomb-Scargle periodogram calculated from the He ii radial velocities in Fig. 9. A clear signal is seen at 26.03 cycle d-1, corresponding to a period of 55.3 minutes.
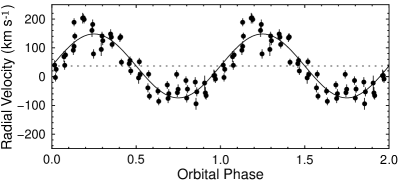
The He ii 4686 radial velocity curve, folded on this period, is shown in Fig. 10. The parameters of the fits to Equation 1, derived from the radial velocity measurements, are shown in Table 7. We take the zero phase, HJD0, as being defined by the blue to red crossing of the velocities.
| (min) | HJD0 | (km s-1) | (km s-1) |
|---|---|---|---|
| 55.3 0.8 | 2456037.7551(4) | 111 7 | 37.1 5.0 |
There is considerable scatter around the radial velocity curve shown in Fig. 10, which is likely caused by the unusual line structure during the outburst (see Fig. 11). Calculating the radial velocities from the line wings using two narrower Gaussians gives similar results, but the effect of the unusual structure causes greater scatter in the radial velocities, and greater errors, and so we prefer the single Gaussian method.
The uncertainty on the period was estimated by carrying out 10 000 bootstrap selections of the radial velocity curve. For each subset, 54 radial velocities were selected from the full radial velocity curve, allowing for points to be selected more than once, and the periodogram calculated, taking the strongest peak as the period. The standard deviation of these computed periods, ignoring those that correspond to higher harmonics, is taken as a measure of the uncertainty in the derived orbital period.
3.4 Mass ratio
Superhumps are caused by a resonant interaction between the accretion disc and the donor star, that causes the disc to become asymmetric. The increased viscous dissipation caused by this interaction between the donor and the distorted disc, leads to the brightness variations observed during dwarf nova superoutbursts. The observed superhump period is the beat period between the orbital period of the system and the precession period of the deformed disc (Whitehurst, 1988).
As the superhump phenomenon is due to resonance, and the precession rate for resonant orbits depends on the mass ratio of the system, there is a strong link between the superhump period and the mass ratio. The superhump period-excess,
| (2) |
is found to increase with increasing mass ratio, . An empirical relation is derived from eclipsing dwarf novae, in which the mass ratio and superhump excess can be measured independently (Patterson et al., 2005; Knigge, 2006; Kato et al., 2009).
Of the three alternative – relations, the Patterson et al. (2005) form,
| (3) |
and the Kato et al. (2009) form, both assume when . This is a reasonable assumption as we would expect a secondary with negligible mass to have a negligible tidal interaction with the disc. The third version of the relation, given by Knigge (2006), does not use this assumption. The Patterson et al. (2005) formulation is usually favoured for AM CVn binaries (Breedt et al., 2012), as observations of the only known eclipsing system, SDSS J0926+3624 agree best with this form (Copperwheat et al., 2011), and so we use that version here.
The total time covered by our spectroscopic observations is not sufficiently long to reach the accuracy of the photometric periods, and so we take the weak additional signal in Fig. 6 as the orbital period. As the superhump period varies during our observations, we conservatively take the separation of the two strongest peaks in Fig. 6 as a measure of the uncertainty on the superhump period for calculation of the excess. This gives the superhump excess in SBSS 1108+574, = 0.0176 0.0032, and the mass ratio, = 0.086 0.014. We note that this is very large compared to the mass ratio found for CSS11221110, = 0.017 (Breedt et al., 2012), despite the similar orbital periods.
Our larger estimate for the superhump excess is consistent with the value found by Kato et al. (2012) for their stage B superhumps, = 0.0174 0.0002. Using the smaller excess they measured for their stage C superhumps, and the Kato et al. (2009) form of the – relation, they derive a mass ratio = 0.06. We note that the values we derive for using the Patterson et al. (2005) form of the – relation, are consistent with the values calculated using the Knigge (2006) form. For our data the Kato et al. (2009) formulation gives a larger value of , however, this relation is calibrated using the shorter superhump periods that occur late in the superoutburst, and so likely overestimates for our longer periods from earlier in the superoutburst.
3.5 Dynamic spectrum
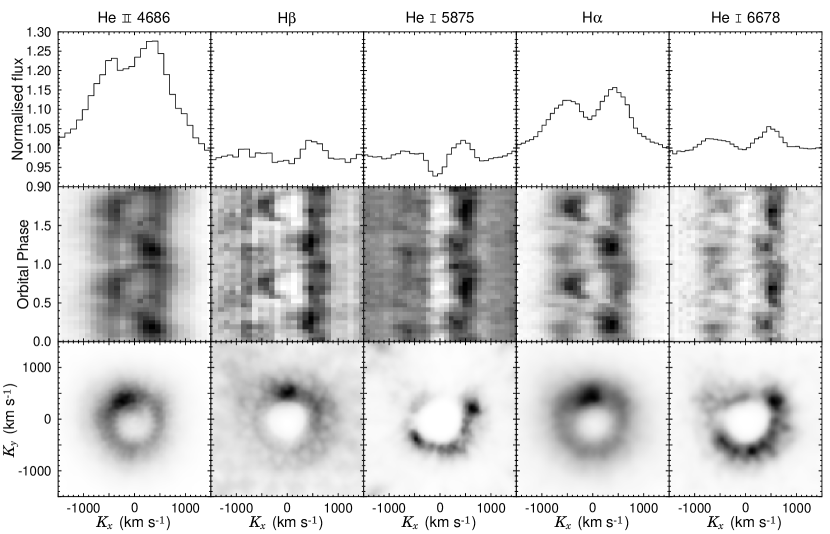
The line profiles and trailed spectra for the strongest lines, folded on the orbital period, 55.3 minutes (26.03 cycles d-1), are shown in Fig. 11. It is clear that there is greater flux in the redshifted line peak than the blueshifted peak; this unexplained asymmetry is often seen in the spectra of outbursting CVs. We also note the presence of underlying absorption due to the optically thick outbursting disc, this is particularly noticeable in the He i 5875 line, and makes the S-wave difficult to discern when it crosses the line centres.
An S-wave is clear in the strongest line, He ii 4686, but becomes weaker with decreasing line strength. The presence of this S-wave can be seen in the other lines shown in Fig. 11, however, the He i lines appear to show a brighter varying signal with higher velocities than the S-wave, that is almost in anti-phase. A second varying signal is also seen in the H trailed spectrum. This feature is likely responsible for the strength of the second harmonic in the periodograms of these lines. There is no coherent S-wave visible in the trailed spectra when folded on these second harmonic frequencies; thus we are confident that we have identified the correct period of this system.
The corresponding Doppler tomograms (Marsh & Horne, 1988) give a similar picture of emission in the disc. A bright spot is clearly visible in the maps for He ii 4686, H and H. The bright spot is not usually seen in CVs during outburst, as the bright outbursting disc normally outshines it. Since these were calculated using the same zero phase for all lines, assumed from the He ii 4686 radial velocities, HJD0 = 2456037.7551, the maps may be rotated due to the unknown phase shift between our zero phase and the true zero phase of the white dwarf. Note that the bright spot appears at slightly different phases in each line. The extended bright spot seen in H, overlaps in phase with the bright spots seen in both He ii 4686 and H. Some evidence of the bright spot may also be seen in the Doppler maps of the He i lines, however, they are dominated by the brighter varying signal causing the band of increased emission in the right-hand quadrants.
We note that we do not detect the presence of spiral arms in our data. Spiral arms have been observed in a number of dwarf novae during outburst (e.g. Steeghs 2001; Baba et al. 2002), and are thought to be caused by the tidal affect of the donor on the large disc. As our observations may correspond to an early point in the evolution of the outburst, it is possible that spiral arms develop later in the outburst.
The H line profile reveals a strong feature in the high velocity wing of the blueshifted peak, centred at about 800 km s-1. The redshifted peak also extends beyond the range of the bright spot visible in the trailed spectrum. The origin of this feature is unclear, and it appears in the Doppler map as a ring of emission at higher velocity than most of the disc emission.
We detect no rotation between Doppler maps created using only the first and only the third orbit, further verifying our identification of the orbital period.
We plot the Roche lobes and stream velocities for a = 0.086 binary together with the He ii 4686 Doppler map in Fig. 12.
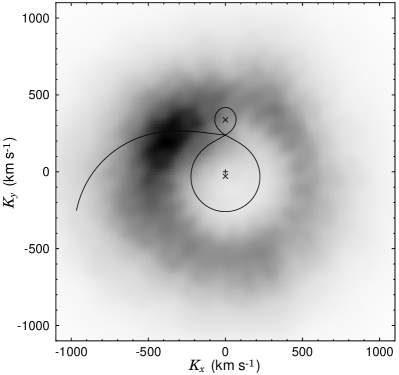
The velocity positions of the accretor, donor and centre of mass are also shown. Again, the map may be rotated about its origin due to the unknown phase shift between our assumed zero phase and the true zero phase.
3.6 Grazing eclipse
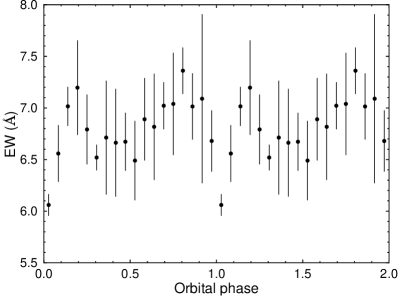
The trailed spectra (Fig. 11) show a slight reduction in the line flux at a phase of 1. To examine this further we construct a lightcurve of the He ii 4686 EW, shown in Fig. 13. This reveals a clear dip, which we attribute to an eclipse of the outer disc.
This allows us to constrain the inclination of the system, as it must be large enough that the outer edge of the disc can be eclipsed. Since there is no eclipse of the inner disc or the accretor, we can also place an upper limit on its value. Using our derived value for , the Eggleton (1983) formula for the Roche lobe radius of the secondary, and the approximate tidal limit for the maximum radius of the accretion disc (e.g. Warner 1995), we find .
The outbursting disc is expected to be larger than the quiescent disc, significantly increasing the likelihood of a grazing eclipse during outburst. It is therefore likely that there will be no eclipse detectable in quiescence.
4 Discussion
The strength of the helium emission lines compared to the hydrogen lines in the average spectrum (Fig. 1 and Table 6), highlights the unusual nature of this system. Whilst a detailed abundance analysis cannot be carried out with our current data, this is a strong indication of a much greater helium abundance than normally seen in CVs. Models of accretion discs and donors in CVs and AM CVns indicate that very little hydrogen is required to excite strong Balmer lines (Williams & Ferguson, 1982; Marsh et al., 1991; Nagel et al., 2009; Nelemans et al., 2010), and the hydrogen abundance in SBSS 1108+574 may be significantly lower than 10 per cent.
Our derived period, 55.3 0.8 minutes (26.03 0.38 cycles d-1), is well below the CV period minimum, clearly indicating that the donor is significantly evolved, having been stripped of most of its hydrogen by mass-transfer or prior to the onset of mass-transfer. Our spectroscopic period favours the weak 55.36 minute (26.01 0.01 cycles d-1) signal detected from the photometry and identified as the orbital period, over the 56.34 minute (25.56 cycles d-1) signal identified as the superhump period. We are therefore confident that the candidate orbital period signal detected in our photometry and by Kato et al. (2012), is the correct orbital period. This confirms SBSS 1108+574 as one of the shortest period CVs known, and places it well within the AM CVn period range.
There are three proposed formation channels for the AM CVn binaries, defined by the type of donor. The donor can be (1) a second, lower mass white dwarf (Paczyński, 1967; Faulkner et al., 1972), (2) a semi-degenerate helium star (Savonije et al., 1986; Iben & Tutukov, 1987), or (3) an evolved main-sequence star that has lost most of its hydrogen envelope. The latter is thought to form via the ‘evolved CV’ channel (Thorstensen et al., 2002; Podsiadlowski et al., 2003), but this formation channel has generally been considered to be unimportant in comparison to the double white dwarf and helium star channels. Podsiadlowski et al. (2003), however, argue that the evolved CV channel could contribute a significant fraction of the total AM CVn binary population. SBSS 1108+574 has all the characteristics of an AM CVn progenitor in the evolved CV formation channel.
It must be noted that not all CVs with evolved donors reaching periods below the normal period minimum, will form AM CVn binaries as they are currently recognised (Yungelson et al., in preparation). Many systems will in fact reach their own period ‘bounce’, and evolve back towards longer orbital periods, without depleting their hydrogen sufficiently to appear as AM CVn binaries. Current models suggest that the fraction of evolved CV channel AM CVn binaries may be lower than previously predicted (Podsiadlowski et al. 2003; Yungelson et al., in preparation). It is clear, however, that systems like SBSS 1108+574 and CSS11221110 (Breedt et al., 2012) fall between the standard definitions of AM CVn binaries and CVs.
The large mass ratio we derive, = 0.086 0.014, indicates a different evolution to the standard AM CVn binary population; for GP Com (Porb = 46.6 minutes; Marsh 1999), = 0.018 (Roelofs et al., 2007), and for V396 Hya (Porb = 65.1 minutes; Ruiz et al. 2001), =0.013 (Steeghs, 2010). The fact that the system shows outbursts indicates that the mass transfer rate is still relatively high, which is not expected for AM CVn binaries that have passed and evolved back to long periods (e.g. Nelemans 2005; Kotko et al. 2012). Compare our estimated accretion rate, (for a accretor), to the value Roelofs et al. (2007) derived for GP Com, , and the value Nagel et al. (2009) estimated for V396 Hya, , again presenting a strong contrast between SBSS 1108+574 and the long period AM CVn binaries. This indicates that SBSS 1108+574 is still evolving towards shorter orbital periods, becoming increasingly helium-rich.
5 Conclusion
We have presented time resolved spectroscopy of the helium-rich dwarf nova SBSS 1108+574 (SDSS J1111+5712), confirming the period detected photometrically during the 2012 April outburst. The system shows unusually strong helium emission in both outburst and quiescence, suggesting a high helium abundance. We measure the superhump period from our photometry as 56.34 0.18 minutes, consistent with the result of Kato et al. (2012). The spectroscopic period is found to be 55.3 0.8 minutes, significantly below the normal period minimum (80 minutes), confirming the system as an ultra-compact CV containing a highly evolved donor. The relatively high accretion rate, together with the large mass ratio, suggests that SBSS 1108+574 is still evolving towards its period minimum.
Acknowledgements
We thank the anonymous referee for useful comments and suggestions. PJC acknowledges the support of a Science and Technology Facilities Council (STFC) studentship. DS, TRM, BTG and EB acknowledge support from the STFC grant no. ST/F002599/1. T. Kupfer acknowledges support by the Netherlands Research School for Astronomy (NOVA). GHAR acknowledges an NWO-Rubicon grant. GN acknowledges an NWO-VIDI grant.
Based on observations obtained under programme GN-2012A-Q-54 at the Gemini Observatory, which is operated by the Association of Universities for Research in Astronomy, Inc., under a cooperative agreement with the NSF on behalf of the Gemini partnership: the National Science Foundation (United States), the Science and Technology Facilities Council (United Kingdom), the National Research Council (Canada), CONICYT (Chile), the Australian Research Council (Australia), Ministério da Ciência, Tecnologia e Inovação (Brazil) and Ministerio de Ciencia, Tecnología e Innovación Productiva (Argentina).
Funding for the SDSS and SDSS-II has been provided by the Alfred P. Sloan Foundation, the Participating Institutions, the National Science Foundation, the U.S. Department of Energy, the National Aeronautics and Space Administration, the Japanese Monbukagakusho, the Max Planck Society, and the Higher Education Funding Council for England. The SDSS Web Site is http://www.sdss.org/.
Balmer/Lyman lines in the models were calculated with the modified Stark broadening profiles of Tremblay & Bergeron, ApJ 696, 1755, 2009, kindly made available by the authors.
References
- Augusteijn et al. (1996) Augusteijn, T., van der Hooft, F., de Jong, J. A., van Paradijs, J., 1996, A&A, 311, 889
- Baba et al. (2002) Baba, H., et al., 2002, PASJ, 54, L7
- Breedt et al. (2012) Breedt, E., Gänsicke, B. T., Marsh, T. R., Steeghs, D., Drake, A. J., Copperwheat, C. M., 2012, MNRAS, 425, 2548
- Carter et al. (2012) Carter, P. J., et al., 2012, MNRAS, in press, (arXiv:astro-ph/1211.6439)
- Copperwheat et al. (2011) Copperwheat, C. M., et al., 2011, MNRAS, 410, 1113
- Drake et al. (2009) Drake, A. J., et al., 2009, ApJ, 696, 870
- Eggleton (1983) Eggleton, P. P., 1983, ApJ, 268, 368
- Faulkner (1971) Faulkner, J., 1971, ApJ, 170, L99
- Faulkner et al. (1972) Faulkner, J., Flannery, B. P., Warner, B., 1972, ApJ, 175, L79+
- Gänsicke & Beuermann (1996) Gänsicke, B. T., Beuermann, K., 1996, A&A, 309, L47
- Gänsicke et al. (2003) Gänsicke, B. T., et al., 2003, ApJ, 594, 443
- Gänsicke et al. (2009) Gänsicke, B. T., et al., 2009, MNRAS, 397, 2170
- Garnavich et al. (2012) Garnavich, P., Littlefield, C., Marion, G. H., Irwin, J., Kirshner, R. P., Vinko, J., 2012, The Astronomer’s Telegram, 4112, 1
- Hook et al. (2004) Hook, I. M., Jørgensen, I., Allington-Smith, J. R., Davies, R. L., Metcalfe, N., Murowinski, R. G., Crampton, D., 2004, PASP, 116, 425
- Iben & Tutukov (1987) Iben, Jr., I., Tutukov, A. V., 1987, ApJ, 313, 727
- Kato et al. (2009) Kato, T., et al., 2009, PASJ, 61, 395
- Kato et al. (2012) Kato, T., et al., 2012, PASJ, in press, (arXiv:astro-ph/1210.0678)
- King (1988) King, A. R., 1988, QJRAS, 29, 1
- Knigge (2006) Knigge, C., 2006, MNRAS, 373, 484
- Knigge et al. (2011) Knigge, C., Baraffe, I., Patterson, J., 2011, ApJS, 194, 28
- Koester (2010) Koester, D., 2010, Mem. Soc. Astron. Italiana, 81, 921
- Kolb & Baraffe (1999) Kolb, U., Baraffe, I., 1999, MNRAS, 309, 1034
- Kolb et al. (1998) Kolb, U., King, A. R., Ritter, H., 1998, MNRAS, 298, L29
- Kotko et al. (2012) Kotko, I., Lasota, J.-P., Dubus, G., Hameury, J.-M., 2012, A&A, 544, A13
- Marsh (1989) Marsh, T. R., 1989, PASP, 101, 1032
- Marsh (1999) Marsh, T. R., 1999, MNRAS, 304, 443
- Marsh & Horne (1988) Marsh, T. R., Horne, K., 1988, MNRAS, 235, 269
- Marsh et al. (1991) Marsh, T. R., Horne, K., Rosen, S., 1991, ApJ, 366, 535
- Meyer & Meyer-Hofmeister (1981) Meyer, F., Meyer-Hofmeister, E., 1981, A&A, 104, L10
- Morales-Rueda et al. (2003) Morales-Rueda, L., Marsh, T. R., Steeghs, D., Unda-Sanzana, E., Wood, J. H., North, R. C., 2003, A&A, 405, 249
- Nagel et al. (2009) Nagel, T., Rauch, T., Werner, K., 2009, A&A, 499, 773
- Nelemans (2005) Nelemans, G., 2005, in Hameury, J.-M., Lasota, J.-P., eds., The Astrophysics of Cataclysmic Variables and Related Objects, vol. 330 of Astronomical Society of the Pacific Conference Series, p. 27
- Nelemans et al. (2010) Nelemans, G., Yungelson, L. R., van der Sluys, M. V., Tout, C. A., 2010, MNRAS, 401, 1347
- Osaki (1989) Osaki, Y., 1989, PASJ, 41, 1005
- Paczyński (1967) Paczyński, B., 1967, Acta Astron., 17, 287
- Patterson et al. (2005) Patterson, J., et al., 2005, PASP, 117, 1204
- Podsiadlowski et al. (2003) Podsiadlowski, P., Han, Z., Rappaport, S., 2003, MNRAS, 340, 1214
- Rappaport et al. (1982) Rappaport, S., Joss, P. C., Webbink, R. F., 1982, ApJ, 254, 616
- Roelofs et al. (2007) Roelofs, G. H. A., Groot, P. J., Benedict, G. F., McArthur, B. E., Steeghs, D., Morales-Rueda, L., Marsh, T. R., Nelemans, G., 2007, ApJ, 666, 1174
- Roelofs et al. (2009) Roelofs, G. H. A., et al., 2009, MNRAS, 394, 367
- Ruiz et al. (2001) Ruiz, M. T., Rojo, P. M., Garay, G., Maza, J., 2001, ApJ, 552, 679
- Savonije et al. (1986) Savonije, G. J., de Kool, M., van den Heuvel, E. P. J., 1986, A&A, 155, 51
- Scargle (1982) Scargle, J. D., 1982, ApJ, 263, 835
- Schneider & Young (1980) Schneider, D. P., Young, P., 1980, ApJ, 238, 946
- Schreiber & Gänsicke (2003) Schreiber, M. R., Gänsicke, B. T., 2003, A&A, 406, 305
- Sion et al. (1998) Sion, E. M., Cheng, F. H., Szkody, P., Sparks, W., Gänsicke, B., Huang, M., Mattei, J., 1998, ApJ, 496, 449
- Slevinsky et al. (1999) Slevinsky, R. J., Stys, D., West, S., Sion, E. M., Cheng, F. H., 1999, PASP, 111, 1292
- Solheim (2010) Solheim, J., 2010, PASP, 122, 1133
- Steeghs (2001) Steeghs, D., 2001, in Boffin, H. M. J., Steeghs, D., Cuypers, J., eds., Astrotomography, Indirect Imaging Methods in Observational Astronomy, vol. 573 of Lecture Notes in Physics, Berlin Springer Verlag, p. 45
- Steeghs (2010) Steeghs, D., 2010, in Proceedings of High Time Resolution Astrophysics - The Era of Extremely Large Telescopes (HTRA-IV). May 5 - 7, 2010. Agios Nikolaos, Crete Greece.
- Thorstensen & Taylor (2001) Thorstensen, J. R., Taylor, C. J., 2001, MNRAS, 326, 1235
- Thorstensen et al. (2002) Thorstensen, J. R., Fenton, W. H., Patterson, J. O., Kemp, J., Krajci, T., Baraffe, I., 2002, ApJ, 567, L49
- Townsley & Bildsten (2003) Townsley, D. M., Bildsten, L., 2003, ApJ, 596, L227
- Townsley & Gänsicke (2009) Townsley, D. M., Gänsicke, B. T., 2009, ApJ, 693, 1007
- Verbunt & Zwaan (1981) Verbunt, F., Zwaan, C., 1981, A&A, 100, L7
- Warner (1995) Warner, B., 1995, Cambridge Astrophysics Series, 28
- Whitehurst (1988) Whitehurst, R., 1988, MNRAS, 232, 35
- Williams & Ferguson (1982) Williams, R. E., Ferguson, D. H., 1982, ApJ, 257, 672
- Wood et al. (2011) Wood, M. A., Still, M. D., Howell, S. B., Cannizzo, J. K., Smale, A. P., 2011, ApJ, 741, 105