mgaultois@mrl.ucsb.edu
Structural disorder, magnetism, and electrical and thermoelectric properties of pyrochlore Nd2Ru2O7
Abstract
Polycrystalline Nd2Ru2O7 samples have been prepared and examined using a combination of structural, magnetic, and electrical and thermal transport studies. Analysis of synchrotron X-ray and neutron diffraction patterns suggests some site disorder on the A-site in the pyrochlore sublattice: Ru substitutes on the Nd-site up to 7.0(3)%, regardless of the different preparative conditions explored. Intrinsic magnetic and electrical transport properties have been measured. Ru 4d spins order antiferromagnetically at 143 K as seen both in susceptibility and specific heat, and there is a corresponding change in the electrical resistivity behaviour. A second antiferromagnetic ordering transition seen below 10 K is attributed to ordering of Nd 4f spins. Nd2Ru2O7 is an electrical insulator, and this behaviour is believed to be independent of the Ru-antisite disorder on the Nd site. The electrical properties of Nd2Ru2O7 are presented in the light of data published on all Ru2O7 pyrochlores, and we emphasize the special structural role that Bi3+ ions on the A-site play in driving metallic behaviour. High-temperature thermoelectric properties have also been measured. When considered in the context of known thermoelectric materials with useful figures-of-merit, it is clear that Nd2Ru2O7 has excessively high electrical resistivity which prevents it from being an effective thermoelectric. A method for screening candidate thermoelectrics is suggested.
pacs:
75.47.Lx 75.50.Ee 75.50.Lk 72.20.Pa1 Introduction
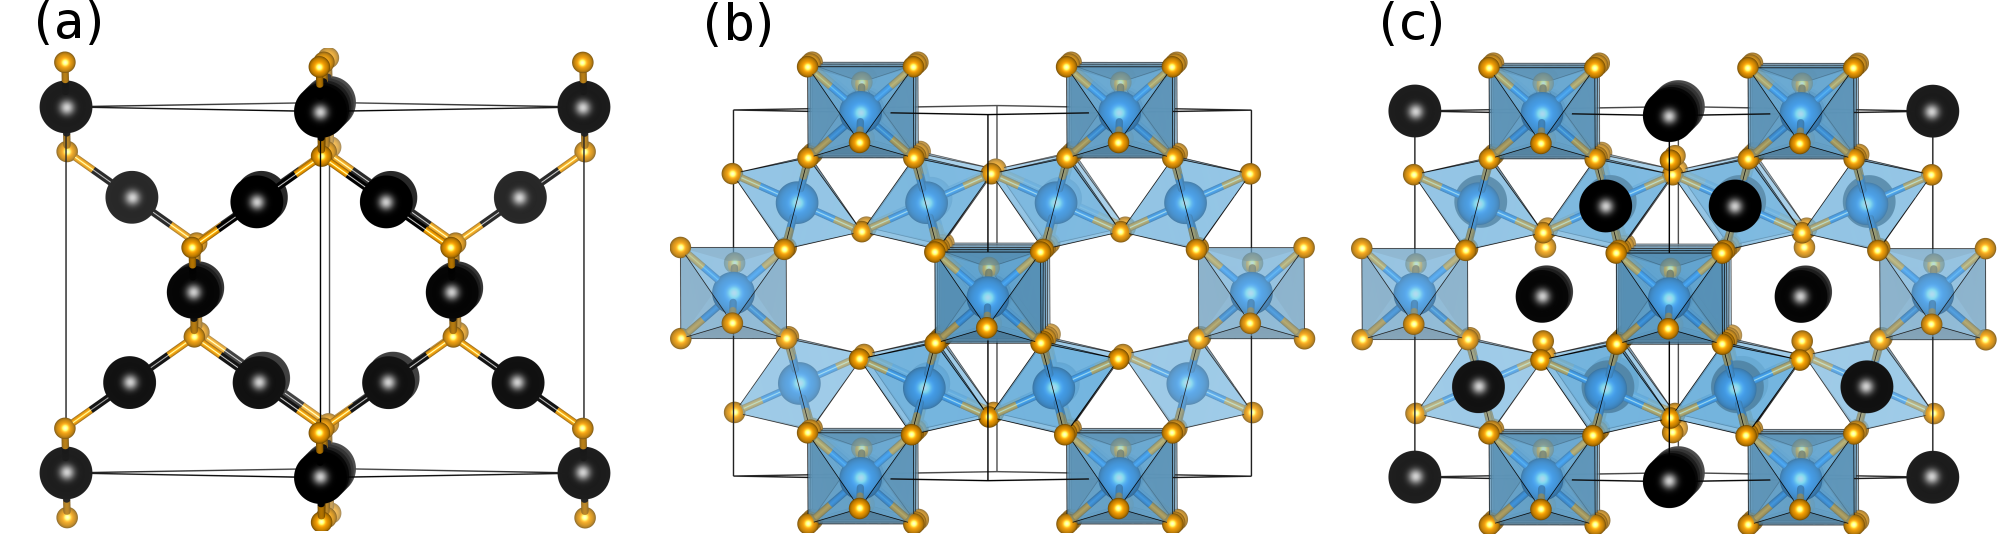
The O6O′ pyrochlore structure, shown in figure 1, comprises two interpenetrating O6 and O′ sublattices [1]. The electrical properties of pyrochlore ruthenium oxides (Ru2O7, A= Pr through Lu, Y, and Bi) are of long-standing interest. In Ru2O7 ruthenates, electrical conductivity is expected to take place through the Ru2O6 network of RuO6 octahedra, ie. the O6 sublattice. While all the rare-earth members are insulating, Bi2Ru2O7 is metallic. Several investigators have sought to explain the difference in conductivity by examining changes in Ru–O–Ru bond angle — determined by the combination of Ru–O bond length and the size of A — and consequent changes in orbital overlap and bandwidth [2, 3]. Electron spectroscopic investigations of Y2Ru2O7 compared with Bi2Ru2O7 led Cox et al.[4] to conclude that the principle difference seen is the participation in conduction of Bi 6s states in Bi2Ru2O7. This participation broadens the Ru 4d band width sufficiently that a metallic ground state is preferred over one that is correlated and insulating. However, Shoemaker et al.[5] contrasted the computed electronic structures of insulating Bi2Ti2O7 with that of conducting Bi2Ru2O7 and found no difference in the presence or absence of Bi 6s states near the Fermi energy in these two compounds.
Pyrochlore-type rare-earth ruthenium oxides are also of great interest for their magnetic properties. The sub-lattices of corner-connected and tetrahedra can result in magnetic frustration when either A or B is separately magnetic [6]. While magnetic properties of Nd2Ru2O7 have been reported previously [7], we show here that the presence of ferromagnetic impurity phases compromised the earlier analysis. There has also been some confusion in the literature about the nature of the ordering of the Ru 4d spins in Nd2Ru2O7; several reports have suggested that the ordering is glassy [8, 9, 10, 11, 12]. We find compelling evidence that Nd2Ru2O7 is not a spin-glass, and propose a reason for the observed history-dependence of the ZFC-FC magnetic susceptibility and weak ferromagnetism below the ordering temperature. Heat capacity studies of the magnetic transition in Nd2Ru2O7 are also presented here.
In Ru2O7 pyrochlores the structural modifications between metallic and semiconducting members are small, suggesting that the electrical transport properties are delicately positioned near the edge of localized and itinerant behaviour. This positioning, at the edge of metal-insulator divide, potentially serves as a prime locator for thermoelectric materials: a high Seebeck coefficient is generally found in insulators, with potentially acceptable electrical conductivity on the metallic side, striking the right balance in properties [13, 14]. For this reason, we investigate the high-temperature thermoelectric properties of Nd2Ru2O7. When compared to well-known chalcogenide thermoelectric materials, for e.g., PbTe, Bi2Se3, and Bi2Te3, metal oxides are of interest due to the expectation of higher stability at elevated temperatures and the prospect of using less toxic and more abundant elements. The discovery of high thermoelectric performance in NaxCoO4[15] has led to renewed interest in oxide thermoelectric materials, despite the figure of merit (ZT) of this system and other bulk oxide materials being too small for widespread use [14, 16]. Towards the goal of a more directed and effective search for high-performance metal-oxide thermoelectric materials, we also introduce a new type of plot for data visualization that can be used to rapidly screen potential candidates for thermoelectric performance.
2 Experimental details
Polycrystalline samples were made by direct reaction of constituent oxide powders (RuO2, 99.99%, Sigma-Aldrich; Nd2O3, 99.99%, Alfa Aesar). Owing to the volatility of Ru oxides in air at high temperatures (1040∘C), samples were prepared with a 1 mol% excess RuO2. Pellets were cold-pressed and annealed at 1000∘C for 7 days with several intermediate grindings, after which starting materials were still found by lab XRD. Following this initial reaction, pellets were wrapped in Pt-foil and annealed in evacuated silica ampoules at 1100∘C for 7 days. The samples were cooled to 800∘C at 0.5∘C/min, and further annealed at 800∘C for 7 days to promote healing of defects. Finally, samples were cooled slowly to room temperature at 0.5∘C/min. If Nd2Ru2O7 is annealed in air at 1040∘C or 1060∘C for 12 days, Rietveld analysis of XRD patterns indicates the sample contains 78 mol% Nd3RuO7 and 22 mol% Nd2Ru2O7 when the annealing temperature is 1040∘C, and pure Nd3RuO7 when the annealing temperature is 1060∘C.
To avoid the formation of Nd3RuO7 at the high temperatures and extended annealing times required for solid state reactions, polycrystalline samples of 99% purity were also made by ultrasonic spray pyrolysis (USP) of aqueous nitrate precursors [Ru(NO)(NO3)3, Sigma-Aldrich; and an aqueous solution of Nd3+, prepared by dissolving Nd2O3 in 2 M HNO3][17, 18]. A modified ultrasonic humidifier was used to generate a mist, which was passed through a tube furnace (30.5 cm heating zone) at 700∘C with a positive pressure of air at a flow-rate of 5 scfm (140 L/min). The product was collected in water, and the mixture was evaporated at 70∘C; the resulting black solid was cold-pressed into a pellet and annealed in air at 1100∘C for 8 hours. Samples were then quenched in air (removed from the furnace at 1100∘C) or annealed in air for 7 days at 800∘C then cooled to room temperature at 1∘C/min. Rietveld refinement of the structure with synchrotron XRD data revealed no significant differences in the bulk long-range structure between samples that were quenched rapidly and samples that were annealed at intermediate temperatures and cooled slowly, nor were there differences in structure between samples made by USP and samples made by solid state reaction. USP offers a rapid preparatory route to prepare Nd2Ru2O7 in 24 hours, rather than 14 days.
Laboratory XRD was performed using a Philips X’Pert diffractometer with Cu K radiation and using mis-cut Si sample holders to reduce background signal. High-resolution synchrotron X-ray diffraction (XRD) data on finely-ground powder was acquired at 100 K and 295 K at beamline 11-BM at the Advanced Photon Source (APS), Argonne National Laboratory, using an average wavelength of 0.413 Å on a diffractometer that has been described in detail by Wang et al. [19]. The precise wavelength was determined using a mixture of Si (SRM 640c) and Al2O3 (SRM 676) NIST standards run in a separate measurement. Samples were contained in 0.4 mm diameter Kapton capillaries and the packing density was low enough that absorption was not noticeable. Neutron powder diffraction was performed on the BT-1 diffractometer at the NIST Center for Neutron Research. A Cu(311) monochromator was used, with a constant wavelength of = 1.5402(2) Å and a second-order contribution at . Data was collected at 300 K over the range of 3∘ to 168∘ 2 with a step size of 0.05∘. All diffraction data shown here are from a sample made by solid state reaction, though Rietveld analysis of data obtained by synchrotron XRD on other samples made by solid state reaction or USP lead to identical results.
X-ray total scattering was performed at beamline 11-ID-B at the APS, using a wavelength of 0.137020 Å. The pair distribution function (PDF) was extracted with PDFgetX2 [20] using = 28 Å-1, and full-profile PDF structure refinement was completed using PDFgui [21]. and were refined on 1950 data points. Key instrumental parameters were = 0.0551 Å-1 and = 0.00963 Å-1 respectively, using a CeO2 standard run in a separate measurement.
Magnetic properties of powders were measured using a Quantum Design MPMS XL-5 SQUID magnetometer. In addition to DC measurements, frequency-dependent AC measurements were performed in a small temperature range between 130 K and 155 K. Low-temperature electrical transport properties and heat capacity were measured using a Quantum Design Physical Properties Measurement System. Samples for electrical transport measurements employed the 4-probe geometry on a pellet of sintered powder with dimensions of approximately 9 mm 3 mm 3 mm. Electrical contacts were made with copper wire and silver epoxy. Three samples were run to ensure reproducibility: two made using USP with apparent densities of 38% and 53%, and one made by ceramic preparation with an apparent density of 58%. Electrical resistivity at 300 K varied from 1.2 cm to 2.4 cm between the samples, and is consistent with previous reports of 1.8 cm [22]. Despite slight differences in magnitude of resistivity, all samples displayed consistent temperature-dependent behaviour. Heat capacity measurements were collected on a pellet of mass 13.90 mg made by pressing 50 wt% of sample and 50 wt% of silver powder (99.99%, Sigma-Aldrich) and analyzed using the thermal relaxation dual-slope method. A thin layer of Apiezon N grease ensured thermal contact between the platform and the sample. The heat capacity of the Apiezon N grease and silver were collected separately and subtracted from the measured sample heat capacity.
High-temperature thermoelectric properties (electrical resistivity and Seebeck coefficient) were measured with an ULVAC Technologies ZEM-3. Sample pellets had approximate dimensions of 9 mm3 mm3 mm. Measurements were performed under a helium under-pressure, and data was collected through three heating and cooling cycles to ensure sample stability and reproducibility. No changes in physical properties were observed between cycles, and analysis of the lab XRD pattern of the materials after measurements showed no changes in structure nor new phases. Two different samples (USP and ceramic) were tested to verify consistency.
3 Results and Discussion
3.1 Structure
The high symmetry ideal pyrochlore crystal structure is completely determined by the cubic cell parameter and a single positional structural parameter, associated by the position of O which is sited at . However, there are many types of disorder that arise in this structure type, and a careful examination of the structure is necessary to understand properties. For example, Vanderah et al. recently described the widespread presence of antisite substitution on the A-site; up to 25% of the large A-sites can be replaced with small B-site metal ions [23]. Moreover, local off-centering of A-site cations is well-known in Ru pyrochlores such as Bi2Ru2O7 [5, 24]. The presence of disordered oxygen vacancies has been observed in metallic members of BixRu2O7 solid solutions [25]. Due to the relatively small X-ray scattering factor of O compared to the other elements present in Ru2O7, use of only lab XRD has led to inaccurate determination of the O atomic position, as demonstrated by Kennedy and Vogt [25]. This inaccuracy has a large effect on the reported Ru–O–Ru bond angles, which are known to critically influence electrical properties. For example, in Bi2Ru2O7, there is a 6∘ discrepancy, and for other Ru2O7 members there is up to a 2∘ discrepancy in the reported Ru–O–Ru bond angles [3, 24, 26].
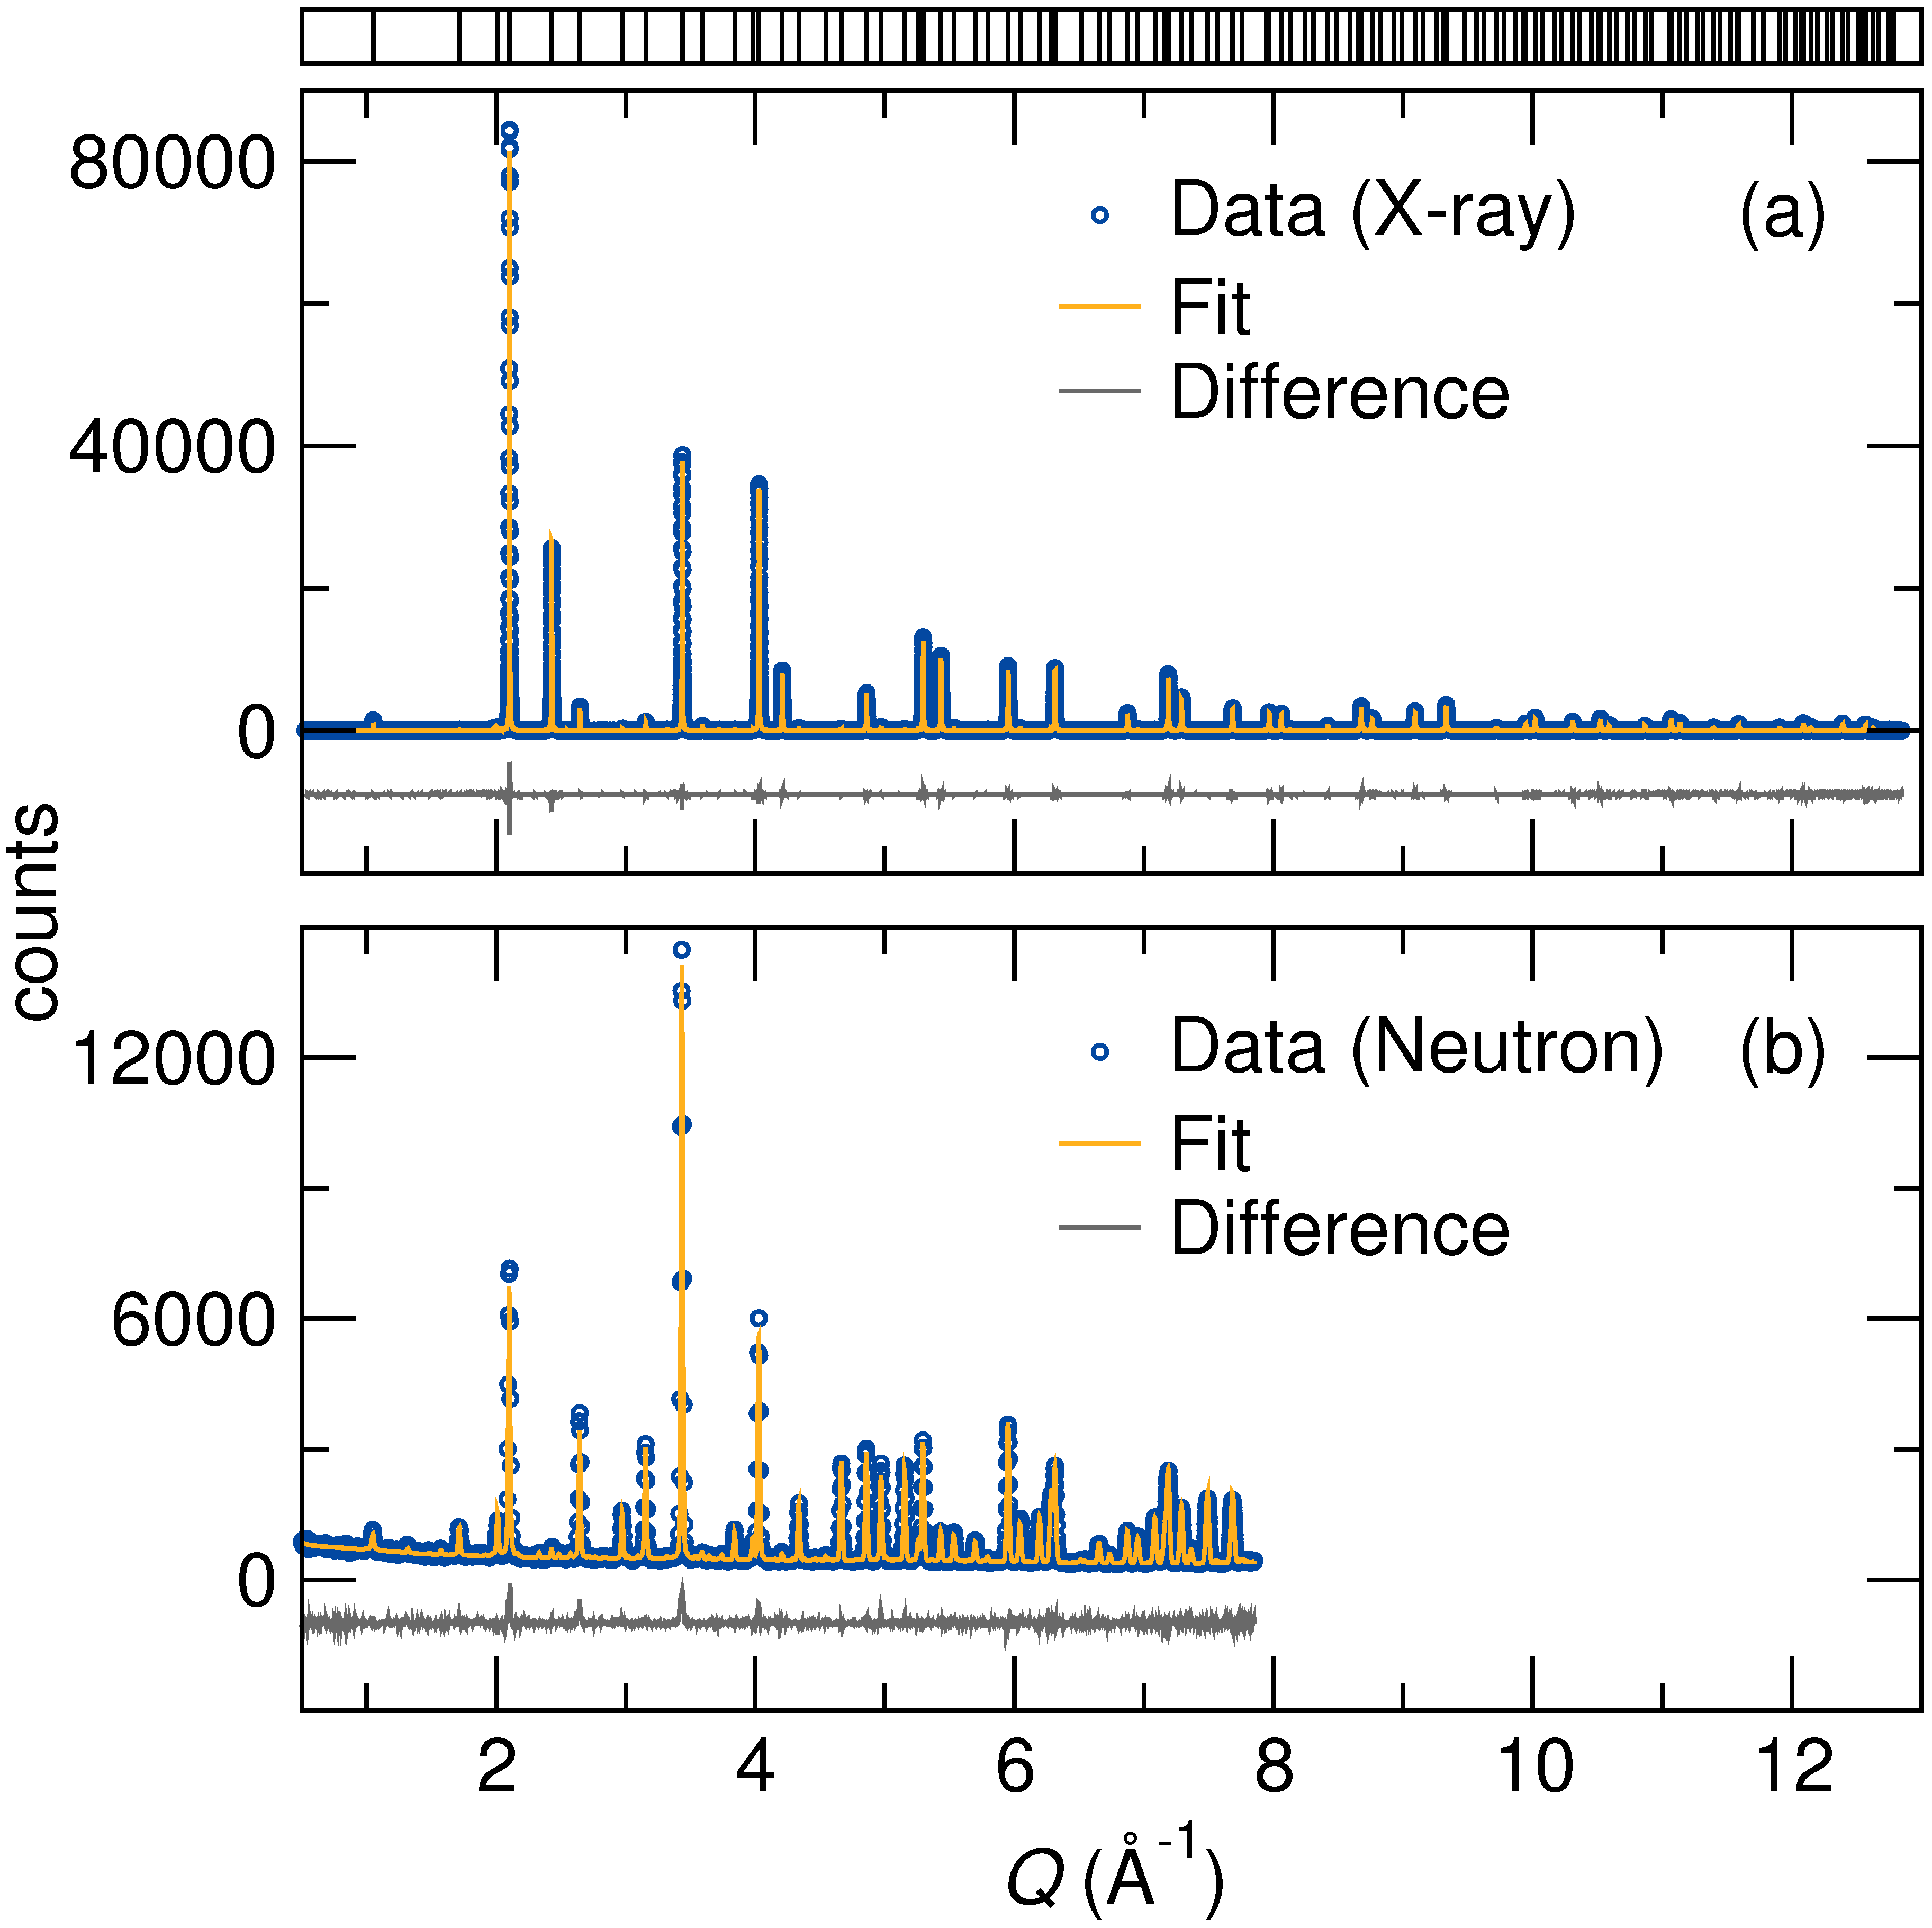
Combined Rietveld refinement was carried out using room-temperature data sets (figure 2), where the structure was refined on 51295 data points. During the combined refinement, the synchrotron X-ray wavelength was fixed while the neutron wavelength was allowed to vary, though the refined wavelength was within two standard deviations of the starting value determined by previous instrumental calibration. Isotropic displacement parameters were used to describe the electron density of the atoms in the structure, as refinement of anisotropic displacement parameters did not improve the quality of the fit. Rietveld refinement was performed with XND code [27], and structures were visualized using VESTA [28].
Rietveld refinement of the structure using synchrotron powder XRD (figure 2(a)) data indicates samples were 99.5(1) mol% Nd2Ru2O7 and 0.5(1) mol% RuO2. The minor presence of RuO2 is not expected to influence the physical properties reported here. There were no significant differences in structure between samples that were quenched rapidly and samples that were annealed at intermediate temperatures and cooled slowly. Additionally, there were no significant differences in structure between samples made by USP and samples made by solid state reaction, nor were there differences between samples annealed under static vacuum and samples annealed in air. Taken together, the long-range structural order of Nd2Ru2O7 appears to be insensitive to preparation conditions and methods. In particular, annealing Nd2Ru2O7 under low oxygen partial pressures (i.e., in evacuated ampoules) does not appear to lead to oxygen deficiency. More evidence of this stability is presented in a later subsection, as electrical resistivity does not change after several heating cycles between 300 K and 900 K under oxygen-free conditions. This suggests that O vacancies not already present in the ordered pyrochlore structure are not formed to an appreciable extent in Nd2Ru2O7. To check for the presence of oxygen vacancies, the site occupancy of O′ was allowed to refine freely; the best refinements were consistent with complete occupancy. This finding is supported by previous neutron-diffraction studies, which found no evidence for additional oxygen vacancies in Nd2Ru2O7 [25]. The oxygen positional parameter converged to = 0.33012(7), identical to previous reports using neutron diffraction [25, 29].
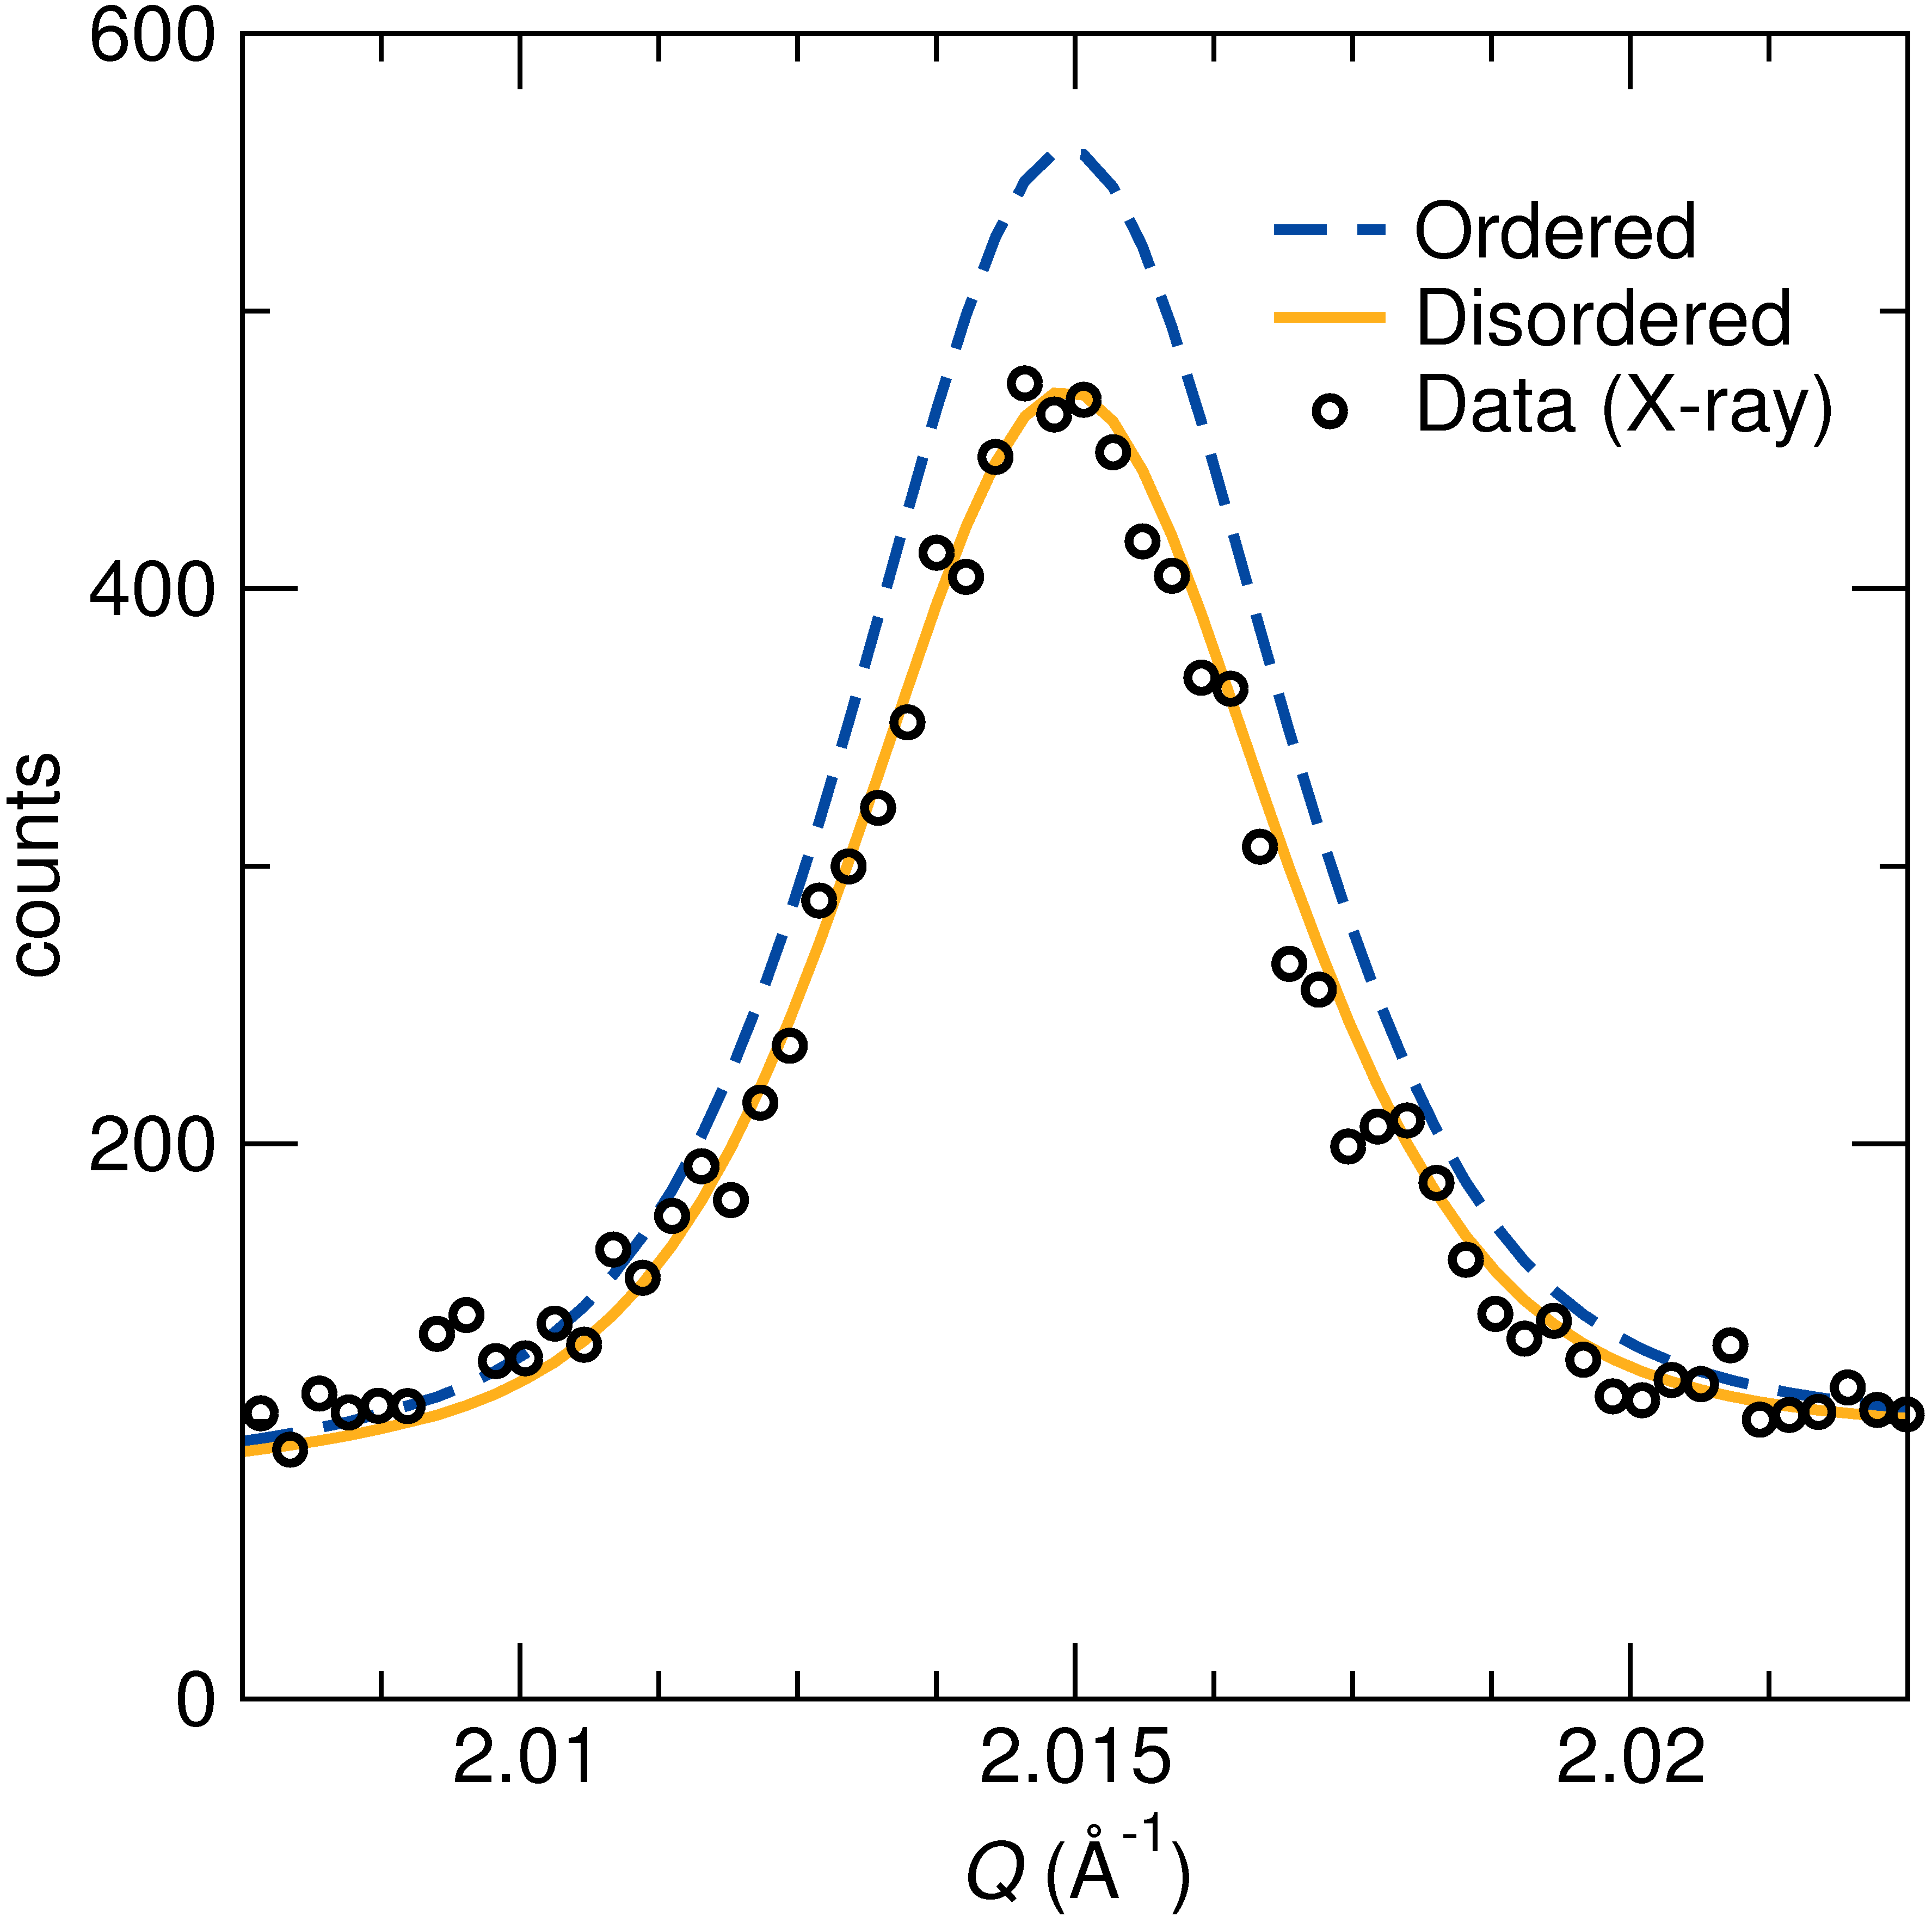
Synchrotron X-ray diffraction studies offer the advantage that the Nd3+ and Ru4+ X-ray scattering factors are sufficiently distinct due to the large difference in atomic numbers. In contrast, neutron diffraction does not clearly distinguish between the similar coherent scattering lengths of Nd (7.03 fm) and Ru (7.69 fm) [30]. The synchrotron diffraction data allowed the recent findings of Vanderah et al. regarding antisite disorder on the cation sites to be tested. The site occupancy and atomic displacement parameters are often correlated, so synchrotron X-ray data was collected at both 100 K and room temperature (295 K). However, these parameters were not strongly correlated in this investigation, and a combined Rietveld refinement using multiple temperatures did not change the outcome of the analysis. Accordingly, we continue our discussion using the combined Rietveld refinement of room-temperature X-ray and neutron diffraction datasets (figure 2). When Ru was allowed to substitute on the A-site, the refinement converged with 7.0(3) mol% Ru and a slight improvement in the fit. A similar trial refinement of Nd on the B-site did not improve the fit. The stability of all refined models (B-site disorder, A-site disorder, no antisite disorder) was verified by perturbing other parameters. Because allowing A-site disorder improves the fit only marginally, it is important to consider whether the improved fit is significant, or if the improvement is merely because more parameters are introduced. Use of a Hamilton test [31] shows the difference is statistically significant at 0.5% confidence interval. Indeed, with only one additional parameter between the two models, the large number of independent measurements makes virtually any improvement in statistically significant. Visual inspection reveals only minor changes between the models, though in the limited areas where antisite disorder causes the largest changes, A-site disorder improves the fit to the experimental peak-shape (figure 3). The same results are obtained in samples made by USP and by solid state reaction. With these considerations in mind, the presence of A-site disorder is suggested.
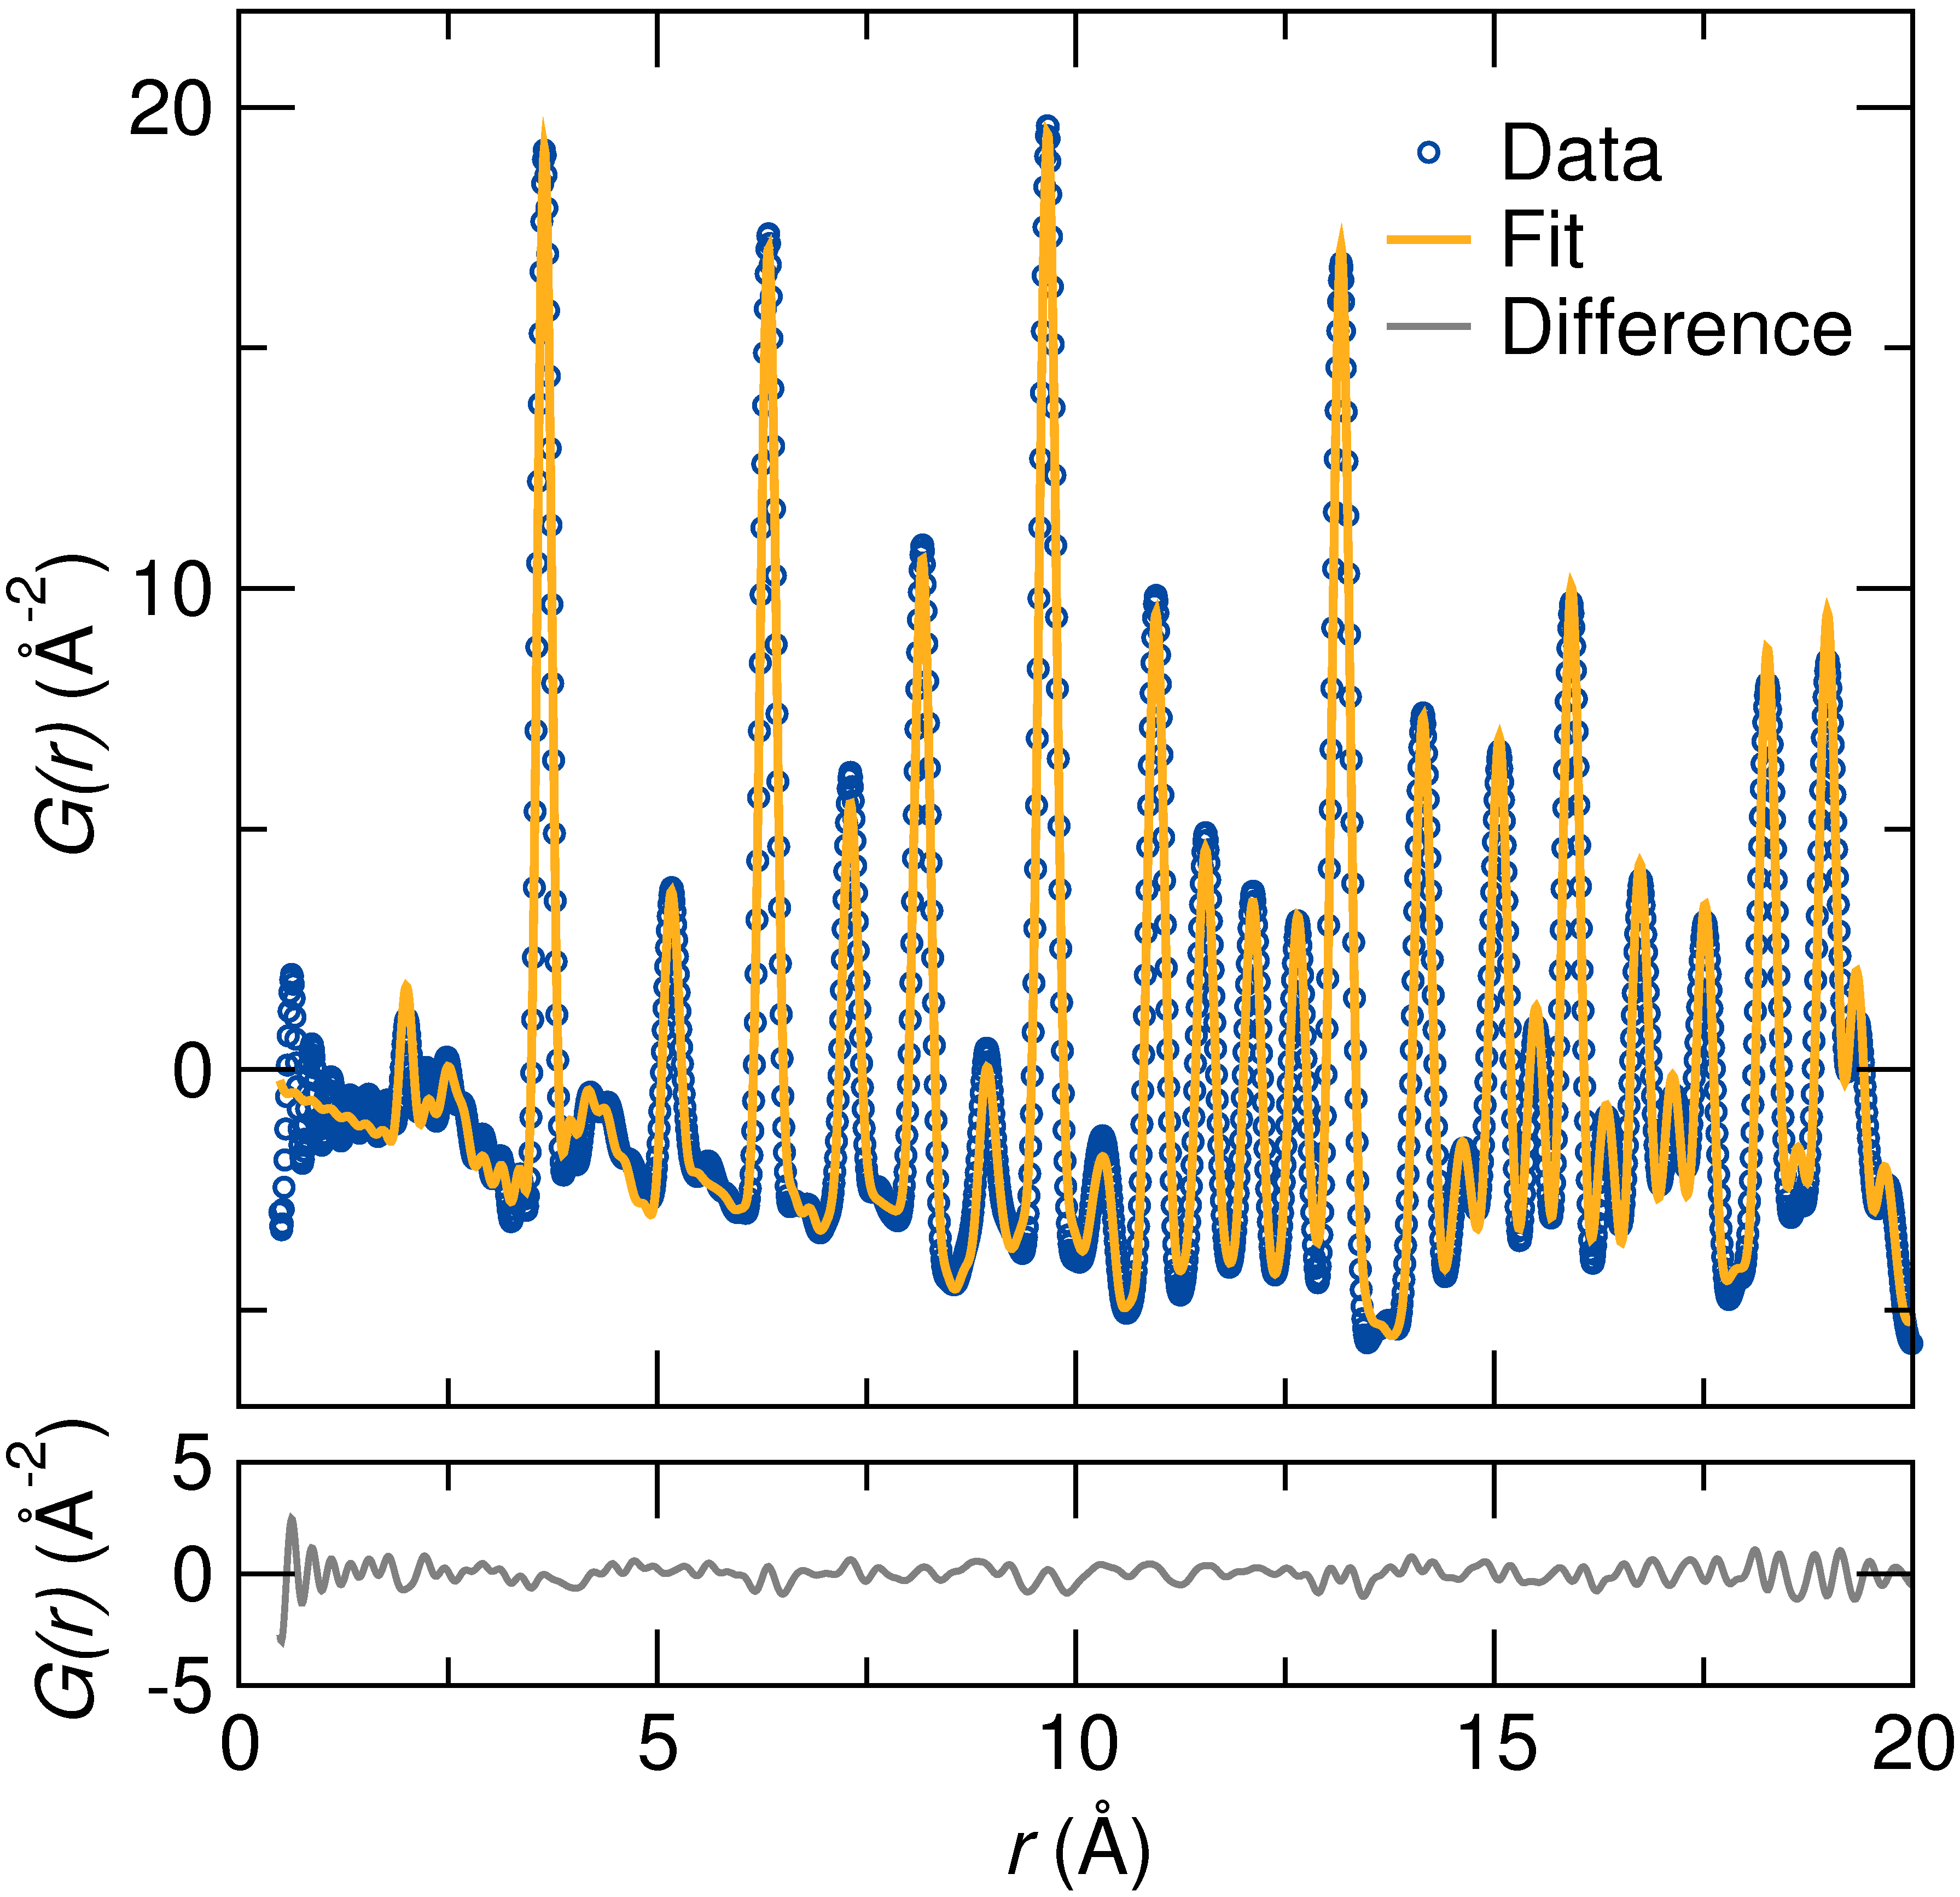
The X-ray pair distribution function (PDF) obtained by total scattering agrees well with the model generated by the average, long-range structure (figure 4). Refinement of partial Ru substitution on the A-site was attempted, but the refined occupancy converged to unphysical values, potentially due to strong correlation with the scale factor. Ideal cation site ordering Nd2Ru2O7 yielded a refinement = 10.05% and allowing 7.0% Ru to occupy the Nd site, as suggested from Rietveld refinement, yielded = 10.02%. The numerical improvement of the fit is marginal, and visual inspection reveals the difference between the models is much less than the level of noise present in the fit to the data. Rietveld refinement of Bragg scattering suggests partial antisite disorder, whereas PDF analysis of the total scattering shows no strong preference between full ordering or partial antisite disorder. This likely occurs because the PDF refinement is strongly weighted by near-neighbor correlations, which has been previously noted in the system La4LiAuO8 [32].
3.2 Magnetic and electrical transport behaviour
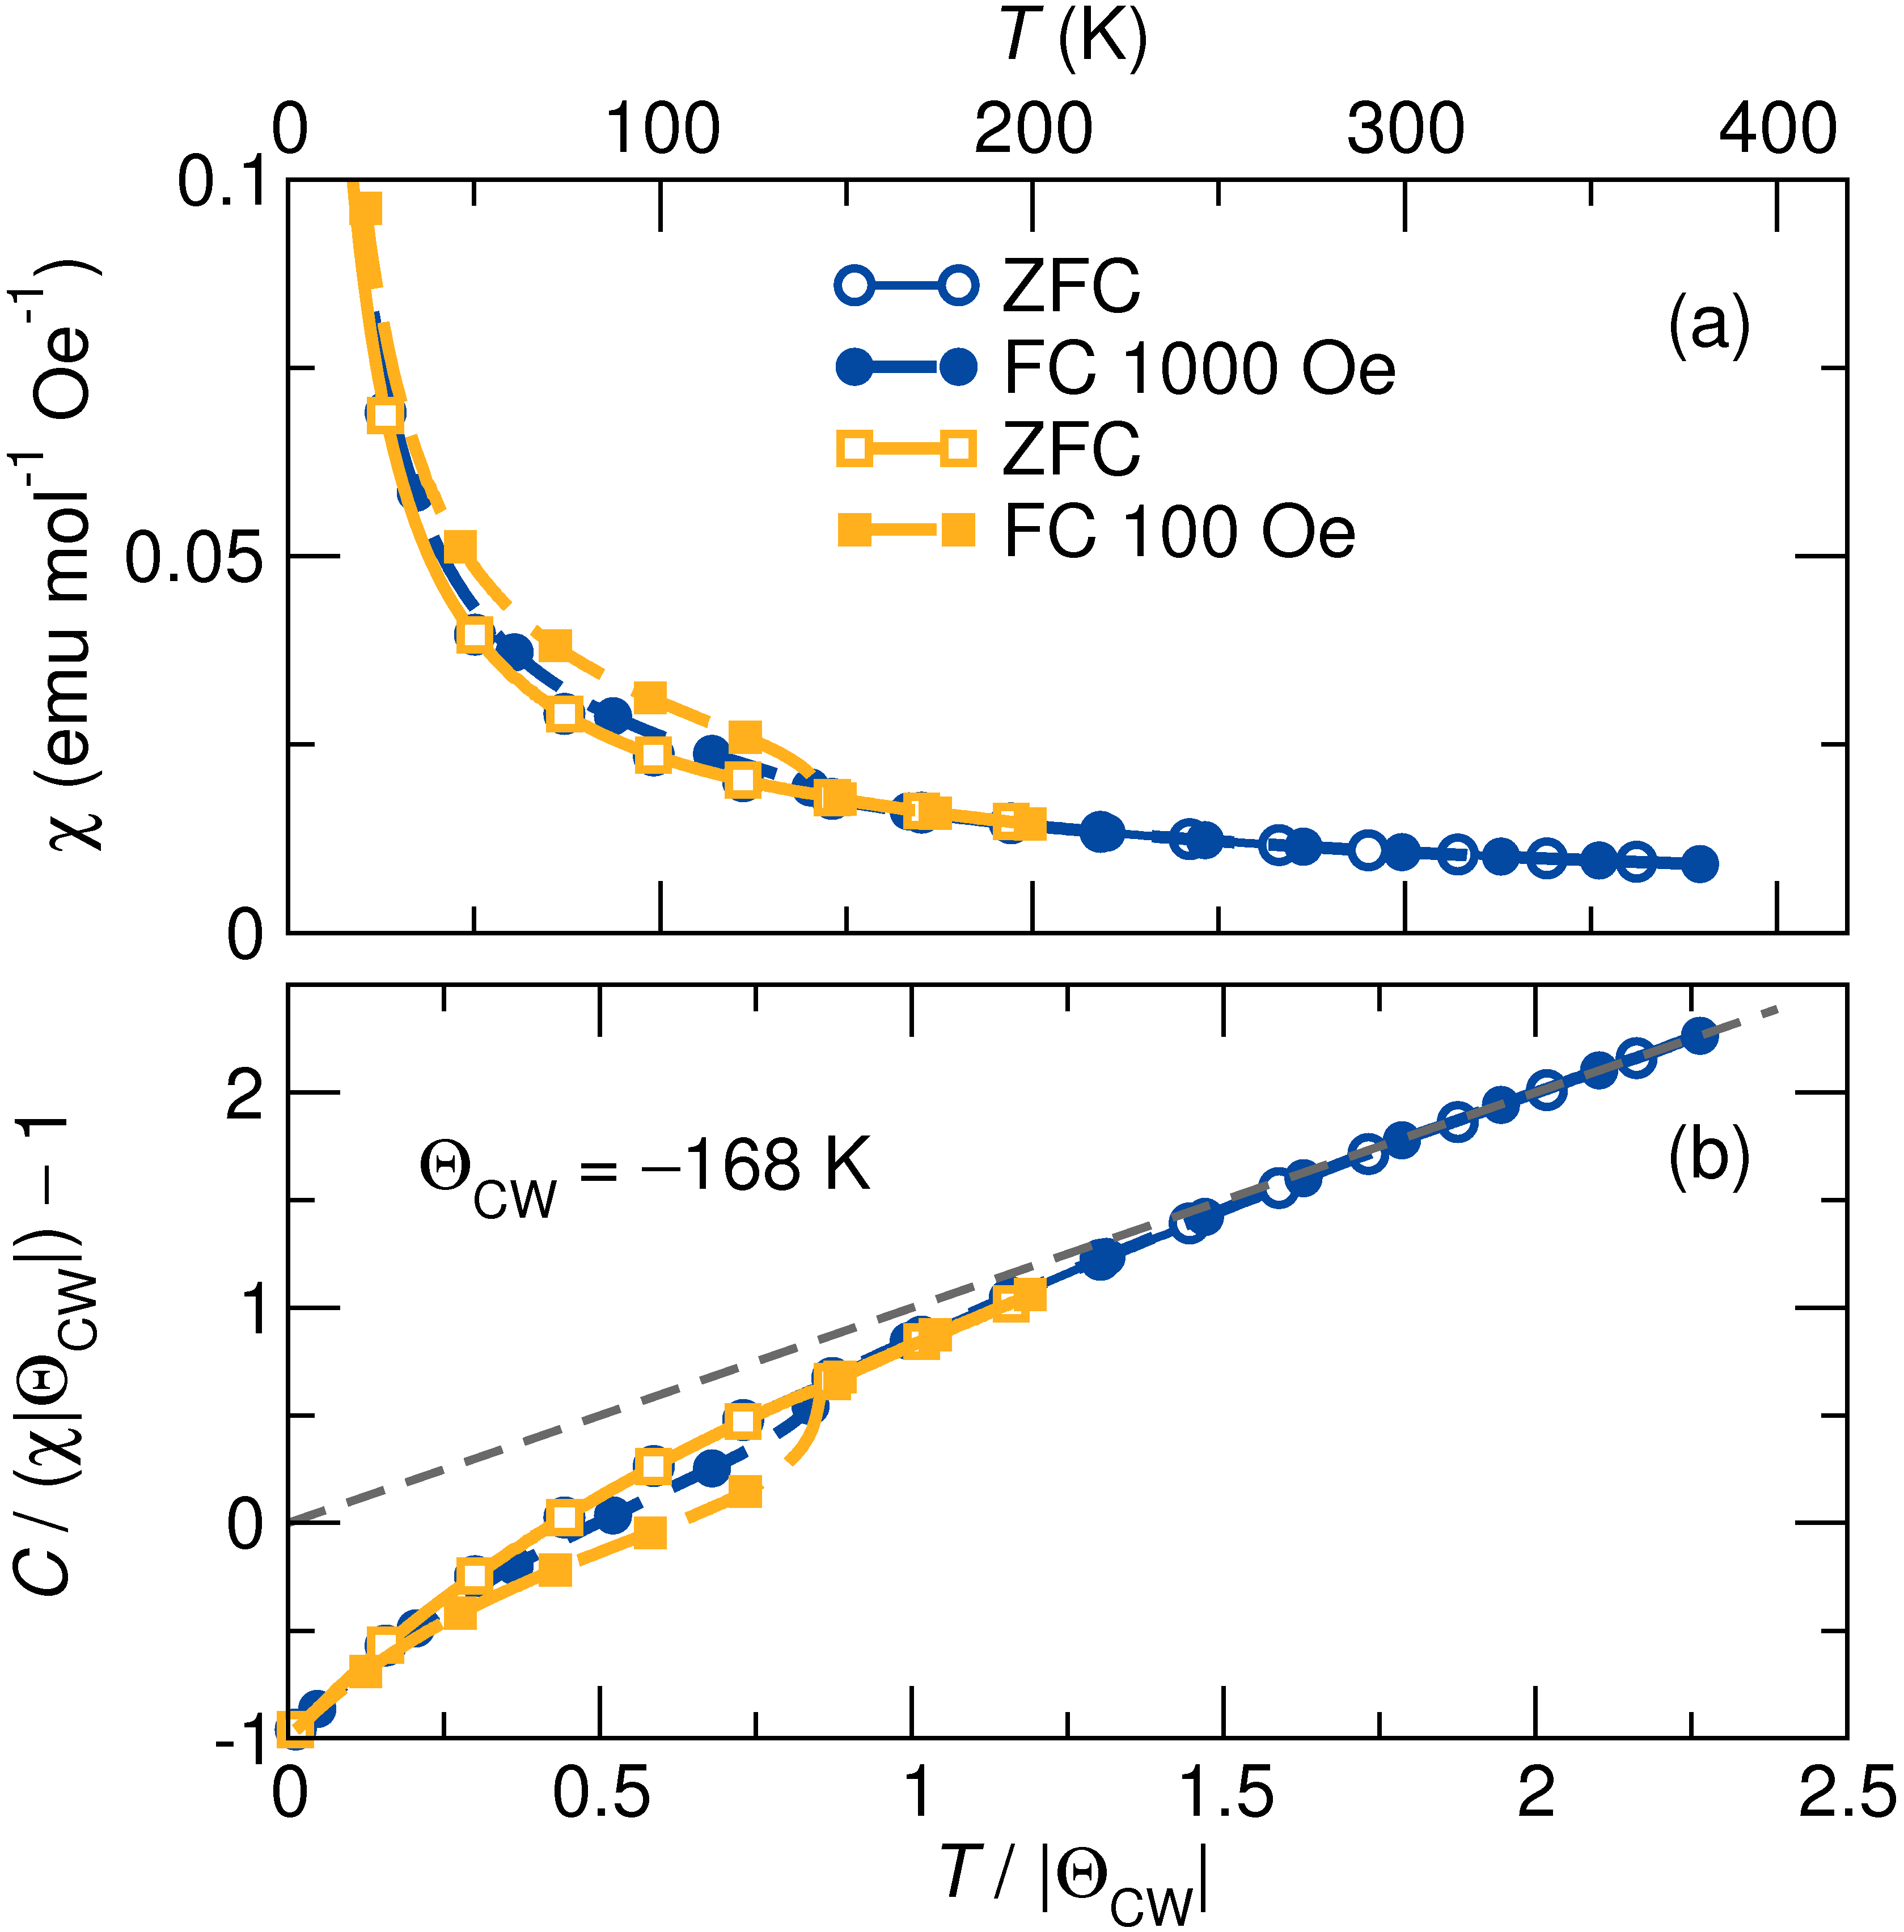
Zero-field cooled (ZFC) and field cooled (FC) measurements of the magnetic susceptibility show magnetic ordering of Nd2Ru2O7 at K (figure 5). The higher-temperature region (340 K to 380 K) of the susceptibility data was fit to the Curie-Weiss (CW) equation, = . The effective moment was extracted using the relationship , while the estimated spin-only and unquenched moments of Nd2Ru2O7 were calculated using . The determined effective paramagnetic moment was = 6.36 per Nd2Ru2O7 formula unit and the Weiss temperature was . The is close to the calculated spin-only value of = 6.8 , and significantly less than the calculated unquenched of 11.9 . Curie-Weiss analysis reveals a negative , indicating that the dominant magnetic interactions are antiferromagnetic. However, it is apparent from the first derivative (not shown) that the inverse susceptibility remains mildly non-linear as a function of temperature, indicating that Nd2Ru2O7 does not display pure Curie-Weiss paramagnetism at these higher temperatures. Consequently, the determined Weiss temperature and should be treated only qualitatively.
Rearranging the Curie-Weiss equation allows the scaled inverse susceptibility to be displayed as a function of and provides a convenient way to visualize deviations from ideal Curie-Weiss paramagnetism [figure 5(b)] [33]. These deviations from Curie-Weiss behaviour are due to short-range interactions, and the negative deviation seen in Nd2Ru2O7 arises from uncompensated moments. Additionally, the plot provides a convenient method to visualize magnetic frustration (the frustration index = ) [34]. Moderately frustrated systems tend to have [34], whereas for Nd2Ru2O7 , indicating the antiferromagnetic ordering is not strongly frustrated.
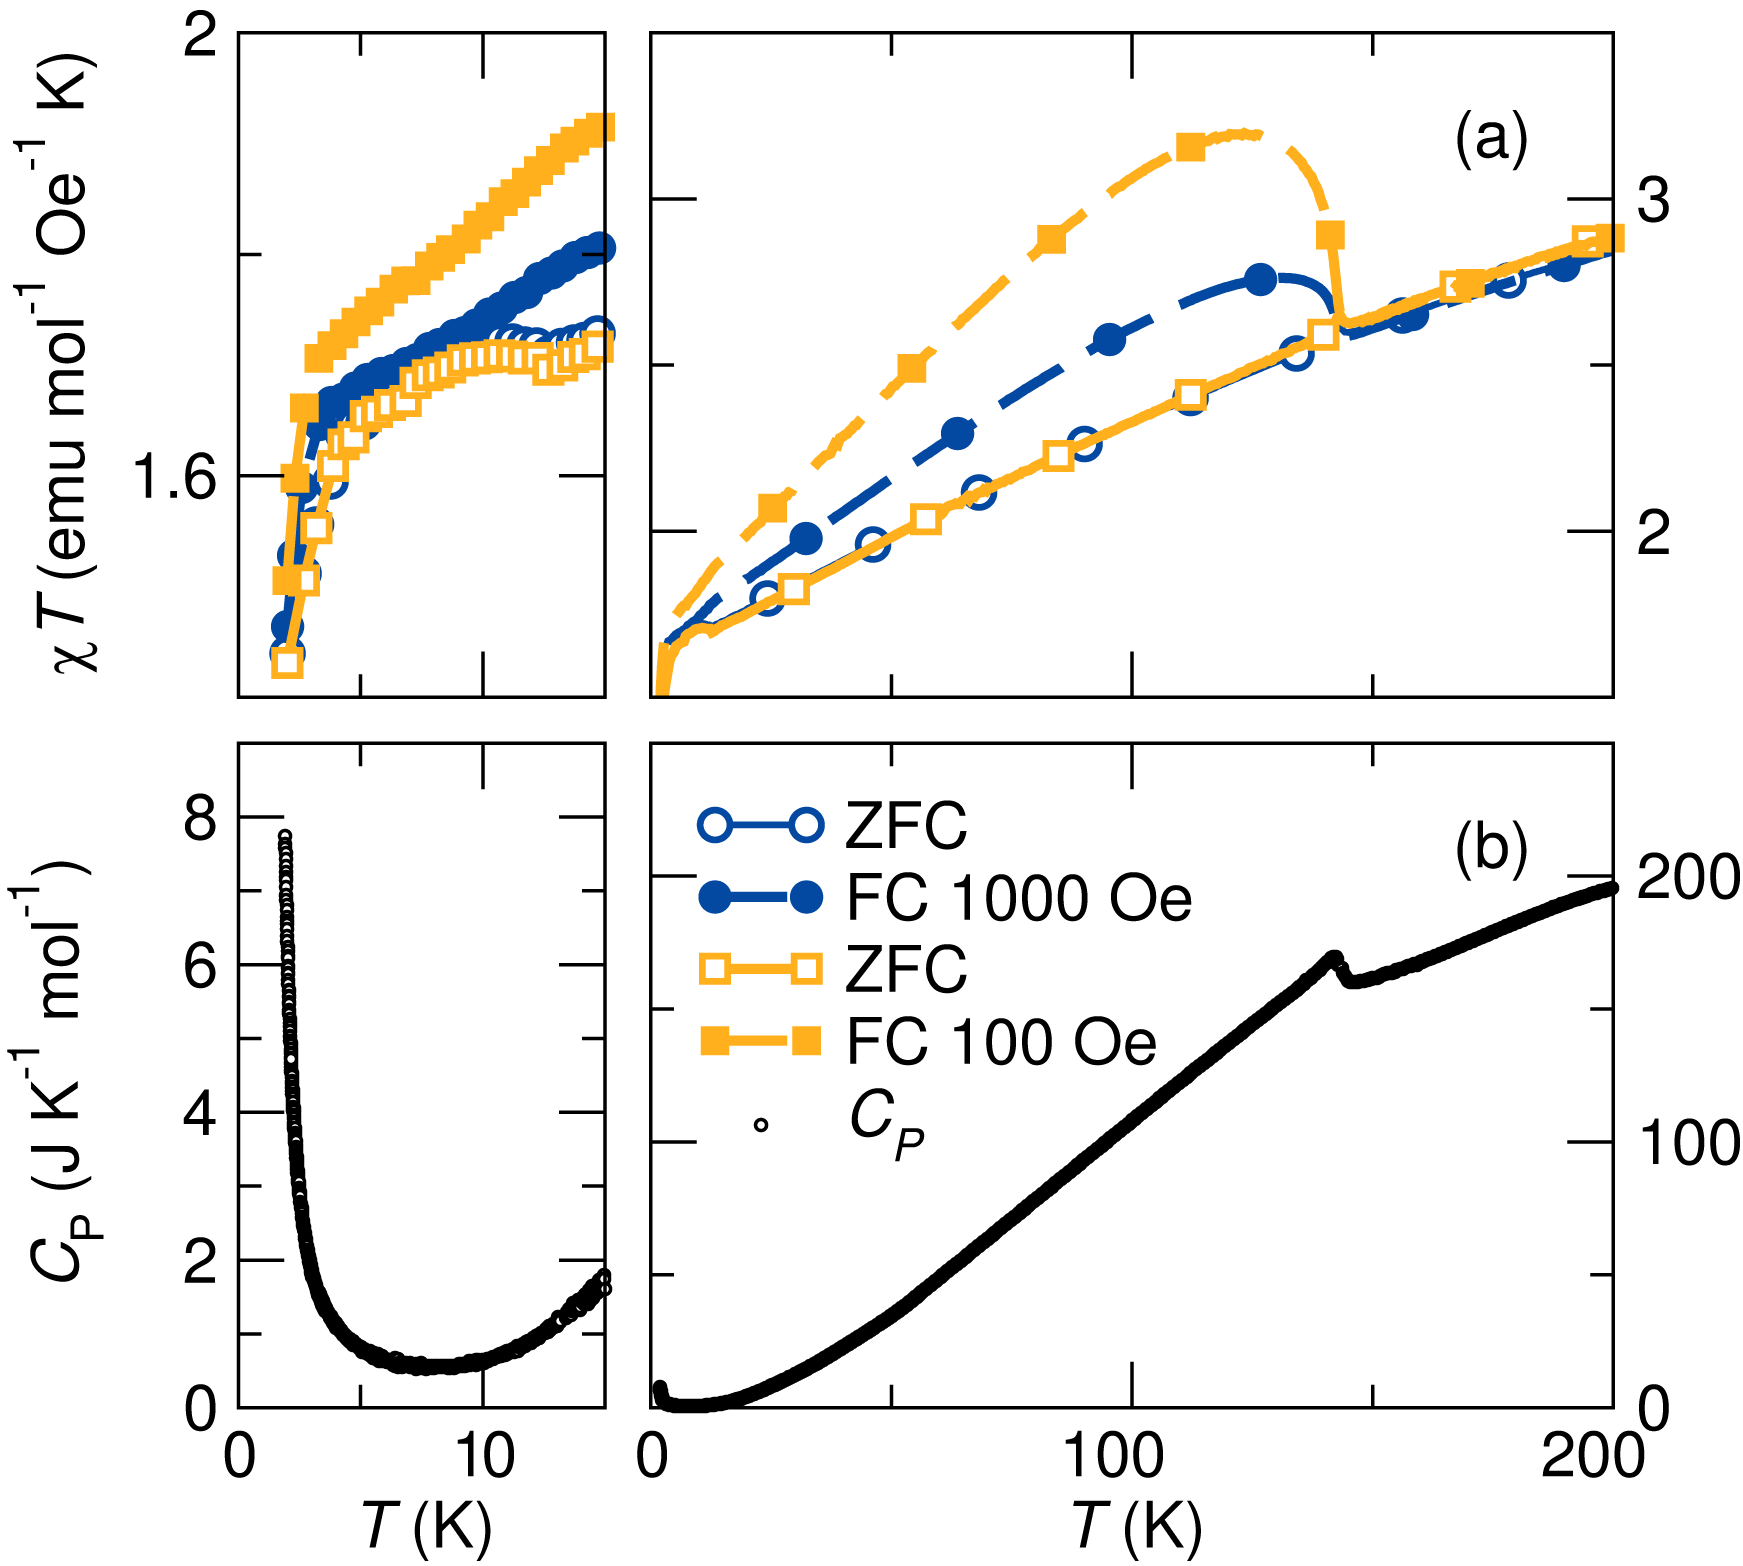
Previous studies have shown that the transition at 143 K is the result of antiferromagnetic ordering of Ru4+ 4d spins, as an analogous transition is observed in Y2Ru2O7, where there are no electrons at the A site [6, 10]. The negative Weiss temperature indicates the dominant magnetic interactions are antiferromagnetic; however, the Nd3+ 4f spins remain paramagnetic, and cause the upturn in susceptibility at lower temperatures. Additionally, the history-dependence of the ZFC and FC measurements and the increased susceptibility at lower applied fields suggest there are weak uncompensated (i.e. ferromagnetic) moments. Owing to the dominant paramagnetic component of the susceptibility and the normalization over the applied magnetic field, the weak ferromagnetic interaction saturates at lower applied fields and its contribution appears smaller at higher applied fields in the field-normalized susceptibility [figure 5(a)]. Meanwhile, the ZFC-FC bifurcation of the magnetic susceptibility is consistent with weak ferromagnetism arising from spin-canting, and is described later in further detail. Below 10 K, there is another transition due to antiferromagnetic ordering that can be clearly seen in the plot [figure 6(a)]. There is also a corresponding increase in the specific heat that is attributed to the tail of a Schottky anomaly, likely resulting from the ordering of the Nd 4f spins [35, 36, 37]. The rare-earth 4f spins are expected to interact much less strongly than Ru 4d spins because the 4f-orbitals are contracted [38]. Consequently, Nd 4f spins are decoupled from the Ru 4d spins and order at much lower temperature [9].
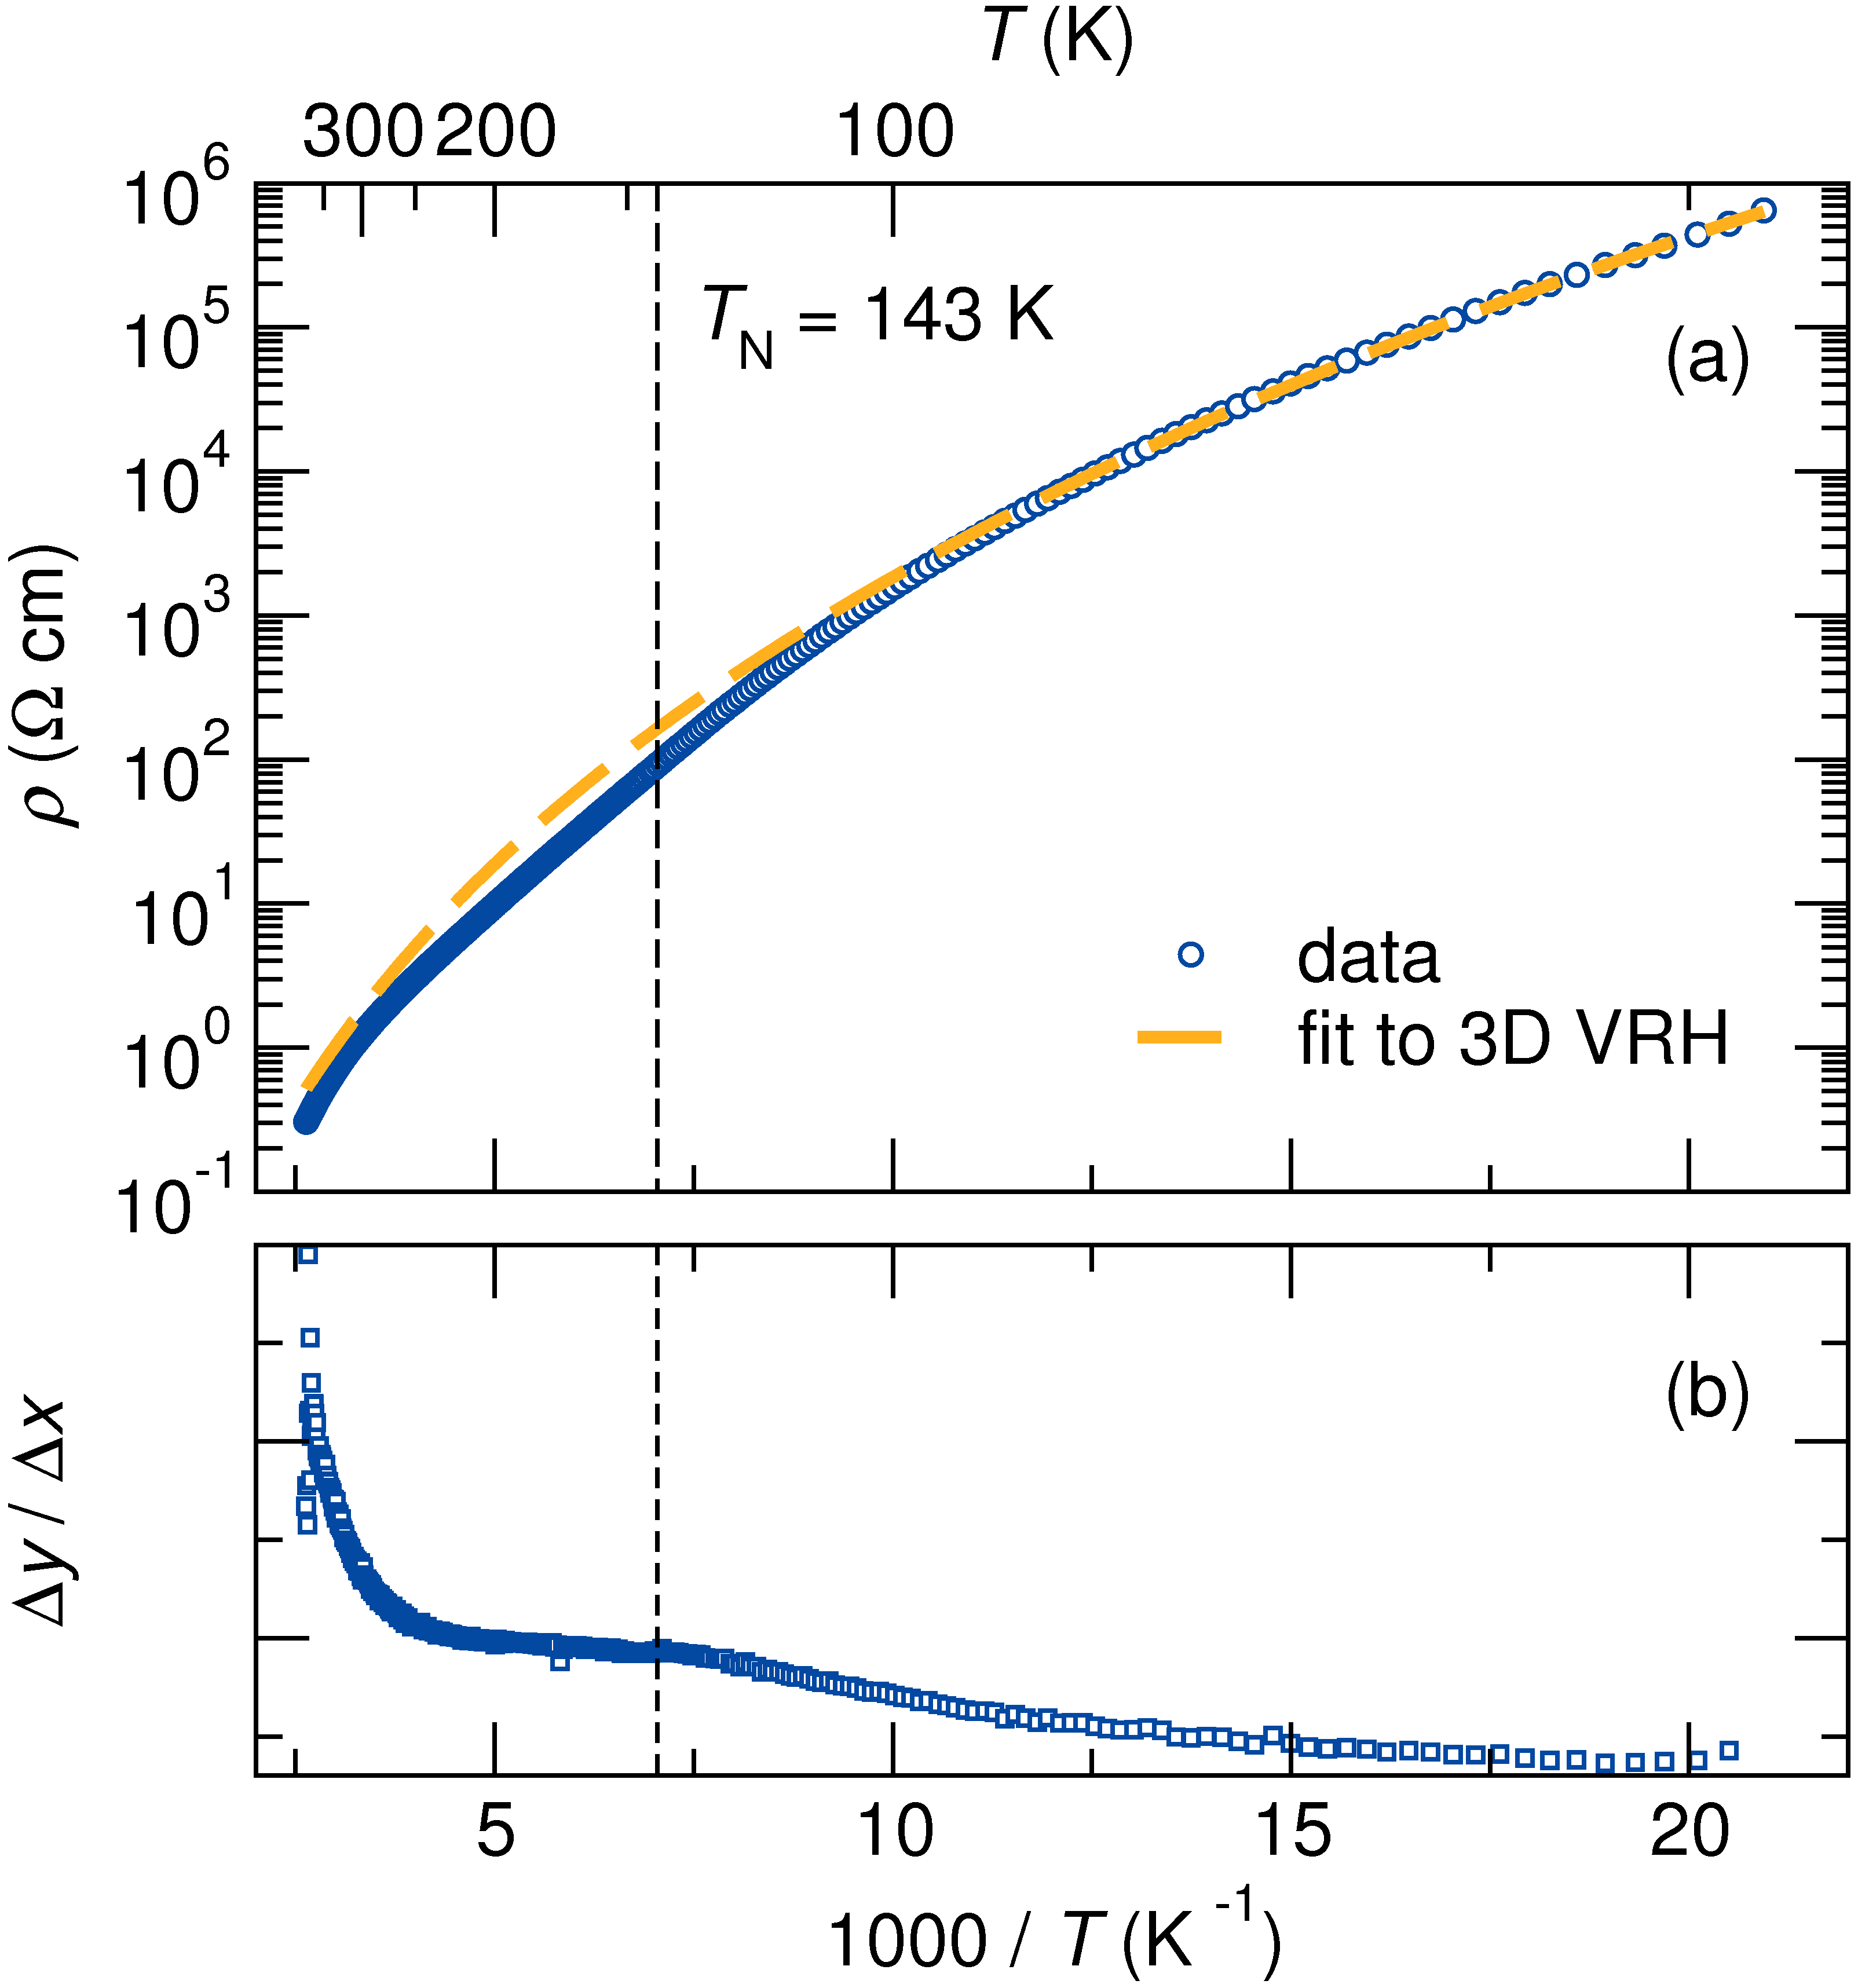
The antiferromagnetic ordering of Ru 4d spins at K causes notable effects in other measurements as well. The specific heat contains a corresponding -type anomaly with a maximum at 142 K [figure 6(b)], consistent with a second-order phase transition. Additionally, the electrical resistivity near the magnetic ordering temperature displays anomalous behaviour. An Arrhenius-style plot shows a change in slope at the magnetic ordering temperature (figure 7). Electrical conduction in Ru2O7 materials involves Ru 4d states, so it should come as no surprise that magnetic ordering of Ru 4d spins causes a marked change in electrical transport due to changes in scattering, as shown in the derivative of figure 7. Low-temperature electrical resistivity follows a 3D variable-range hopping model with = [39, 40], with a change in the hopping barrier at the magnetic ordering temperature ( K).
There has been considerable confusion in the literature about the nature of the ordering of the Ru 4d spins in Nd2Ru2O7 and analogous Ru-pyrochlores, in part due to the unusual field-dependent hysteresis present between the ZFC and FC susceptibility measurements, and also due to the many types of disorder and exotic phenomena that sometimes accompany geometric frustration in magnetic pyrochlores. In particular, several reports have mentioned that the glassy nature of the ordering of Ru 4d spins is evident in bulk magnetic susceptibility measurements [8, 9, 10, 11, 12]. However, neutron diffraction experiments below the ordering temperature show that Ru spins order with a long correlation length [9, 10]. This is incompatible with a glassy-state, where there is no long-range magnetic order. This is not the only signature of a spin-glass that is violated by experimental evidence. Notably, the temperature-dependence of the specific heat should vary smoothly near the magnetic ordering temperature [41], a stark contrast with the -type anomaly at 143 K, shown in figure 6(b).
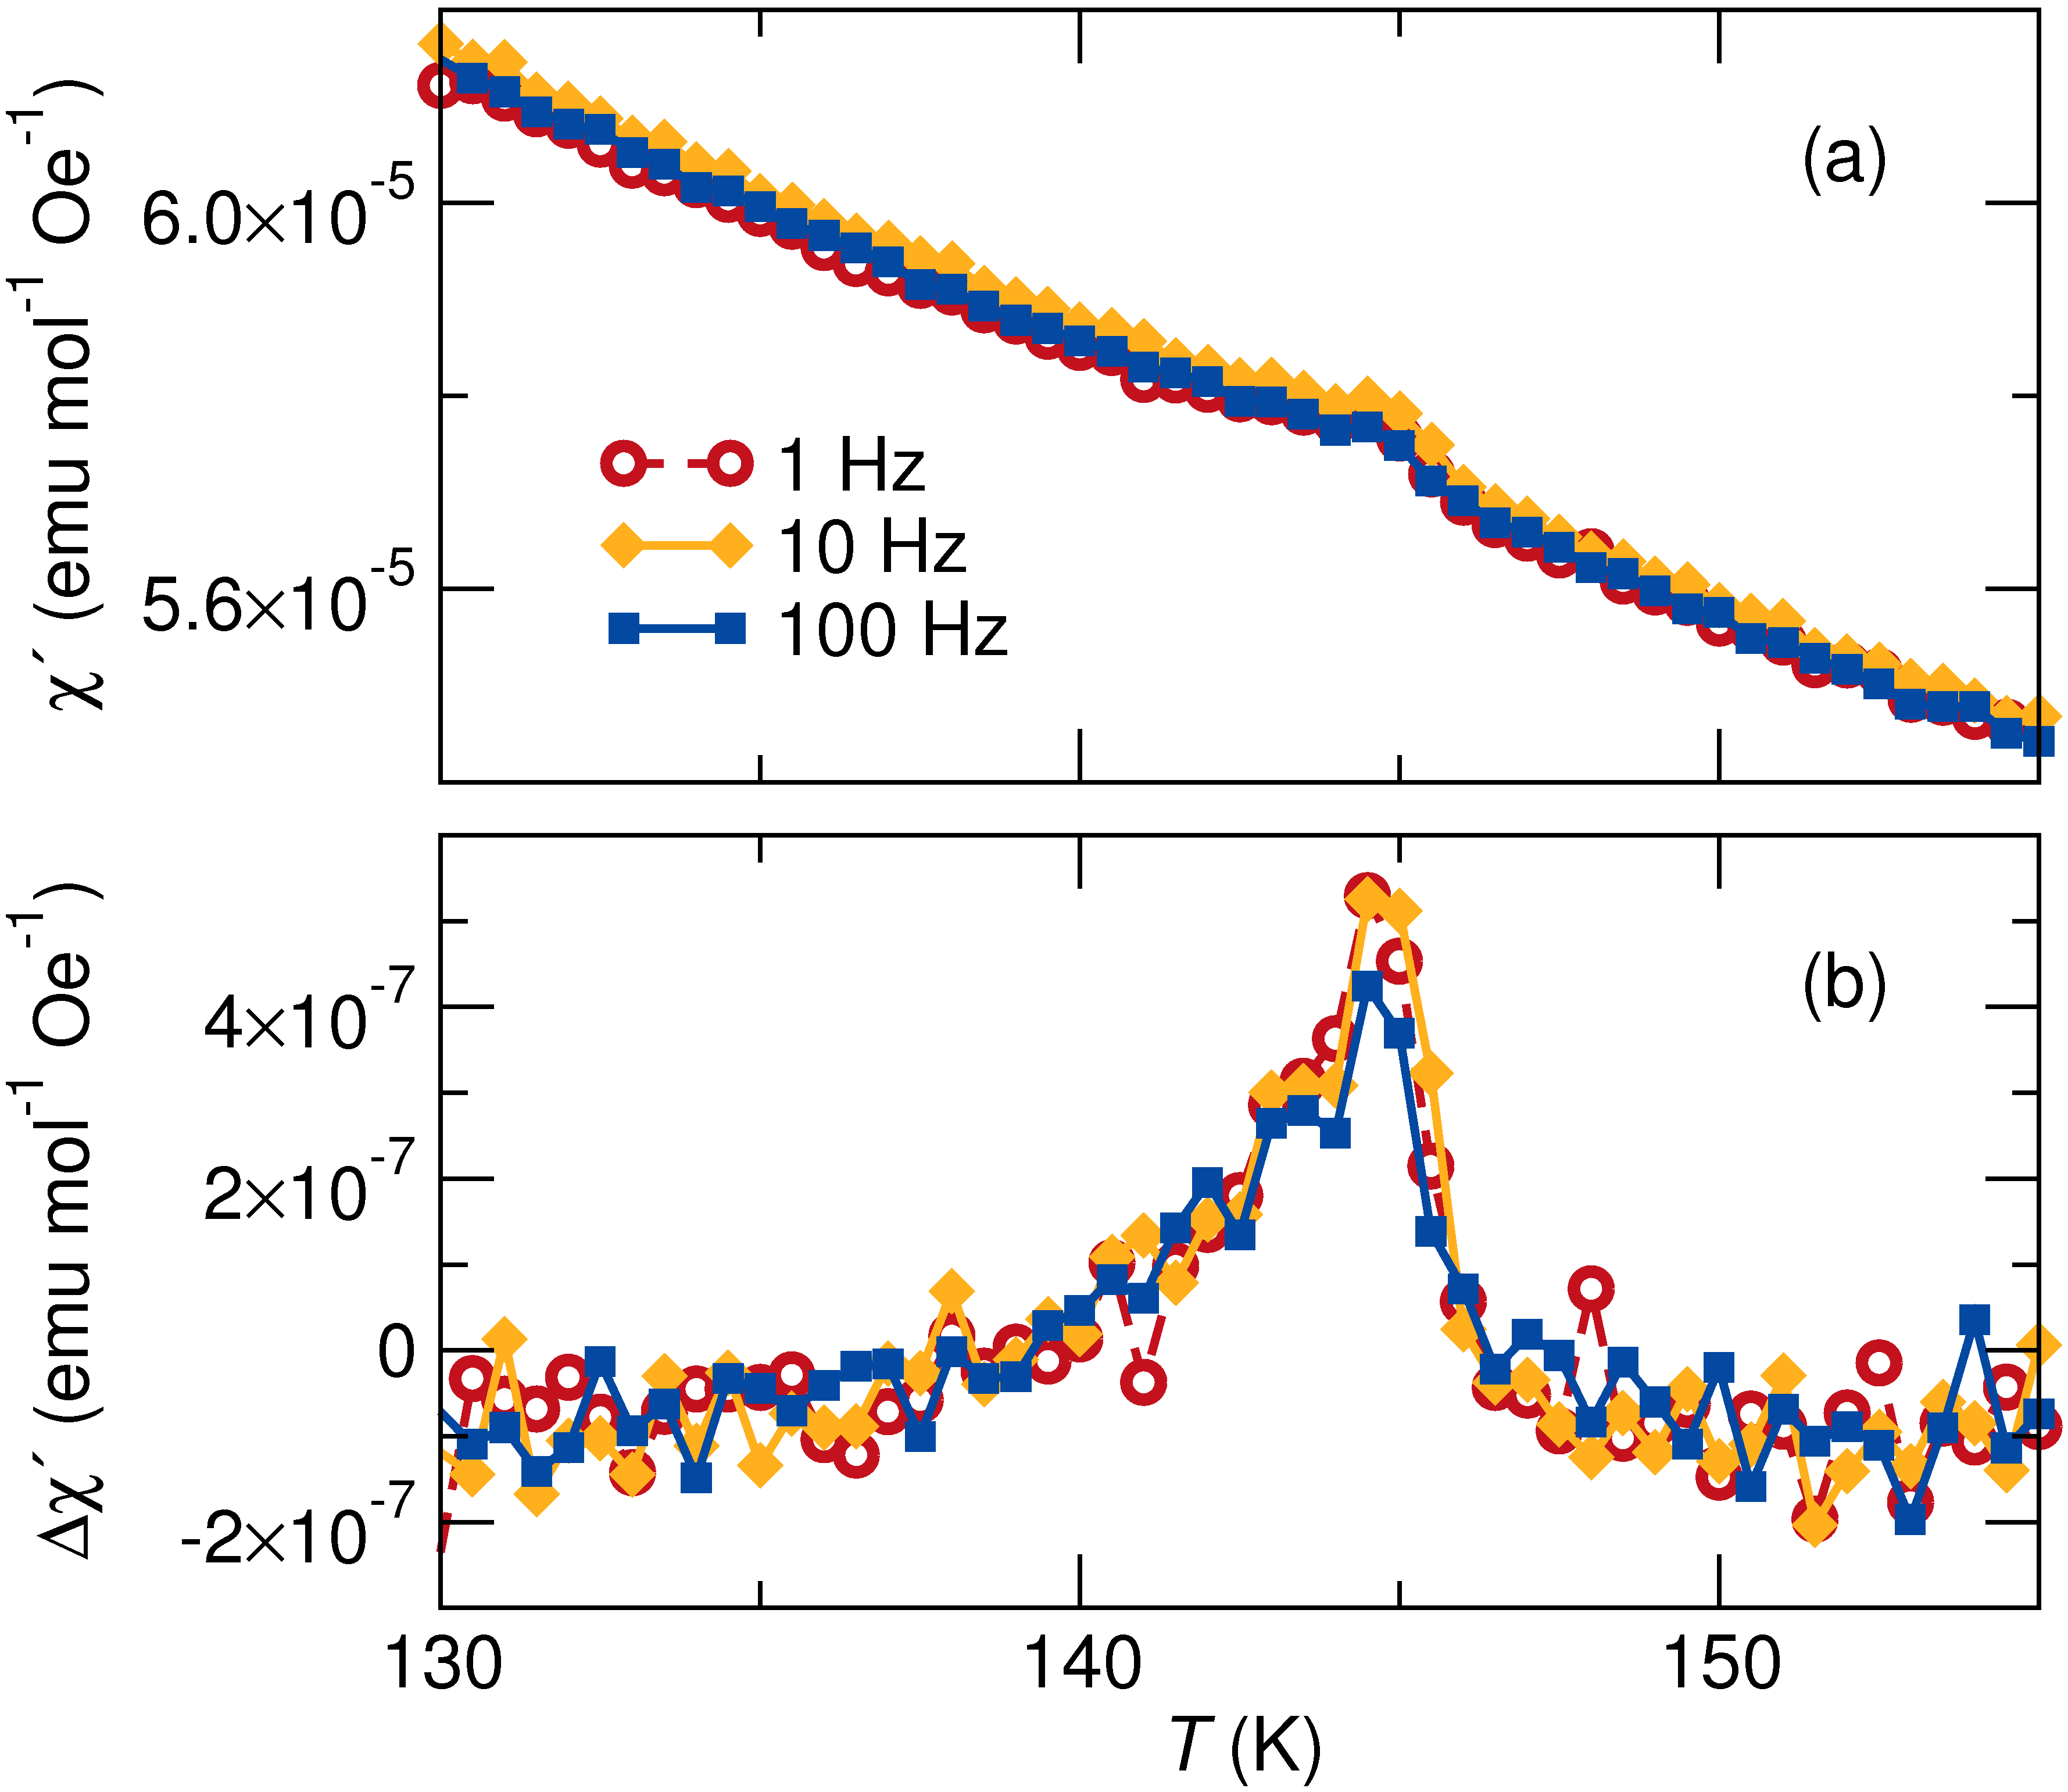
AC magnetic susceptibility measurements were also conducted, as another signature of a spin-glass is a magnetic ordering temperature that varies with the frequency of the applied magnetic field [41, 42]. The real, in-phase component of the AC susceptibility , is shown in figure 8(a), while the imaginary, out of phase component () of the complex susceptibility was below the instrumental detection limit, and is thus not presented. Owing to the paramagnetic response of the Nd3+ that dominates the signal, the paramagnetic background was fit to the Curie-Weiss equation and was subtracted to yield the antiferromagnetic component of the signal [figure 8(b)]. The antiferromagnetic ordering temperature associated with the Ru 4d spins is independent of frequency, which is inconsistent with canonical spin-glass behaviour [41, 42].
A spin-glass, by definition, must lack long-range order and display a frequency-dependent peak in the susceptibility [41, 42]; neither condition is satisfied in Nd2Ru2O7. Additionally, given that the rare-earth 4f-spins are decoupled from the Ru 4d-spins, the nature of the magnetic ordering is not expected to differ in the Ru2O7 (A = Pr, …Lu, Y) series as the identity of the rare-earth atom changes, so it is also unlikely that other members are spin-glasses, contrary to previous reports [8, 9, 10, 11, 12].
Adding to the confusion regarding the magnetic behaviour of Ru2O7 (A = Pr, …Lu, Y), previous studies of Nd2Ru2O7 have claimed there is ferromagnetic ordering at 20 K, and reported a hysteresis in the low-temperature field-dependent magnetization [7], neither of which were observed here in samples of 99% purity. Additionally, a later study of the specific heat of Nd2Ru2O7 showed multiple anomalies at 130 K and 20 K, in addition to the anomaly observed here at 142 K [8]. However, the ferromagnetic ordering at 20 K and the other specific heat anomalies are features of Nd3RuO7, a secondary phase that is easily formed during preparation of Nd2Ru2O7 and to which we attribute the ferromagnetic ordering and other specific heat anomalies. Extensive study of Nd3RuO7 by neutron diffraction, magnetization, and specific heat measurements has shown the material undergoes a transition with a peak at 19 K due to ordering of both Ru5+ and Nd3+ spins [43]. Additionally, there is a peak in the specific heat at 130 K, corresponding to a first-order structural phase transition. Although preparation of Ru2O7 (A = Pr, …Lu, Y) by ceramic reaction appears straightforward, care must be taken at high temperatures in air to prevent slow decomposition of the product. To demonstrate this, Nd2Ru2O7 was annealed in air at 1040∘C and 1060∘C for two weeks, and led to the formation of Nd3RuO7 as a dominant, or single phase. In the literature, preparation of Nd2Ru2O7 appears to consistently lead to appreciable amounts of Nd3RuO7 as a secondary phase, with some studies showing up to 10 mol% [9]. Due to the similar properties and chemistry of analogous Ru2O7 systems, it is not surprising to see similar features near 20 K in the magnetic susceptibility and the specific heat (e.g., ferromagnetic ordering and a -type anomaly)[8], as these features may originate from an RuO7 secondary phase.
3.3 Electrical transport in Ru pyrochlores
The nature of the electrical transport behaviour in ruthenium pyrochlores (Ru2O7) has been of considerable interest, as the nature of the A-site ion dictates whether the material will be insulating (e.g., A = Pr, …Lu, Y) or metallic (e.g., A = Tl, Pb, Bi)[3, 29, 44, 45, 46]. The most intuitive model has sought to explain the different behaviour strictly with the -site ionic radius, as increasing the -site radius increases the Ru–O–Ru bond angle. Electrical conduction takes place in the Ru2O6 network through overlap of Ru 4d and O 2p orbitals, so a larger Ru–O–Ru bond angle increases this overlap, the bandwidth, and the electrical conductivity [2, 3, 45].
Unfortunately, testing this relationship is not straightforward, as no lanthanide leads to metallic behaviour. Although the La3+ radius is similar to Bi3+ and should thus be large enough to induce metallic behaviour, La2Ru2O7 is outside the pyrochlore stability-field [1, 6, 47]. Several studies interested in the electrical conductivity of these systems have examined solid solutions with Bi or Pb to overcome this hurdle and increase the average ionic radius to the point at which the system becomes metallic [3, 22, 25, 26, 29, 48]. However, it is not appropriate to compare rare-earth Ru pyrochlores with those containing Pb or Tl (e.g. Pb2Ru2O6.5, Tl2Ru2O7-y), as these contain either A-site ions of different formal charge in the case of Pb2+, or have contributions from overlap between empty 6s states and filled states, as in the case of Tl3+. Even an isovalent substitution of by Bi3+ may not allow straightforward comparison; structural studies of Bi2Ru2O7 have shown that Bi3+ atoms are off-centered due to the stereochemically-active lone-pair [5, 24]. Indeed, Kennedy and Vogt, among others, point out that, while several structural or physical parameters of insulating Ru2O7 (A = Pr, …Lu, Y) pyrochlores tend to follow a simple trend (e.g., a linear variation in oxygen positional parameter and Ru–O bond distance as a function of lattice parameter), the behaviour of metallic ruthenium pyrochlores is aberrant [2, 25].
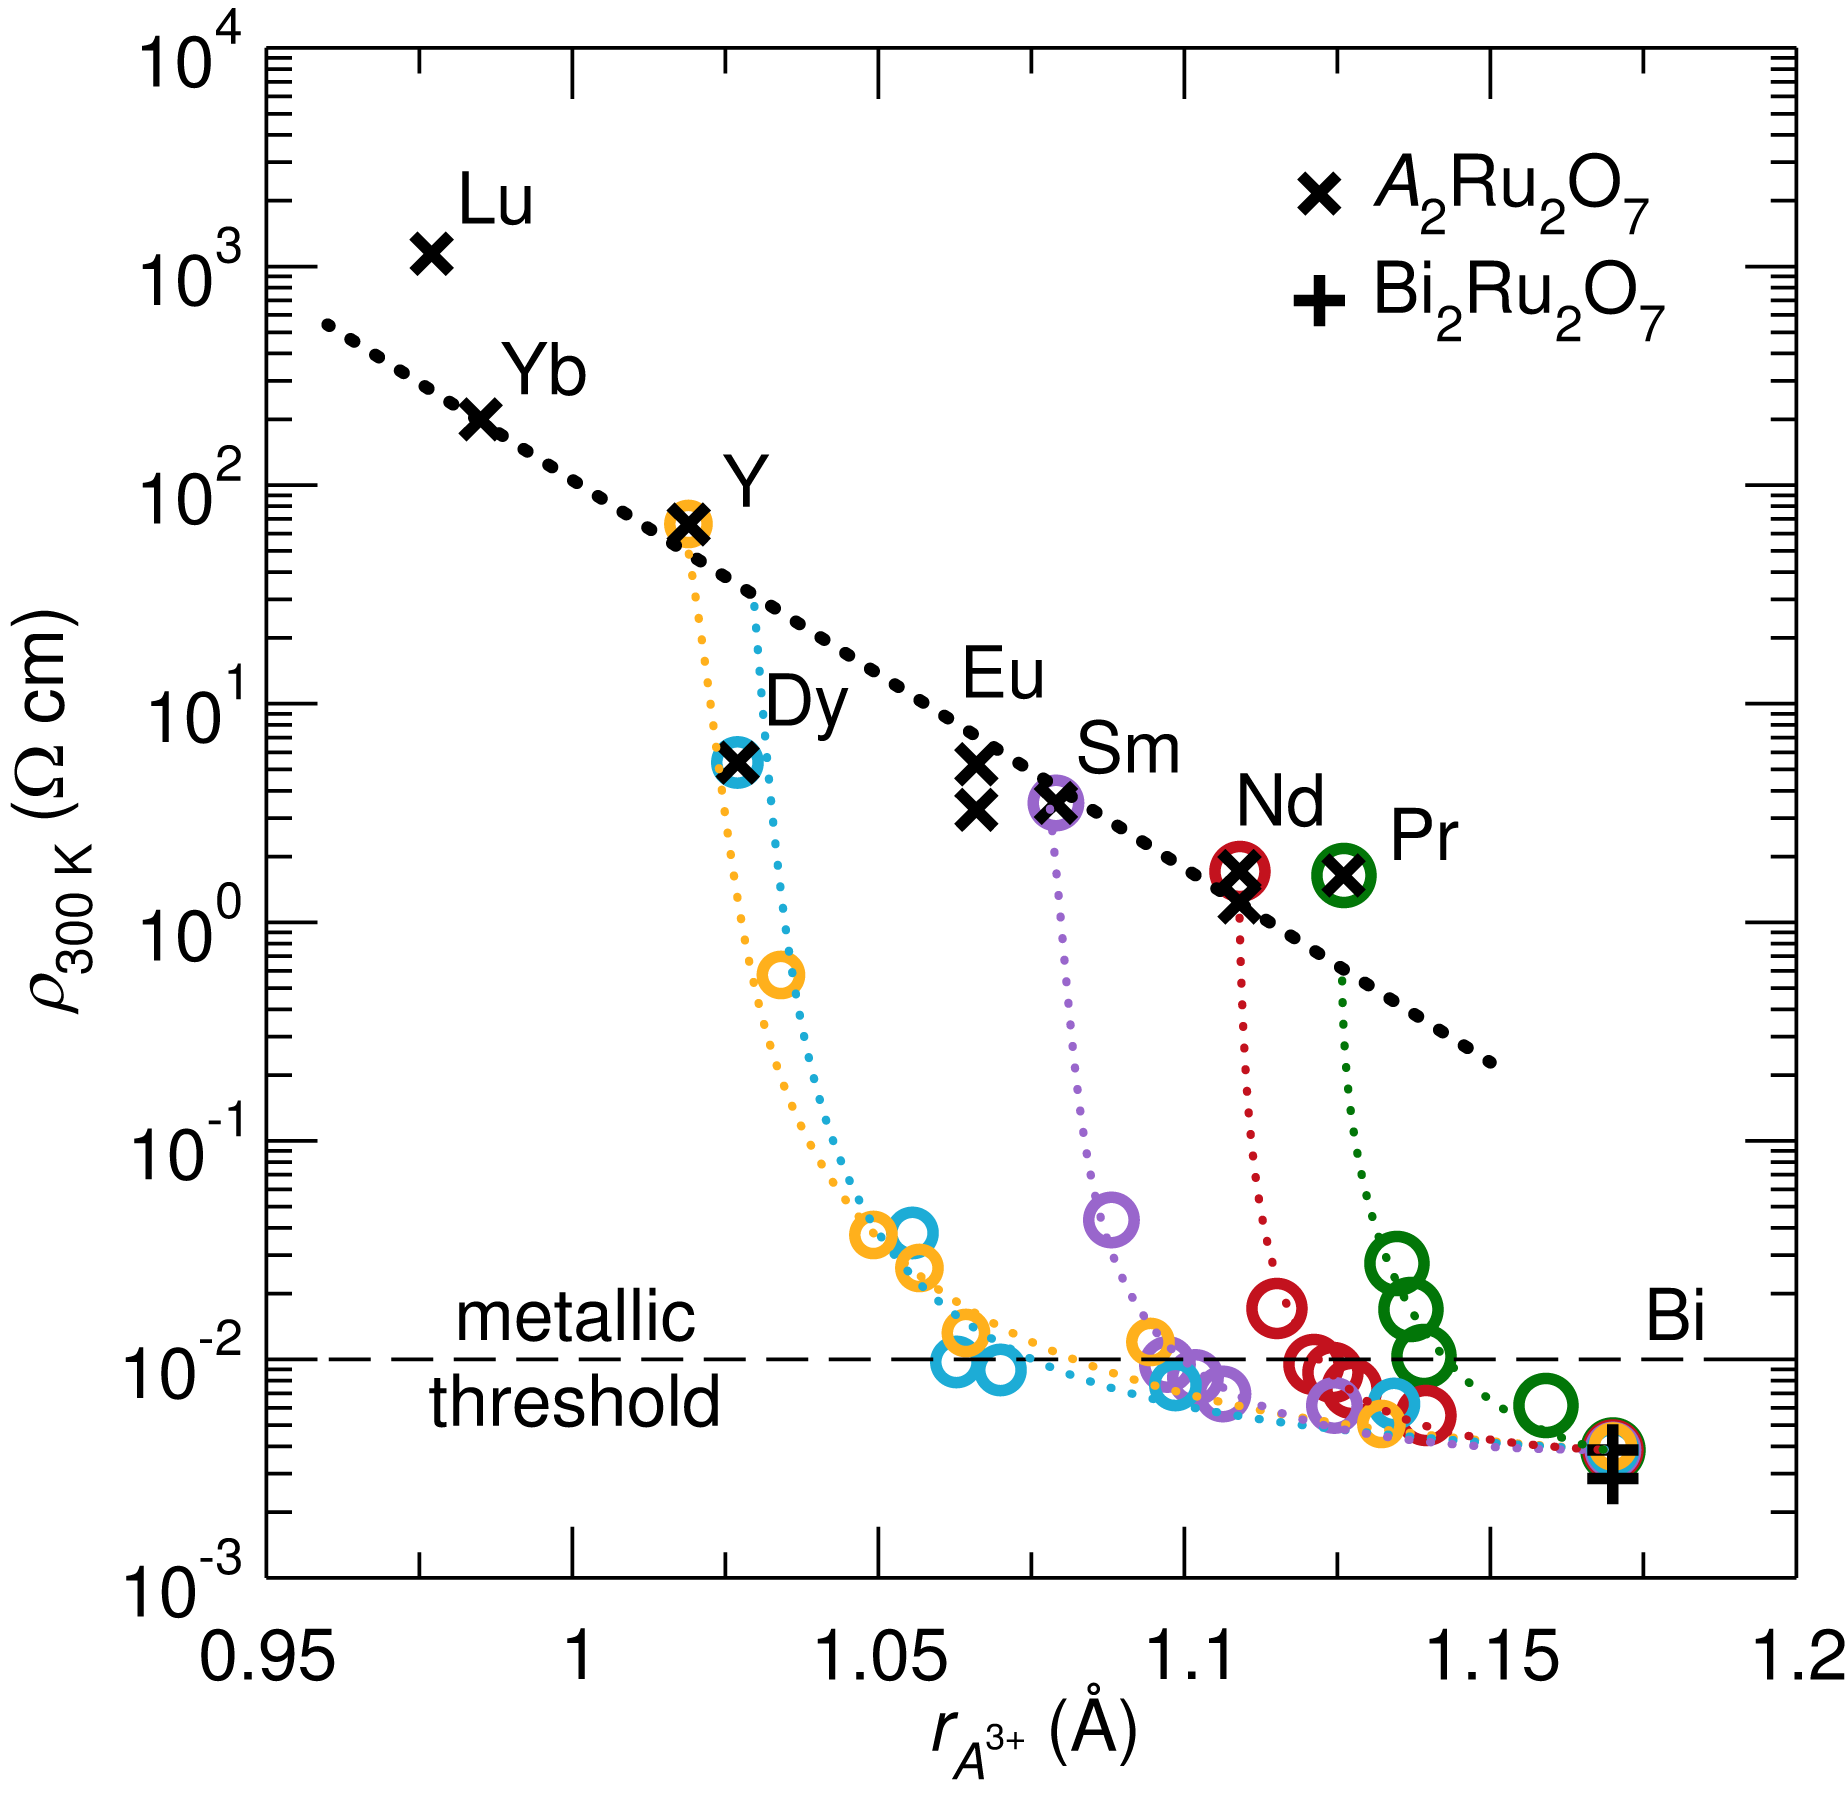
To examine the influence of the A-site ionic radius on the electrical transport, measurements of the electrical resistivity at 300 K for several Ru pyrochlore systems have been gathered and are presented in figure 9. Although examining the relationship between the Ru–O–Ru bond angle and electrical resistivity might be more direct, the lack of reliable structural data makes the number of available systems less informative. As mentioned earlier in detail, Kennedy and Vogt demonstrated the use of lab XRD has led to inaccurate determination of the O atomic position[25]. On the other hand, the ionic radius is independent of the reported crystallographic data, so it is used as the abscissa in this case. Additionally, when examining these systems and structure-property relationships, it is common to show parameters plotted vs. lattice parameter. However, the variation in lattice parameter is strongly influenced by changes in the nature of bonding, as in the case of metallic Bi2Ru2O7. For example, even though 8-coordinate Bi3+ has a larger ionic radius than Nd3+, ( Å, Å) [49], Bi2Ru2O7 has a smaller unit cell than Nd2Ru2O7 [22].
Casual examination of figure 9 suggests a monotonic decrease in the room-temperature resistivity as the ionic radius of the A site increases, when only the rare-earth-containing pyrochlores (Ru2O7, A = Pr, …Lu, Y) are considered. However, substitution with Bi dramatically changes the behaviour. The difference in electrical resistivity is truly striking, and suggests that there is more than the effect of ionic radius when Bi is incorporated into the material. We argue that local distortion of Bi centres in Ru pyrochlores is responsible for the metallic behaviour and the distinct behaviour of Bi2Ru2O7 and BixRu2O7 when contrasted with Bi-free samples. Other researchers have pointed to the presence of additional oxygen vacancies (other than the ordered vacancy dictated by the pyrochlore structure) and decreased Ru–O bond distance that accompany metallic behaviour [3, 29], though these are a result, rather than the cause, of metallic bonding.
3.4 High-temperature thermoelectric properties
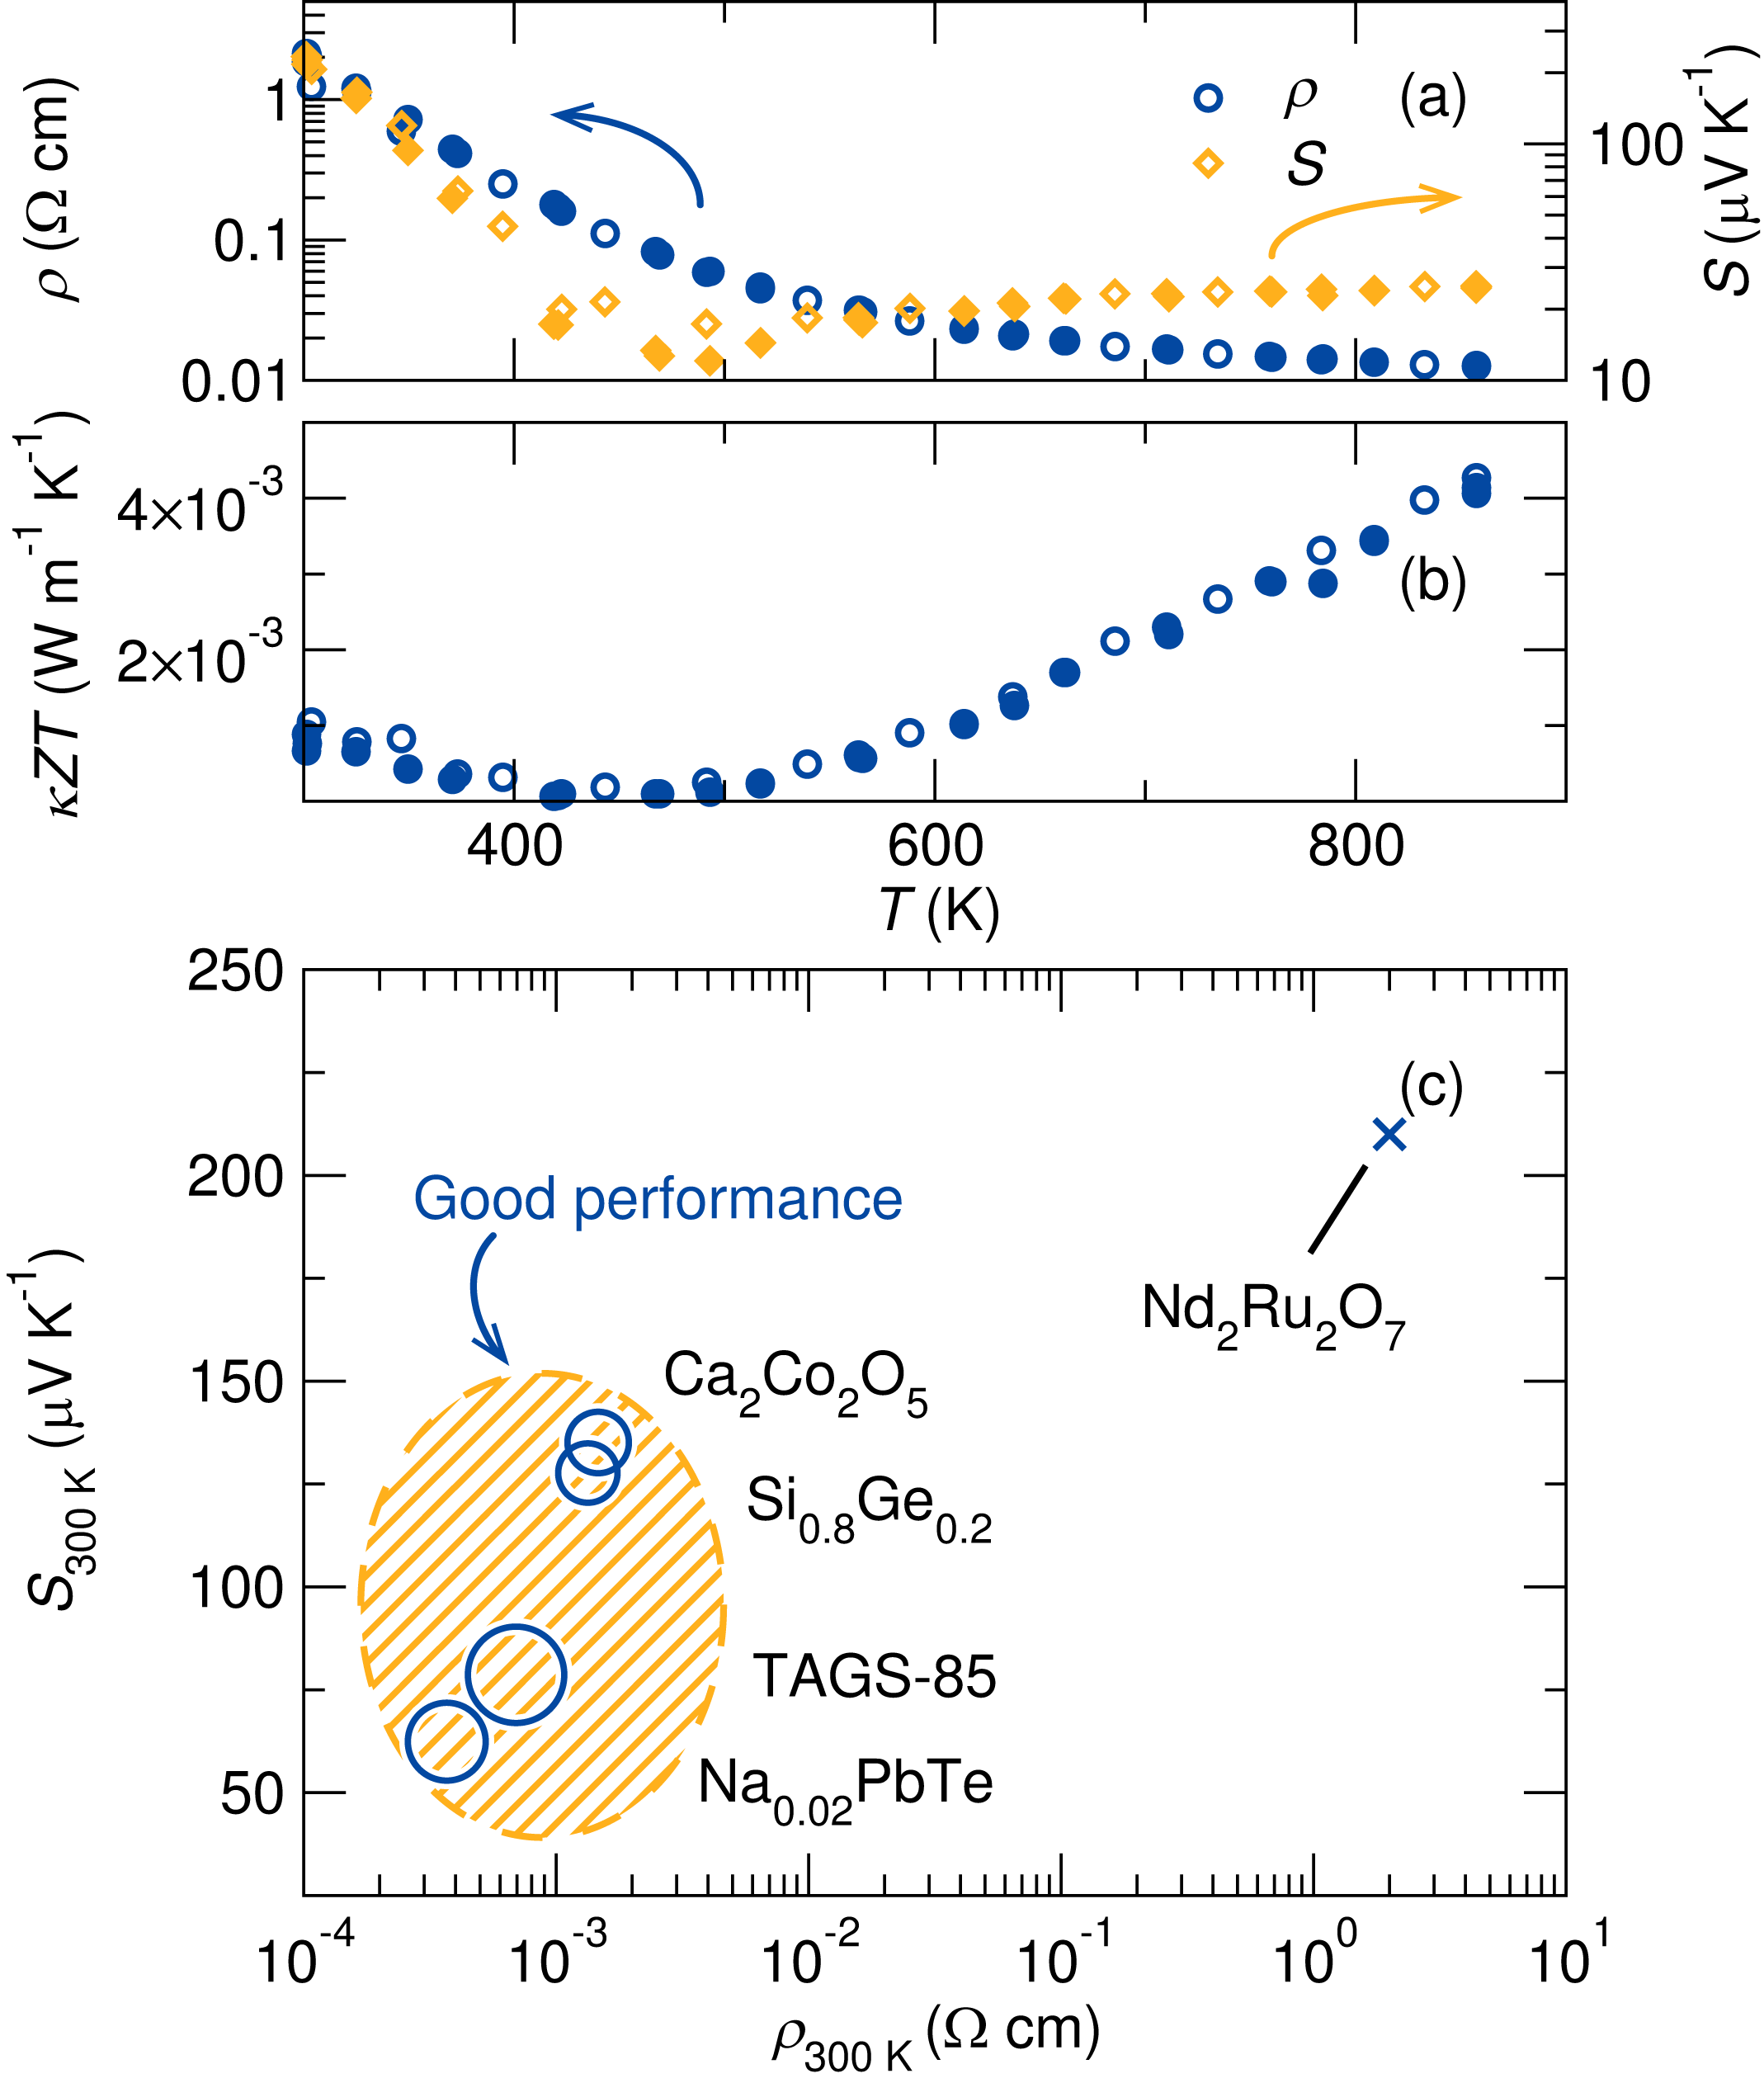
The electrical transport properties of rare-earth Ru2O7 (A = Pr …Lu, Y) members are near the onset of metallic behaviour. This unique position is a good place to examine thermoelectric properties, where there is a balance between a high Seebeck coefficient and low electrical resistivity. Electrical resistivity and Seebeck coefficient of Nd2Ru2O7 are presented from 300 K to 900 K (figure 10). The thermoelectric properties of Nd2Ru2O7 do not change over three measurement cycles, despite the low oxygen partial pressure and high temperature during measurements. The room-temperature electrical resistivity is 2.0 cm, and decreases with increasing temperature, as expected for a non-metal. The room-temperature Seebeck is promising (220 V/K), but quickly decreases with increasing temperature, and 20 V/K above 420 K. ZT is also presented [figure 10(b)], as a proxy for the thermoelectric figure of merit, and is several orders of magnitude too small for Nd2Ru2O7 to be a competitive thermoelectric material. The thermoelectric figure of merit, ZT, is given by and is a function of the Seebeck coefficient S, electrical resistivity , thermal conductivity , and temperature T. Many materials exhibit a thermal conductivity between 1 W m-1K-1 and 10 W m-1K-1, so ZT is a useful proxy to compare the electrical performance of thermoelectric materials and estimate ZT within an order of magnitude.
Following our investigation of Nd2Ru2O7 and learning of its low ZT at high temperatures, we realized that a simple analytical method for estimating the competitiveness of a thermoelectric at high temperatures would be useful for identifying new candidate materials. Such a method would be especially helpful if it did not require high-temperature measurements, as this would save time and resources. Many materials are currently being screened for high-temperature thermoelectric performance, but measurements at elevated temperatures require specialized instrumentation that is not widely available. Room-temperature Seebeck measurements can be performed quickly and with less sophisticated equipment. Additionally, low-temperature (i.e., T 300 K) Seebeck and electrical resistivity data are available in the literature for many materials, and could be used to quickly eliminate materials that are likely to have poor thermoelectric performance.
Towards this end, a new type of plot is presented in figure 10(c), where the room-temperature Seebeck () is plotted versus the room-temperature electrical resistivity (). The radius of a data point represents the magnitude of ZT at an arbitrary temperature that is common among the data points, and allows easy comparison of the expected thermoelectric performance at that temperature. When examining Nd2Ru2O7 and its relation to other high-temperature -type materials at 700 K using the aforementioned survey plot [figure 10(c)], high-performance materials are clustered in one region of the plot (filled area) while Nd2Ru2O7 is isolated. In particular, the location of Nd2Ru2O7 indicates the room-temperature electrical resistivity is too high. Because the ZT of Nd2Ru2O7 is very small and leads to a vanishingly small point, it is represented by the symbol in figure 10(c).
This type of analysis is particularly useful in establishing that the performance of a particular class of materials may be ineffectual due to a key property being outside the useful range. The choice of axes is similar to a Jonker plot, in which the Seebeck coefficient is plotted vs. electrical conductivity. Jonker plots are used to examine the effect of changing the carrier concentration of a single material rather than looking at a field of candidate thermoelectics [58, 59]. Also, while Zhu et al. have shown that Jonker plots could be used to to estimate the peak thermoelectric power factor () of a material [60], other analyses are involved, and the approach is distinct from the one employed here.
4 Conclusion
Pyrochlore Nd2Ru2O7 has been prepared and examined using a combination of structural, magnetic, and electrical and thermal transport studies. Some substitutional disorder on the A-site is proposed from the structural studies, but is not anticipated to strongly influence the physical properties. The magnetic behaviour of Nd2Ru2O7 has been clarified through a combination of DC and AC magnetic measurements, and heat capacity studies. Despite the potential for geometric frustration of magnetism in the pyrochlore structure-type, we find no such exotic behaviour or glassiness in Nd2Ru2O7 and instead tentatively suggest it is a canted antiferromagnet that displays weak ferromagnetism. When the electrical transport properties are regarded in light of published data on rare-earth substituted Ru2O7 pyrochlores, it is clear that ionic radius plays a key role in determining electrical behaviour. However, the metallic electrical properties that accompany incorporation of Bi3+ on the A-site lies outside this description, and we suggest Bi3+ off-centering may drive this anomalous behaviour. High temperature measurements of the thermoelectric properties indicate that Nd2Ru2O7 has excessively high electrical resistivity for it to be a useful thermoelectric, despite displaying a promising Seebeck coefficient at room temperature. We propose a modified version of the Jonker plot as a powerful tool to screen candidate thermoelectric materials. We find that it is particularly useful in establishing that a particular materials class may be ineffectual due to a key property being outside the useful range.
References
References
- [1] Subramanian M A, Aravamudan G and Rao G V S 1983 Prog. Solid State Chem. 15 55–143
- [2] Lee K S, Seo D K and Whangbo M H 1997 J. Solid State Chem. 131 405–408
- [3] Li L Q and Kennedy B J 2003 Chem. Mater. 15 4060–4067
- [4] Cox P A, Egdell R G, Goodenough J B, Hamnett A and Naish C C 1983 J. Phys. C: Solid State Phys. 16 6221–6239
- [5] Shoemaker D P, Seshadri R, Tachibana M and Hector A L 2011 Phys. Rev. B 84 064117
- [6] Gardner J S, Gingras M J P and Greedan J E 2010 Rev. Mod. Phys. 82 53–107
- [7] Taira N, Wakeshima M and Hinatsu Y 1999 J. Phys.: Cond. Matter 11 6983–6990
- [8] Taira N, Wakeshima M and Hinatsu Y 2000 J. Solid State Chem. 152 441–446
- [9] Ito M, Yasui Y, Kanada M, Harashina H, Yoshii S, Murata K, Sato M, Okumura H and Kakurai K 2000 J. Phys. Soc. Jpn. 69 888–894
- [10] Ito M, Yasui Y, Kanada M, Harashina H, Yoshii S, Murata K, Sato M, Okumura H and Kakurai K 2001 J. Phys. Chem. Solids 62 337–341
- [11] Kmiec R, Swiatkowska Z, Gurgul J, Rams M, Zarzycki A and Tomala K 2006 Phys. Rev. B 74 104425
- [12] Gurgul J, Rams M, Swiatkowska Z, Kmiec R and Tomala K 2007 Phys. Rev. B 75 064426
- [13] Snyder G J and Toberer E S 2008 Nat. Mater. 7 105–114
- [14] Tritt T M and Subramanian M A 2006 MRS Bull. 31 188–194
- [15] Terasaki I, Sasago Y and Uchinokura K 1997 Phys. Rev. B 56 R12685–R12687
- [16] He J, Liu Y and Funahashi R 2011 J. Mater. Res. 26 1762–1772
- [17] Skrabalak S E and Suslick K S 2006 J. Am. Chem. Soc. 128 12642–12643
- [18] Misch L M, Kurzman J A, Derk A R, Kim Y I, Seshadri R, Metiu H, McFarland E W and Stucky G D 2011 Chem. Mater. 23 5432–5439
- [19] Wang J, Toby B H, Lee P L, Ribaud L, Antao S M, Kurtz C, Ramanathan M, Von Dreele R B and Beno M A 2008 Rev. Sci. Instrum. 79 085105
- [20] Qiu X, Thompson J W and Billinge S J L 2004 J. Appl. Crystallogr. 37 678–678
- [21] Farrow C L, Juhas P, Liu J W, Bryndin D, Bozin E S, Bloch J, Proffen T and Billinge S J L 2007 J. Phys.: Condens. Matter 19 335219
- [22] Yamamoto T, Kanno R, Takeda Y, Yamamoto O, Kawamoto Y and Takano M 1994 J. Solid State Chem. 109 372–383
- [23] Vanderah T A, Levin I and Lufaso M W 2005 Eur. J. Inorg. Chem. 2005 2895–2901
- [24] Avdeev M, Haas M K, Jorgenson J D and Cava R J 2002 J. Solid State Chem. 169 24–34
- [25] Kennedy B J and Vogt T 1996 J. Solid State Chem. 126 261–270
- [26] Kanno R, Takeda Y, Yamamoto T, Kawamoto Y and Yamamoto O 1993 J. Solid State Chem. 102 106–114
- [27] Baldinozzi G, Berar J F, Gautier-Soyer M and Calvarin G 1997 J. Phys.: Cond. Matter 9 9731–9744
- [28] Momma K and Izumi F 2011 J. Appl. Crystallogr. 44 1272–1276
- [29] Field M, Kennedy B J and Hunter B A 2000 J. Solid State Chem. 151 25–30
- [30] Sears V F 1992 Neutron News 3 26–37
- [31] Hamilton W C 1965 Acta Crystallogr. 18 502–510
- [32] Kurzman J A, Ouyang X, Bin Im W, Li J, Hu J, Scott S L and Seshadri R 2010 Inorg. Chem. 49 4670–4680
- [33] Melot B C, Drewes J E, Seshadri R, Stoudenmire E M and Ramirez A P 2009 J. Phys.: Cond. Matter 21 216007
- [34] Ramirez A P 1994 Annu. Rev. Mater. Sci. 24 453–480
- [35] Matsuhira K, Wakeshima M, Nakanishi R, Yamada T, Nakamura A, Kawano W, Takagi S and Hinatsu Y 2007 J. Phys. Soc. Jpn. 76 043706
- [36] Freamat M, Lin X N, Durairaj V, Chikara S, Cao G and Brill J W 2005 Phys. Rev. B 72 014458
- [37] Kittel C 2005 Introduction to solid state physics 8th ed (Hoboken, NJ: Wiley)
- [38] Blundell S 2001 Magnetism in condensed matter (Oxford: Oxford University Press)
- [39] Mott N F 1968 J. Non-Cryst. Solids 1 1–17
- [40] Rosenbaum R, Lien N V, Graham M R and Witcomb M 1997 J. Phys.: Cond. Matter 9 6247–6256
- [41] Fischer K H 1985 Phys. Status Solidi B 130 13–71
- [42] Binder K and Young A P 1986 Rev. Mod. Phys. 58 801–976
- [43] Harada D, Hinatsu Y and Ishii Y 2001 J. Phys.: Cond. Matter 13 10825–10836
- [44] Takeda T, Nagata M, Kobayashi H, Kanno R, Kawamoto Y and Takano M 1998 J. Solid State Chem. 140 182–193
- [45] Ishii F and Oguchi T 2000 J. Phys. Soc. Jpn. 69 526–531
- [46] Tachibana M, Kohama Y, Shimoyama T, Harada A, Taniyama T, Itoh M, Kawaji H and Atake T 2006 Phys. Rev. B 73 193107
- [47] Cai L, Arias A L and Nino J C 2011 J. Mater. Chem. 21 3611–3618
- [48] Kobayashi H, Kanno R, Kawamoto Y, Kamiyama T, Izumi F and Sleight A W 1995 J. Solid State Chem. 114 15–23
- [49] Shannon R D 1976 Acta Crystallogr., Sect. A 32 751–767
- [50] Bouchard R J and Gillson J L 1971 Mater. Res. Bull. 6 669–680
- [51] Munoz-Perez S, Cobas R, Cadogan J M, Albino Aguiar J, Bonville P, Puig T and Obradors X 2012 J. Appl. Phys. 111 07E150
- [52] Beyerlein R A, Horowitz H S and Longo J M 1988 J. Solid State Chem. 72 2–13
- [53] Sleight A W and Bouchard R J 1972 NBS Special Publication 364 227–232
- [54] Funahashi R, Matsubara I, Ikuta H, Takeuchi T, Mizutani U and Sodeoka S 2000 Jpn. J. Appl. Phys., Part 2 39 L1127–L1129
- [55] Vining C B, Laskow W, Hanson J O, Vanderbeck R R and Gorsuch P D 1991 J. Appl. Phys. 69 4333–4340
- [56] Rowe D M 1995 CRC handbook of thermoelectrics (Boca Raton, FL: CRC Press)
- [57] Pei Y, Shi X, LaLonde A, Wang H, Chen L and Snyder G J 2011 Nature 473 66–69
- [58] Jonker G H 1968 Philips Res. Rep. 23 131–138
- [59] Bak T and Nowotny J 2011 J. Phys. Chem. C 115 9746–9752
- [60] Zhu Q, Hopper E M, Ingram B J and Mason T O 2011 J. Am. Ceram. Soc. 94 51–57