Coherent absorption and enhanced photoluminescence in thin layers of nanorods
Abstract
We demonstrate a large light absorptance (80%) in a nanometric layer of quantum dots-in-rods (QRs) with a thickness of 23 nm. This behavior is explained in terms of the coherent absorption by interference of the light incident at a certain angle onto the very thin QR layer. We exploit this coherent light absorption to enhance the photoluminescent emission from the QRs. Up to a seven- and five-fold enhancement of the photoluminescence is observed for p- and s-polarized incident light, respectively.
pacs:
42.25.Bs, 42.25.Hz, 42.25.Kb, 81.07.Ta, 61.46.Km, 42.82.EtI Introduction
With the development of nanotechnologies it has become possible to scale down the dimensions of electro-optical devices. For certain applications, e.g., in photovoltaics and photodetection, it has become crucial to find new methods to enhance the optical absorption in ultra-thin layers of different materials. Stuart1996 ; Atwater2010 Consequently, enhanced optical absorption by nanostructures and metamaterials has been intensively investigated in recent years. Stuart1996 ; Shaadt05 ; Panoiu07 ; Landy2008 ; Bandiera2008 ; Driessen09 ; Aubry2010 The concept of Coherent Perfect Absorption (CPA) has been recently introduced. Wan11 In particular, it has been shown that is possible to trap a narrow window of wavelengths of counter propagating beams inside a thick slab of a given material through the realization of interference. Chong10 CPA is, thus, described as a combination of interference and dissipation.
In this article we exploit the CPA concept by making use of the Attenuated Total Reflectance (ATR) technique. Our structure consists of an ultra-thin layer of absorbing material, with a thickness of 23 nm. We choose colloidal quantum dots in rods (QRs) as the constituent material of the layer. Quantum dots are a class of materials with characteristic optical properties, such as the tunability of their emission spectrum, and their high quantum efficiency if their surface is well passivated. Reiss09 We have designed the sample and the experiment such that an efficient conversion of incident light into pholuminescence is achieved by means of enhanced absorption. In particular, we demonstrate a significant enhancement of the absorptance of the incident light at =457 nm onto the layer (80% for s-polarized light and 70% for p-polarized light) at a certain angle of incidence, which leads to a seven- and five-fold enhancement of the QR photoluminescence for p- and s-polarized excitation respectively.
ATR is an extended technique used to couple plane waves to
evanescent modes in which a prism is used to enable this coupling. A
typical ATR measurement is characterized by a minimum in the
specular reflectance at an angle of incidence larger than the
critical angle for total internal reflection at the prism-structure
interface. An interpretation for the ATR resonance, based on quantum
interference, has been provided: Herminghaus94 ; Boardman82
when the momentum-matching condition between the incident wave and
the evanescent mode is realized an additional photon path, besides
the radiative scattering, opens. The relation between this
interpretation and the CPA is provided by the interference nature of
the two phenomena. In the ATR experiment, the interference is due to
the superposition of the probability amplitudes of two events: the
photon scattered out because of the total internal reflection, and
the same photon coupled first into an evanescent mode and coupled
out into radiation. In the resonant condition the radiative damping
of the evanescent mode equals the internal damping due to losses in
the material, and all the light is absorbed. The quantum
interpretation can be rephrased classically in terms of interference
of electromagnetic waves, in which the first photon path corresponds
to the reflected wave at the prism-structure interface and the
second one to the leaky wave associated with the evanescent
mode. Raether This classical interpretation is similar to the
so-called critical coupling by which it is possible to perfectly
transfer energy between two optical media. Yariv00 ; Yariv02
Similarly to ATR, in the critical coupling theory, also there is a
relation between the internal and the out-coupling losses, namely,
when they are equal it is possible to absorb 100% of the incident
light. Choi01
CPA, ATR and critical coupling are phenomena
characterized by a general scheme, i.e., in all of them optical
interference and dissipation lead to an efficient electromagnetic
energy transfer into a structure and an enhanced absorption. In our
experiments the structure to which we want to transfer the energy is
the QR layer.
II Sample preparation and characterization
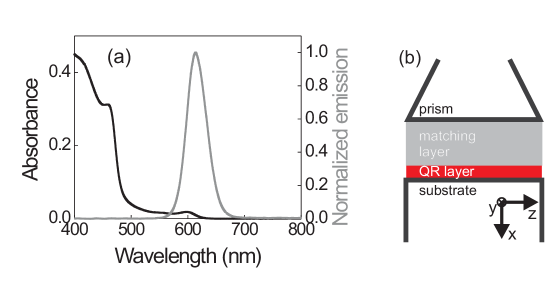
We have used CdSe/CdS quantum dots-in-rods as the constituents of the nanometric layer. The QRs have been synthesized following the procedure described in Ref. Carbone07 . They have an average length of 36 nm and an average diameter of 4 nm. The absorbance and normalized emission spectra of as grown CdSe/CdS nanorods in suspension in toluene is shown in Fig. 1(a). The large ratio between absorbance at =460 nm and at =611 nm limits the self-absorption. The quantum efficiencies of the QRs suspended in toluene and forming a layer in air have been determined to be and , respectively. The reduction of photoluminescence quantum efficiency of the rods in the layer is explained by the increased probability for energy transfer between adjacent rods. In particular, an exciton in a close-packed QR layer has a higher probability to end up in a non-emitting rod, which leads to a decrease of the quantum efficiency of the ensemble of nanorods.
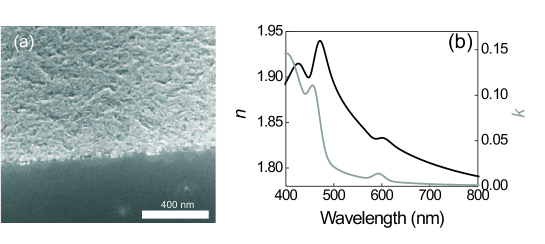
Since our goal is to exploit the CPA principle in the ATR configuration, we have fabricated a sample with the structure schematically represented in Fig. 1 (b). A suspension of quantum dots-in-rods in toluene is spin-coated on top of a silica substrate with a refractive index of 1.45. After baking the sample for 2 minutes at C, a high-density layer of QRs with a thickness of 23 nm is formed on the substrate. Figure 2 (a) displays a scanning electron microscope (SEM) image of the layer tilted in order to appreciate its thickness. A silica layer with refractive index 1.46 and a thickness of 350 nm, indicated as matching layer in Fig. 1 (b), is evaporated on top of the QR layer. The thickness and refractive index of this layer are critical to achieve coherent absorption in the QR layer. The optical constants and the thicknesses of the QR and matching layers have been determined with spectroscopic ellypsometry. Figure 2(b) displays ellypsometry measurements of the real, (black curve), and imaginary, (gray curve), components of the refractive index of the QR layer. Two peaks are visible at =460 nm and =600 nm in the curve of the imaginary component of the refractive index. These peaks correspond to absorption due to resonant excitation of excitons in CdS and CdSe respectively.
An F2 Schott optical glass prism, with refractive index 1.62 at nm, on top of the sample is used in the ATR configuration. In order to obtain a good optical contact between the prism and the matching layer and to avoid multiple reflections that will destroy the interference in the QR layer, we have used a refractive-index-matching liquid with the same refractive index as F2.
III Reflection and absorption measurements
The ATR measurements were performed as follows: The prism was illuminated with a collimated s- or p-polarized beam from a halogen lamp, varying the angle of incidence, . The detector was placed at the angle of specular reflection. The specular reflection was measured in steps of by rotating the sample and a multimode optical fiber coupled to a spectrometer with a computer controlled rotation stage. In order to obtain the specular reflectance (R) of the QR layer, the reflection measurements were normalized by the reflection from an angle above the critical angle for total internal reflection at the prism-matching layer interface, i.e., an angle at which the reflectance is 1. For angles larger than the critical angle the transmission through the sample was negligible.
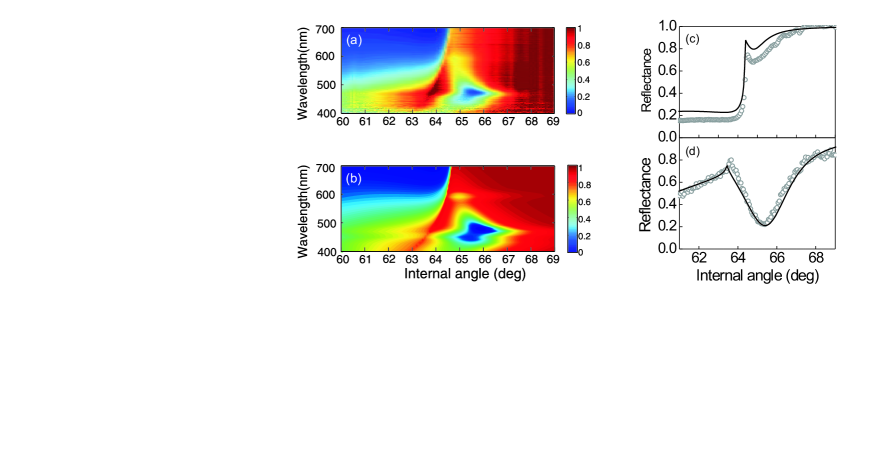
In Fig. 3 we display the measured (a) and the calculated (b) specular reflectance (color scale) for s-polarized light as a function of the angle of incidence and the wavelength. The calculation has been performed using the transfer matrix method for a multilayer structure. Yeh In these calculations we have fixed the thickness and refractive index of the QR and matching layer as derived from the ellipsometry measurements. Therefore, we do not use any free parameter to fit the measurements. Figures 3 (c) and 3 (d) display cuts of the reflectance measurements (open circles) and calculations (solid curves) at 611 nm and 457 nm, respectively. These wavelengths correspond to the wavelength of maximum emission of the QRs and to the wavelength used to excite the QRs in the photoluminescence experiments shown in the next section. The strong increase in the reflectance for angles larger than is due to the total internal reflection at the prism-matching layer interface above the critical angle ( for =700 nm). The pronounced dip in reflectance around and =450 nm is due to the coherent absorption. The excellent agreement between measurements and calculations confirms the validity of the transfer matrix method to describe the light scattering in the multilayer structure. This remarkable result, in view of the inhomogeneities in the QR layer [see Fig. 1(b)], can be explained from the fact that ellipsometryc measurements include the effect of the roughness as an effective property of the layer.
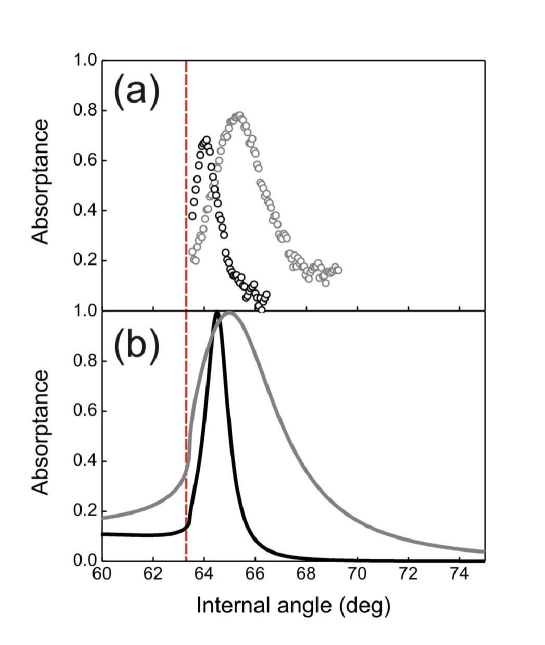
For angles larger than the critical angle we estimate the experimental absorptance in the QR layer as 1-R, assuming that the transmittance through the sample in this angular range is negligible. Figure 4(a) displays with open circles the s- (black circles) and p-polarized (grey circles) absorptance for at =457 nm. The dotted vertical line in this figure indicates the critical angle. The maximum in absorptance reaches the extraordinarily large value of 80% at and 70% at for s- and p-polarized illumination, respectively. This is a remarkable result considering that absorption takes place only in the 23nm-thick QR layer. The shift of the maximum in absorptance between s- and p-polarized light can be explained by the different phase shifts in the reflection at the interfaces for the two polarizations that modifies the interference condition for coherent absorption. We note that the absorption length, i.e., the length over which the intensity decreases by a factor 1/e under plane wave illumination, at =457 nm in a thick layer of a material with the refractive index of the QR layer is on the order of 350 nm for both polarizations. Therefore, coherent absorption in the QR layer leads to a reduction of the absorption length by more than 1 order of magnitude.
In Fig. 4(b), we plot the calculated absorptance at = 457 nm for s-polarization (gray curve) and p-polarization (black curve) using optimized values for the thicknesses of the matching layer to achieve perfect absorptance at a certain angle. This thickness corresponds to 480 nm for p-polarization and 230 nm for s-polarization. The difference in the two optimum thicknesses is due to the different amplitudes and phases of the fields reflected at each interface of the multilayer structure for p- and s-polarization. This difference makes it impossible to achieve 100% absorption for unpolarized light in a single sample. Nevertheless, the sample used in our experiments, with a matching layer of 350 nm, exhibits a significant enhancement of the absorption for both polarizations. We note from the measurements of Fig. 4 (a) and (b) that with the non-optimum thickness of the matching layer we are not truly fulfilling the condition for critical coupling. The maximum absorptance equals 80% which indicates a 20% radiation loss in the experiment.
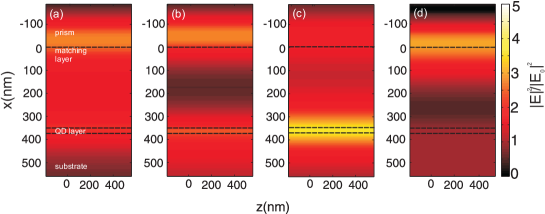
The interference mechanism leading to the coherent absorption in the QR layer can be appreciated by calculating the field intensity in the multilayer structure. This calculation is displayed in Fig. 5 for s-polarized incident light with a wavelength of 457 nm at four different angles, namely, (a), (b), (c) and (d). The color scale in these figures represents the spatial distribution of the field intensity normalized by the incident intensity. The absorbed electromagnetic power in a medium is given by , Landau84 where is the angular frequency of the wave, is the imaginary component of the permittivity of the medium and E is the total electric field where the overbar indicates the time average over a period. In our system the only absorbing material with is the QR layer and the integral needs to be evaluated in the volume occupied by this layer. At [Fig. 5(a)] the field intensity in the QR layer is low. Therefore, for this angle of incidence also the absorptance in the QR layer is low. At [Fig. 5(b)] the angle of incidence approaches the angle for coherent absorption. Consequently, the field intensity in the QR layer is higher. The normalized field intensity is also high at the prism-matching layer interface due to total internal reflection. This situation changes drastically at (Fig. 5(c)), where the coherent absorption condition is reached. For this angle of incidence the fields interfere constructively in the QR layer where the intensity increases. This field enhancement in the layer leads also to the enhancement of the absorbed power in the otherwise weakly absorbing QRs. For this angle of incidence, we observe a reduction of the intensity at all locations other than the QR layer. This reduction is the result of the concomitant destructive interference required by the conservation of energy. At the absorptance is low [Fig. 5(d)]. For this angle the normalized field intensity in the QR layer is also low, while at the prism-matching layer interface it is maximum due to total internal reflection.
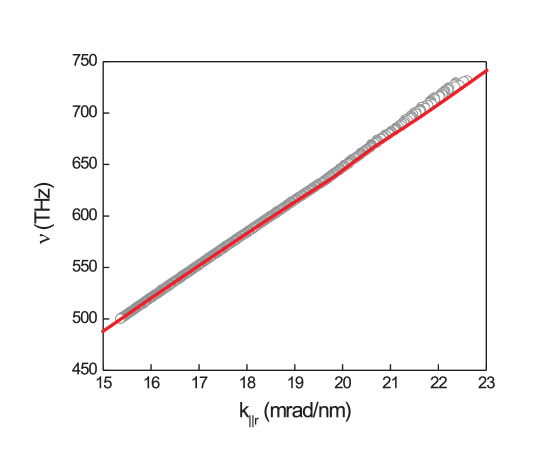
A description of the mechanism leading to coherent absorption in our system, related to the aforementioned description of ATR, considers the coupling of the incident radiation into the quasi-bounded fundamental mode supported by a lossy waveguide. The waveguide is defined by the QR layer with an effective index of refraction larger than the surrounding media and the losses are given by absorption in the layer and through radiation into the prism. To illustrate this explanation, we have calculated the eigenfrequencies associated with the fundamental transverse electric field eigenmode (TE0 mode) of a waveguide with a thickness of 23 nm and a permittivity equal to the effective permittivity of the QR layer obtained from ellipsometry. The effect of the roughness was taken into account in these calculations since the imaginary component of the effective refractive index, obtained from ellipsometry, includes a reduction in the intensity of the specular reflection due to both absorption and scattering in the QR layer. The eigenfrequencies are represented as a function of the wavenumber of the mode in the dispersion diagram shown in Fig. 6 with the solid line. In these calculations, we consider the layer embedded in a homogenous dielectric, i.e., we do not consider the prism. Despite this approximation there is a good agreement with the measured data represented by the open circles in Fig. 5. These measurements have been obtained from the attenuated total reflectance data (Fig. 3) by determining the wavelengths and angles of minimum reflectance and representing them as a function of the frequency, , and the in-plane wavevector, . The minimum in the reflectance measurements of Fig. 3 (d) can be described as the result of destructive interference between the leakage radiation of the TE0 mode through the prism and the specular reflection of the incident beam at the prism-matching layer interface.
IV Photoluminescence
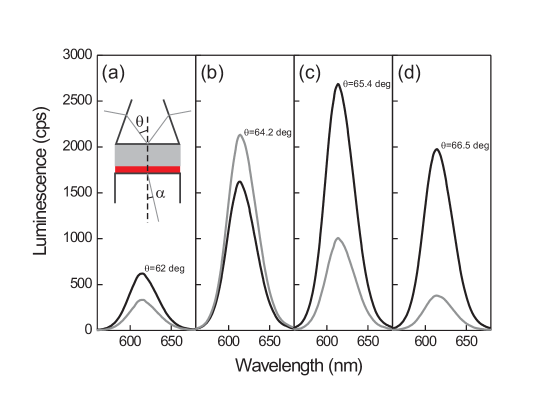
Coherent absorption can be exploited to enhance the photoluminescence from the QR layer. The inset of Fig. 7 (a) shows a schematic representation of the experimental configuration used in the photoluminescence experiments. The angle of incidence is varied in these measurements, while the direction of detection, defined by the angle between the normal to the layer and the detector, is kept fixed at . The QR layer was excited with a nm laser and incident power of 1.6 mW, using both s- and p-polarization. The emission was collected without polarization selection. From the reflection measurements of Fig. 3(a), we can conclude that the sample does not exhibit any resonance above 600 nm. The QR photoluminescence at these wavelengths follows a Lambertian curve as a function of the emission angle. This Lambertian emission was confirmed in angular dependent emission experiments (not shown here). In Fig. 7 are shown the spectra taken for different values of the angle of incidence, , and polarizations. Black curves correspond to s-polarized incidence and gray curves to p-polarized incidence. Figure 7 (a) shows the photoluminescence intensity for , i.e., for an illumination angle below the critical angle. Figures 7 (b) and (c) correspond to the angles of illumination at which maximum absorption at =457 nm is achieved in the QR layer for p- and s-polarization respectively, i.e., and . An increased emission is achieved at the angles of incidence at which coherent absorption is observed. Figure 7 (d) shows the photoluminescence emission due to evanescent excitation of the QR layer at .
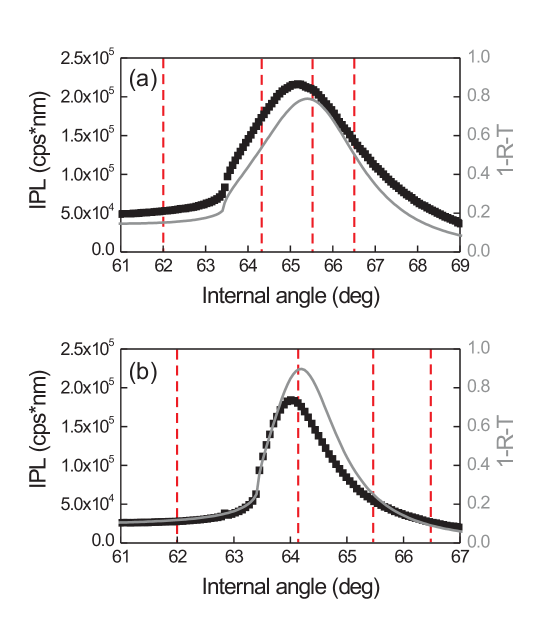
To directly correlate the absorptance to the photoluminescence enhancement, we have plotted in Fig. 8 (a) and (b) the absorptance at =457 nm (solid curves) and the photoluminescence intensity integrated from 550 nm to 670 nm (squares), as a function of the angle of incidence for s- and p- incident polarization, respectively. The dashed vertical lines correspond to the angles of Fig. 7 (a-d). As expected, the enhancement of photoluminescence is directly related to the enhancement of the absorption at the excitation wavelength of the QRs. It is possible to evaluate an enhancement factor of the photoluminescence by dividing the value of the integrated intensity at the angle of maximum emission by the intensity at an angle lower than the angle of total internal reflection. Enhancement factors of 4.6 and 6.8 at =457 nm are obtained for s- and p- polarization, respectively.
V Conclusions
We have demonstrated experimentally an absorptance up to 80% for s-polarized light and 70% for p-polarized light at nm in a 23nm-thick layer of quantum dots-in-rods. This extraordinary absorption is explained in terms of coherent absorption: The incident light is trapped in the layer due to the constructive interference of the fields scattered at different interfaces. The enhanced absorption is efficiently converted into photoluminescence from the QR layer. We have obtained a seven-fold enhancement of the QR emission for p-polarized incident light and a five-fold emission enhancement for s-polarized incident light as a result of the coherent absorption in the layer. This enhancement can be further increased by optimizing the interference in the multilayer structure. Enhanced optical absorption in nanometric layers is relevant for applications in various fields such as photovoltaics and sensitive photodetection.
VI Acknowledgement
This work was supported by the Netherlands Foundation Fundamenteel Onderzoek der Materie (FOM) and the Nederlandse Organisatie voor Wetenschappelijk Onderzoek (NWO), the Nanonext consortium and is part of an industrial partnership program between Philips and FOM. This research has also received funding from the European Community’s Seventh Framework Programme under Grant Agreement no. 214954. G. Lozano thanks NanoNextNL for funding his postdoctoral contract.
References
- [1] H.R. Stuart and D.G. Hall, Appl. Phys. Lett.69, 2327 (1996).
- [2] H. Atwater and A. Polman, Nature Materials 9, 205 (2010).
- [3] D.M. Schaadt, B. Feng, and E.T. Yu, Appl. Phys. Lett. 86, 063106 (2005).
- [4] N. C. Panoiu and R. M. Osgood, Opt. Lett. 32, 2825 (2007).
- [5] E.F.C. Driessen and M.J.A de Dood, Appl. Phys. Lett. 94, 171109 (2009).
- [6] N. I. Landy, S. Sajuyigbe, J.J. Mock, D.R. Smith, and W.J. Padilla, Phys. Rev. Lett. 100, 207402 (2008)
- [7] S. Bandiera, D. Jacob, T. Muller, F. Marquier, M. Laroche, and J.-J. Greffet, Appl. Phys. Lett. 93, 193103 (2008).
- [8] A. Aubry, D.Y. Lei, A.I. Fernandez-Dominguez, Y. Sonnefraud, S.A. Maier, and J.B. Pendry, Nano Lett. 10, 2574 (2010).
- [9] W. Wan, Y. Chong, L. Ge, H. Noh, A.D. Stone, and H. Cao, Science 331, 889 (2011).
- [10] Y.D. Chong, L. Ge, H. Cao, and A.D. Stone, Phys. Rev. Lett. 105, 053901 (2010).
- [11] P. Reiss, M. Protire, L. Li, Small 5, 2, 154 (2009).
- [12] S. Herminghaus, M. Klopfleisch, and H.J. Schmidt, Opt. Lett. 19, 4 (1994).
- [13] A. Boardman, Electromagnetic Surface Waves (Wiley, New York, 1982)
- [14] H. Raether, Surface Plasmons on smooth and rough surfaces and on gratings (Springer-Verlag, Berlin 1988).
- [15] A. Yariv, Electron. Lett. 36, 4 (2000).
- [16] A. Yariv, IEEE Photon. Technol. Lett. 14, 4 (2002).
- [17] J. M. Choi, R. K. Lee, A. Yariv, Opt. Express 26, 16, 1236 (2001).
- [18] L. Carbone et al., Nano Lett. 7, 10, 2942 (2001).
- [19] Pochi-Yeh, Optical waves in layered media, edited by Bahaa E. A. Saleh, (John Wiley and Sons, New York, 1998)
- [20] L. D. Landau, Electrodynamics of continuous media (Pergamon Press, Oxford, 1984).