Examining the meaning of the peptide transfer free energy obtained from blocked (Gly)n and cyclic-diglycine model compounds
Abstract
In experiments, the free energy of transferring the peptide group from water to an osmolyte solution is obtained using the transfer free energy of (Gly)n with the added assumption that a constant incremental change in free energy with implies that each additional unit makes an independent contribution to the free energy. Here we test this assumption and uncover its limitations. Together with results for cyclic-diglycine, we show that, in principle, it is not possible to obtain a peptide group transfer free energy that is independent of the model system. We calculate the hydration free energy, , of acetyl-(Gly)n-methyl amide () peptides modeled in the extended conformation in water and osmolyte solutions. versus is linear, suggestive of independent, additive group-contributions. To probe the observed linearity further, we study the hydration of the solute bereft of water molecules in the first hydration shell. This conditioned solute arises naturally in the theoretical formulation and helps us focus on hydration effects uncluttered by the complexities of short-range solute-water interactions. We subdivide the conditioned solute into peptide groups and a methyl end group. The binding energy of each of these groups with the solvent is Gaussian distributed, but the near neighbor binding energies are themselves correlated: the correlation is the strongest and tends to lower the free energy over the independent group case. We show that the observed linearity can be explained by the similarity of near neighbor correlations. Implications for group additive transfer free energy models are indicated.
I Introduction
Group additive decomposition of the free energy of protein conformational change has a rich history in attempts to understand the physical factors governing protein stability in solution Makhatadze and Privalov (1995). Such efforts are at the heart of past and current efforts to understand how the solvent modulates protein folding thermodynamics Nozaki and Tanford (1963); Tanford (1970); Auton and Bolen (2005); Auton et al. (2007, 2011). Since the peptide bond is the most numerous group in a protein, attempts to obtain the transfer free energy of the peptide group have occupied a particularly important position in the broader attempt to understand the role of the solution in protein folding thermodynamics Nozaki and Tanford (1963); Auton and Bolen (2004). Indeed, such group additive transfer free energy analysis has been instrumental in revealing that conformation-protecting osmolytes primarily exert their influence by changing the solubility of the peptide backbone Bolen and Baskakov (2001); Bolen and Rose (2008), an identification with significant consequences to our understanding of protein folding Rose et al. (2006). However, a clear theoretical analysis of the meaning of the transfer free energy of the peptide group that apparently obeys group-additivity has not been satisfactorily established. Here we address this issue on the basis of a physically transparent theoretical framework and computer simulations. However, the insights from this work are not limited to a peptide group, but apply more broadly to all such group-additive decompositions of free energy that are used in studying protein folding and stability.
In seeking the contribution of the peptide, starting from the seminal work of Nozaki and Tanford Nozaki and Tanford (1963), it is common practice to consider the transfer free energy (typically from water to an aqueous solution of an additive) of glycyl-peptides of increasing chain length. The peptides can be blocked n-acetylglycinamides (as in this study) or zwitterionic (as in the studies by Nozaki and Tanford Nozaki and Tanford (1963)). The transfer free energy of the peptide group then has been sought by considering the difference in transfer free energy of chains of length and () by various constructs; for example, for , the peptide free energy would be equated with the free energy difference between the chains of length and . A somewhat more robust approach termed the constant increment method equates the peptide transfer free energy to the slope of the transfer free energy with respect to . Various such constructs are possible and these have been well-documented by Auton and Bolen Auton and Bolen (2004).
Work by Auton and Bolen Auton and Bolen (2004) has also helped clarify some of the vexing issues related to the choice of concentration scales and model compounds in determining the peptide group transfer free energy Auton and Bolen (2004). By careful consideration of peptide solubility issues, these authors have showed that reasonably concordant values of the peptide transfer free energy can be obtained that are independent of the concentration scale and of the model system — glycyl-peptides versus cGG, the cyclic-diglycine molecule. (For cGG, he peptide transfer free energy is sought by dividing the experimental transfer free energies by 2.) While this concordance is pleasing, it is also somewhat troubling since in cGG the CO and NH of the peptide are cis and the molecule has a net zero dipole moment, whereas in all usual proteins the CO and NH are trans and the glycyl peptides used in the experiments can have non-negligible dipole moment. Further, the angles in cGG are also not consistent with what is found in proteins (George Rose, personal communication). Thus, either the conformation of the peptide is unimportant in the transfer free energy value or there are other effects that lead to this result or a combination of both.
Concerns about group additivity Dill (1997), and in particular, identifying a group additive contribution for the peptide Avbelj and Baldwin (2006, 2009), are not new. Using a continuum dielectric model of the solvent, Avbelj and Baldwin Avbelj and Baldwin (2006, 2009) have argued that failure of group additivity arises due to dependence of the hydration free energy of the peptide on the neighboring groups (that serve to occlude the solvent medium in their model). Our point complements this, but is more broader. We show that an independent group additive contribution is not a consequence even when the conditions for use of the constant increment approach are satisfied. Moreover, both electrostatics and van der Waals (dispersion) interactions contribute to the failure of independence, each in rather subtle ways. Thus care is needed even in decoupling free energy contributions of nonpolar groups from adjacent polar groups, an issue that had been anticipated before Ref. Utiramerur and Paulaitis (2010).
Here we use theory and computer simulations to examine the vacuum to solution () transfer free energy of Acetyl-(Gly)n-methyl amide peptides and of cGG. The free energies are obtained by a quasichemical organization of the potential distribution theorem. A virtue of this formulation is that is that it makes transparent the role of correlated fluctuations of the binding energies of two groups on the molecule and its role in the thermodynamics of hydration. A central observation of our work is that even for an idealized solute with no complicated short-range solute-solvent interaction, the group-solvent binding energies between neighboring groups are correlated. This implies that identifying a group-contribution to free energy solely due to an individual group is, in principle, not possible, even for this idealized solute. The situation for a real solute is expected to be considerably more complicated.
II Theory
The excess chemical potential, , of a solute in the solution is that part of the Gibbs free energy that would vanish if the interaction between the solute and solvent were to vanish. Formally,
| (1) |
where is the binding energy of the solute with the rest of the fluid. is the potential energy of the solute plus solvent system at a particular configuration of the solvent (we assume the peptide conformation to be fixed), is the potential energy of the same configuration but with the solute removed, and is the potential energy of the solute, here the peptide, solely. is the probability density distribution of . is the excess free energy in the liquid relative to an ideal gas at the same density and temperature. As usual, , where is the temperature and the Boltzmann constant.
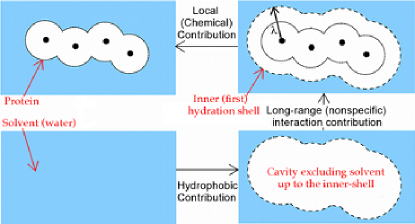
Following earlier work, to calculate from Eq. 1, we regularize by introducing an auxiliary constraint, a field that pushes the solvent molecules away from the solute’s surface to a range . This construct has the virtue of tempering the solute-solvent interaction, and, for solvent pushed far enough (typically evacuating the first hydration shell is sufficient), the distribution of binding energies is a Gaussian. Formally, with the introduction of the field,
| (2) |
is the free energy required to apply the field in the solute-solvent system: it reflects the strength of the solute interaction with the solvent in the inner shell. is the free energy required to apply the field in the neat solvent system: it reflects the intrinsic properties of the solvent. For modeling a hard exclusion of solvent, is precisely the hydrophobic contribution to hydration Pratt and Pohorille (1992); Pratt (2002). is the contribution to from long-range solute-solvent interactions. In molecular dynamics simulations, we calculate or simply by the work required to apply Weber and Asthagiri (2012). Fig. 1 gives a schematic of the decomposition of according to Eq. 2.
For excluding solvent from the first hydration (or inner-shell), the conditional binding energy distribution can be well-described by a Gaussian of mean and variance Weber et al. (2011); Merchant et al. (2010); Asthagiri et al. (2007); Shah et al. (2007) and the long-range contribution is then given by
| (3) |
Now consider decomposing into contributions due to various groups comprising the solute under consideration. For a pairwise additive forcefield, as is used in this study, such a decomposition can be unambiguously made. For the conditioned solute, even the individual binding energy distributions are Gaussian distributed, but, in general, is correlated with (). In this case, is Gaussian distributed with a mean and a variance , where is the correlation coefficient Utiramerur and Paulaitis (2010). The long-range contribution to the free energy is then given by
| (4) | |||||
where is described by Eq. 3. The second summation in Eq. 4 can be rewritten as a sum over all nearest neighbor pairs , the next nearest pairs , etc. From the summation arranged in this fashion, we can then identify the effect of correlations at various spatial length scales to the free energy . Note that the present formulation precisely identifies the contributions solely due to the individual groups, namely the quantities ; we shall call this the zeroth-order or self-contribution of the group . For ease of presentation, when we speak of, say, correlation, we mean the correlation between the binding energies of groups and , respectively, with the solvent.
We have pursued the above development for the long-range piece , the solvation free energy of the conditioned solute, because in this case the binding energy distribution is well-behaved. Conceptually a decomposition similar to Eq. 4 can also be sought for (Eq. 2), the net chemical potential of the solute. But in that case the functional form of the correlation contributions (which can be beyond linear-order) and even the individual contributions are, in general, difficult to ascertain. Our plan is to show that even for the idealized case of the conditioned solute, the effect of near-neighbor correlations is non-trivial, and hence the increment in with is not solely a measure of the contribution of the individual group. That then implies that such a group transfer quantity will depend on the model system on which it was obtained. On this basis, given that is one component of and the greatly enhanced complexity of short-range solute-solvent effects, it is safe to conclude that the same conclusions hold for as well.
III Results and Discussion
III.1 Solvation of the physical solute
Fig. 2 makes it clear that versus for blocked (Gly)n obeys a linear dependence. Similar linearity also holds for the chemical, packing, and long-range contributions (Eq. 2) individually.
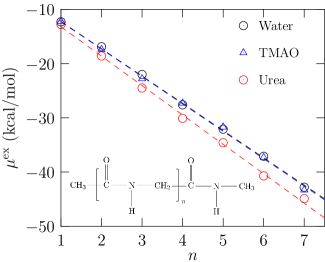
Per the constant increment method Auton and Bolen (2004), we consider the slope of these curves as the contribution of an individual group to the free energy. These values are collected in Table 1 together with results for cGG. (Following established experimental approach Auton and Bolen (2004), the value for cGG is divided by 2 to obtain the value for one CH2CONH group.)
| Water | Urea | TMAO | |
|---|---|---|---|
| (Gly)n | |||
| cGG/2 | |||
The water to the aqueous osmolyte transfer free energy agrees quite well for both the (Gly)n and cGG models. The urea concentration is about 8 M and assuming a linear dependence of transfer free energy on osmolyte concentration Greene and Pace (1974); Hu et al. (2010), we find that for 1 M urea solution, the transfer free energy is cal/mol, a value that is in good agreement with experimental estimates Auton and Bolen (2004). We find a net zero transfer free energy to aqueous TMAO solution (4 M). This appears likely due to inadequacy in the forcefield model for TMAO Hu et al. (2010); Canchi et al. (2012).
From Table 1 we can note that the good agreement in water to aqueous osmolyte solution transfer free energy masks the rather poor agreement in transfer free energies from vacuum to the respective solution. While it can be argued that water to osmolyte solution transfer is the most relevant experimentally, our results suggest that these small values arise from differences of substantially large quantities. From the perspective of a physical theory, the vacuum to solution transfer quantities have the virtue of highlighting the role of inter-group correlations transparently, and in particular, Table 1 clearly shows that a peptide in (Gly)n is different from a peptide in cGG, assuming the validity of the divide-by-2 construct, itself suspect for reasons noted in Sec. III.2. Based on analysis in Sec. III.2, it seems plausible that in the water to osmolyte transfer free, inter-group correlations involving the (physical) solute cancel leaving a net change that is insensitive to the choice of the model system.
III.2 Solvation of the conditioned solute
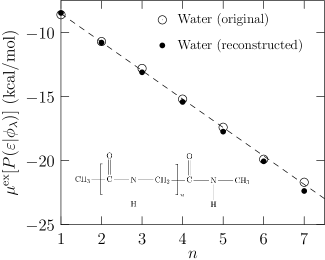
As before (Fig. 2), even the solvation free energy of the conditioned solute, , depends linearly on (Fig. 3). For the analysis below, we exclusively focus on the vacuum to water transfer.
For dissecting the correlation contributions to the slope, we focus on the internal groups of the peptide, as these are the ones changing with . For the blocked (Gly)7 model, group 0 is the methyl, group 1 is the CONHCH2 group formed between the acetyl group and the N-terminus of the protein, and Group 8 is the terminal CONHCH3 group. The remaining six (6) CONHCH2 groups are termed the internal groups. For the (Gly)3 model, per this convention there are two internal groups. In Table 2 we present the average contribution due to various orders of correlation between these internal groups.
| (Gly)7 | (Gly)3 | |
| — | ||
| — | ||
| Total |
Notice that the contribution from the zeroth order (or self term) (, Table 2) is fairly different from the slope of the versus curve. As Eq. 4 shows, this term — the summands in the first term on the right of Eq. 4 — is also the one that can be rigorously identified as a contribution solely due to the group. Progressively including contributions from , , etc. correlations, we find a sum that is reasonably close to the slope of versus . (The slight discrepancy between the sum computed in Table 2 and the slope arises because the linear fit is not perfect.) Observe that the contribution from various orders of correlation are fairly similar for (Gly)7 and (Gly)3. Likewise, the correlation of the end groups with the internal groups are also fairly similar for these two models (data not shown), implying insensitivity to chain length for the correlations involving long-range interactions.
It proves insightful to consider how well the average values of various orders of correlation for (Gly)7 model the free energy for all other chain lengths. Towards this end, we take the average value of the correlation contribution from Table 2, the zeroth-order contributions for groups 0, 1, and 8, and the contribution between groups 0 and 1 and between groups 7 and 8, and use Eq. 4 to compute the free energy for all . The good agreement for all , including (which is all end-groups in our notation), reveals the underlying uniformity of these self () and nearest neighbor () correlation in this model system.
We can further appreciate the subtlety in these correlation contributions by identifying the electrostatic and dispersion contributions separately (Table 3). For dispersion interactions, all orders of correlation beyond the zeroth-order tend to elevate . This makes sense since a favorable interaction of a water molecule with one center necessarily promotes a favorable interaction of that water with an adjacent center and vice versa. (For the dispersion interactions, the relative orientation of the water molecule is irrelevant within the forcefield model.)
| All | Elec | vdW | |
|---|---|---|---|
| Total |
For electrostatics, the relative orientations are important and near neighbor interactions are anti-correlated: a favorable interaction of water with one site necessarily comes at the price of a favorable interaction with the adjacent site. For this same reason, the higher order electrostatic contributions tend to oscillate. Observe also that the sum of the electrostatic and vdW contributions in Table 3 is not precisely equal to the value when these are taken together. This arises because these individual contributions to the binding energy are themselves correlated, and separating them is only approximately true. Finally, consistent with Ref. Utiramerur and Paulaitis (2010), we find that the binding energy of the methyl end group (group 0) is anti-correlated with the binding energy of group 1 (data not shown); this result together with the data in Table 3 thus suggests caution in decoupling polar and non-polar group contributions, especially if these groups are adjacent in space.
Fig. 4 shows the deviation in the calculated relative to the net free energy (left hand side of Eq. 4) upon inclusion of increasing orders of correlation. It is evident that for (Gly)7 correlations up to must be included to obtain a free energy that is converged.
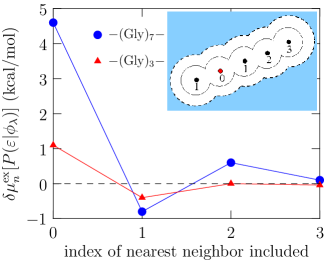
Table 4 compares the average values of the various orders of correlation in the solvation of (Gly)7 in different solvents. Remarkably, we find that all orders of correlation excluding the zeroth-order (self) contribution are identical. So at least in so far as the long-range interactions are concerned, the difference in transfer free energy from water to the osmolyte solution can be entirely determined by the self-contribution, which is also the contribution that obeys group additivity.
| Water | Urea | TMAO | |
|---|---|---|---|
| Total |
The above analysis clearly shows that the incremental change in with respect to includes factors beyond just the interaction of the added group with the solvent: additivity does not imply independence. Although it is not always stated explicitly, group-additive transfer free energy contributions are treated as independent contributions. Our analysis shows this is, in general, invalid.
In contrast to our conclusion, the studies by Bolen and coworkers clearly show that the group-transfer model is capable of describing the -value (the unfolding free energy in an osmolyte solution minus that in water) in a near quantitative fashion Auton and Bolen (2005); Auton et al. (2011). From the perspective of vacuum to solvent transfer, the -value is a difference of difference involving four large transfer free energy contributions (two each for the unfolded and folded states of the protein, respectively) and some degree of cancellation of errors can be expected. But the level of agreement between calculated- and experimental- value Auton and Bolen (2005); Auton et al. (2011) is remarkable and suggestive of some underlying physical regularity. Based on the similarity of higher-order correlation contributions for the conditioned solute in different solvents, and the observed linearity of even packing and chemistry contributions (data not shown), we suspect that in the -value analysis, these higher order effects cancel, leaving only the self (or group-additive) contribution intact. Exploring this idea further is left for future studies.
IV Concluding discussion
Group additivity has a hallowed place in chemistry; indeed it has even been referred to as the 4th law of thermodynamics Dill (1997). However, unlike a small molecular solute in the gas phase that is entirely characterized by strong, short-range interactions, in the treatment of a many body system, such as a protein in a solvent, characterized by many different scales of energies, ranging from strong, short-range interactions to relatively weak but fairly long-range interactions, group additive ideas must be considered with sufficient care.
Even for an idealized solute with no short-range solute-solvent interaction, we find that the net solvation free energy of the solute comprises contributions due to the correlated interaction of the solvent with distinct groups in the solute. As is intuitively reasonable, the contribution of individual group-solvent interaction to the net free energy is the most dominant. However, the binding energy of a group with the solvent is correlated with the binding energy of its neighbor , , etc. These correlated fluctuations can either raise or lower the free energy of the solute, and importantly, they can persist even for spatially distant groups. For the linear (Gly)7, correlations persist up to . A similar behavior, perhaps even longer-range of correlations, can be expected for a topographically complicated object. Further, the individual electrostatic and dispersion contributions to the binding energies are themselves correlated, making the identification of separate free energy contributions due to polar and nonpolar groups problematic, especially if those groups are spatially close.
Given that our analysis uncovers non-negligible effects of correlations even for an idealized solute with no direct solute-solvent contact, we must expect substantially more involved correlation effects for a real solute, one that has an even more complicated short-range interaction with the solvent, and for solutes with formal charges, such as charged amino acid side-chain residues. In light of this identification, the physical basis for why such additive transfer models appear successful remains to be explained. A plausible solution, suggested by this work, may rest in the similarity of the correlation contributions between different solutions.
V Methods
The simulation procedure closely follows our earlier work Weber and Asthagiri (2012) and only key differences are noted. The peptides are modeled in the extended configuration with the long axis aligned with the diagonal of the simulation cell and the center at the center of the simulation cell. (Initial configurations were energy minimized with restraints to keep the peptide extended.) The peptide atoms are fixed in space throughout the simulation. The solvent was modeled by the TIP3P Jorgensen et al. (1983); Neria et al. (1996) model and the CHARMM MacKerell Jr. et al. (1998) forcefield with correction terms for dihedral angles MacKerell Jr. et al. (2004) was used for the protein. A total of 2006 TIP3 molecules solvated the protein. Parameters for urea and TMAO were obtained from Ref. Weerasinghe and Smith (2003) and Kast et al. (2003), respectively. A total of 449 urea molecules (for a molar concentration of about 8 M) and 195 TMAO molecules (for a molar concentration of about 4 M) were used. Unlike the earlier study Weber and Asthagiri (2012), where the external field evacuated a spherical domain around the molecule, here we apply atom-centered fields to carve out a molecular cavity in the liquid; the functional form of the field was as before (Eq. 4b, Ref. Weber and Asthagiri (2012)). To build the field to its eventual range of Å, we progressively apply the field, and for every unit Å increment in the range, we compute the work done in applying the field using Gauss-Legendre quadratures. Five Gauss-points () are chosen for each unit Å. At each Gauss-point, the system was simulated for 1 ns and the data from the last 0.5 ns used for analysis. (Excluding more data did not change the numerical value, indicating good convergence. Error analysis and error propagation was performed as before Weber and Asthagiri (2012).) The starting configuration for each point is obtained from the ending configuration of the previous point in the chain of states. For the packing contributions, thus a total of 25 Gauss points span . For the chemistry contribution, since solvent never enters Å, we simulate for a total of 15 Gauss points. Separate calculations with a lower order Gauss-Legendre quadrature and a trapezoidal rule (with incremented in steps of 0.1 Å Weber and Asthagiri (2012)) showed that results are very well converged with the five-point quadrature (data not shown).
The long-range contribution ( Å) was obtained by inserting the solute Weber et al. (2011) in a cavity (with atom-centered radius Å). 1500 equally spaced cavity configurations were obtained from the last 0.375 ns of a 1 ns simulation at Å. (The starting configuration for the Å simulation was obtained from end point of the Gauss-Legendre procedure as indicated above.) We also did solute extraction calculations Asthagiri et al. (2007) in a like fashion, with 5000 binding energy values obtained over 0.5 ns of simulation. Confirming the Gaussian distribution of binding energies, both procedures gave free energies to within 0.1 kcal/mol of each other (data not shown). The binding energies for the correlation analysis were obtained from the solute extraction procedure.
Cyclic-diglycine was built and optimized using the Gaussian (G09) quantum chemistry package Frisch et al. . For consistency with the (Gly)n simulations, the partial charges and Lennard-Jones interaction parameters were obtained from the backbone atoms of the CHARMM forcefield.
Acknowledgements.
We thank George Rose for helpful discussions and critical insights. This research used resources of the National Energy Research Scientific Computing Center, which is supported by the Office of Science of the U.S. Department of Energy under Contract No. DE- AC02-05CH11231.References
- Makhatadze and Privalov (1995) G. I. Makhatadze and P. L. Privalov, Adv. Prot. Chem. 47, 307 (1995).
- Nozaki and Tanford (1963) Y. Nozaki and C. Tanford, J. Am. Chem. Soc. 238, 4074 (1963).
- Tanford (1970) C. Tanford, 24, 1 (1970).
- Auton and Bolen (2005) M. Auton and D. W. Bolen, Proc. Natl. Acad. Sc. USA 102, 15065 (2005).
- Auton et al. (2007) M. Auton, L. M. F. Holthauzen, and D. W. Bolen, Proc. Natl. Acad. Sc. USA 104, 15317 (2007).
- Auton et al. (2011) M. Auton, J. Rösgen, M. Sinev, L. M. F. Holthauzen, and D. W. Bolen, Biophys. Chem. 159, 90 (2011).
- Auton and Bolen (2004) M. Auton and D. W. Bolen, Biochemistry 43, 1329 (2004).
- Bolen and Baskakov (2001) D. W. Bolen and I. V. Baskakov, J. Mol. Biol. 310, 955 (2001).
- Bolen and Rose (2008) D. W. Bolen and G. D. Rose, Annu. Rev. Biochem. 77, 339 (2008).
- Rose et al. (2006) G. D. Rose, P. J. Fleming, J. R. Banavar, and A. Maritan, Proc. Natl. Acad. Sc. USA 103, 16623 (2006).
- Dill (1997) K. A. Dill, J. Biol. Chem. 272, 701 (1997).
- Avbelj and Baldwin (2006) F. Avbelj and R. L. Baldwin, Prot. Struc. Func. Gen. 63, 283 (2006).
- Avbelj and Baldwin (2009) F. Avbelj and R. L. Baldwin, Proc. Natl. Acad. Sc. USA 106, 3137 (2009).
- Utiramerur and Paulaitis (2010) S. Utiramerur and M. E. Paulaitis, J. Chem. Phys. 132, 155102 (2010).
- Pratt and Pohorille (1992) L. R. Pratt and A. Pohorille, Proc. Natl. Acad. Sc. USA 89, 2995 (1992).
- Pratt (2002) L. R. Pratt, Ann. Rev. Phys. Chem. 53, 409 (2002).
- Weber and Asthagiri (2012) V. Weber and D. Asthagiri, J. Chem. Theory Comput. 8, 3409 (2012).
- Weber et al. (2011) V. Weber, S. Merchant, and D. Asthagiri, J. Chem. Phys. 135, 181101 (2011).
- Merchant et al. (2010) S. Merchant, J. K. Shah, and D. Asthagiri, J. Chem. Phys. 134, 124514 (2010).
- Asthagiri et al. (2007) D. Asthagiri, H. S. Ashbaugh, A. Piryatinski, M. E. Paulaitis, and L. R. Pratt, J. Am. Chem. Soc. 129, 10133 (2007).
- Shah et al. (2007) J. K. Shah, D. Asthagiri, L. R. Pratt, and M. E. Paulaitis, J. Chem. Phys. 127, 144508 (2007).
- Greene and Pace (1974) R. F. Greene and C. N. Pace, J. Biol. Chem. 249, 5388 (1974).
- Hu et al. (2010) C. Y. Hu, H. Kokubo, G. C. Lynch, D. W. Bolen, and B. M. Pettitt, Prot. Sc. 19, 1011 (2010).
- Canchi et al. (2012) D. R. Canchi, P. Jayasimha, D. C. Rau, G. I. Makhatadze, and A. E. García, J. Phys. Chem. B 116, 12095 (2012).
- Jorgensen et al. (1983) W. Jorgensen, J. Chandrasekhar, J. D. Madura, R. W. Impey, and M. L. Klein, J. Chem. Phys. 79, 926 (1983).
- Neria et al. (1996) E. Neria, S. Fischer, and M. Karplus, J. Chem. Phys. 105, 1902 (1996).
- MacKerell Jr. et al. (1998) A. D. MacKerell Jr., D. Bashford, Bellott, R. L. Dunbrack Jr., J. D. Evanseck, M. J. Field, S. Fischer, J. Gao, H. Guo, S. Ha, et al., J. Phys. Chem. B 102, 3586 (1998).
- MacKerell Jr. et al. (2004) A. D. MacKerell Jr., M. Feig, and C. L. Brooks III, J. Comp. Chem. 25, 1400 (2004).
- Weerasinghe and Smith (2003) S. Weerasinghe and P. E. Smith, J. Phys. Chem. B 107, 3891 (2003).
- Kast et al. (2003) K. M. Kast, J. Brickmann, S. M. Kast, and R. S. Berry, J. Phys. Chem. A 107, 5342 (2003).
- (31) M. J. Frisch, G. W. Trucks, H. B. Schlegel, G. E. Scuseria, M. A. Robb, J. R. Cheeseman, G. Scalmani, V. Barone, B. Mennucci, G. A. Petersson, et al., Gaussian 09 Revision A.1, gaussian Inc. Wallingford CT 2009.