Relaxor behavior and morphotropic phase boundary in a simple model
Abstract
A simple model to reproduce strong enhancement of dielectric response near the morphotropic phase boundary (MPB) is proposed. This model consists of long-range dipole-dipole interaction and compositional chemical disorder incorporated by the variation in lengths of dipole moments. By applying Monte Carlo simulation, we show that there appears a ferroelectric boundary phase between two types of antiferroelectric phases at an optimal strength of randomness. In the boundary phase, ferroelectric domain becomes remarkably large and flexible to external electric fields, leading to huge dielectric response. This observation indicates that huge dielectric response near the MPB originates from local polarization rotation under suppressed anisotropy by phase competition.
Ferroelectric relaxors based on perovskite oxides (ABO3) have attracted much interest because their characteristic dielectric properties have several advantages to application. The common feature of perovskite-type relaxors is intrinsic randomness due to compositional disorder in the arrangement of ions on the crystallographically equivalent sites. For example, a typical ferroelectric relaxor Pb(Mg1/3Nb2/3)O3 (PMN) [1] exhibits disordered arrangement of Mg2+ and Nb5+ at the B sites. This intrinsic randomness is responsible for relaxor properties such as huge permittivity with moderate temperature-dependence [2].
In material survey of ferroelectric relaxors, it is well known that structural phase transition induced by compositional change plays a special role for obtaining excellent piezoelectric properties. This phase boundary is known as the morphotropic phase boundary (MPB). For example, solid solution Pb(Mg1/3Nb2/3)O3-PbTiO3 (PMN-PT) has a rhombohedral(tetragonal) crystal structure for small(large) , and shows large dielectric/piezoelectric response near MPB at [3]. This feature is generally observed in relaxors based on solid solution of perovskite oxides; the MPB is located for Pb(Zn1/3Nb2/3)O3-PbTiO3 (PZN-PT) at [4], and for PbZr1-x TixO3 (PZT) at [5].
Study of the origin of large dielectric/piezoelectric response at the MPB is of much importance not only for understanding of relaxor properties, but also for application to piezoelectric devices. Huge dielectric/piezoelectric response at the MPB is intuitively understood within the Landau-Ginzburg-Devonshire(LGD) theory [6, 7, 8, 9]. When different structural phases are almost degenerate near the MPB, rotations of polarization become effective in response to external electric fields instead of changing magnitude of polarization [10, 11]. Recent discovery of a monoclinic phase near the MPB [12, 13, 14, 15, 16] is consistent with this polarization rotation scenario [7, 10, 11]. The LGD theory is, however, not satisfactory to describe the whole properties of relaxors as it treats only spatially-averaged quantities.
In order to treat spatial dependence of polarization reflecting intrinsic atomic-scale randomness, one of the most powerful methods is molecular dynamics (MD) simulation for an effective model derived from first-principles calculation. This approach has succeeded in quantitative evaluation of structure phase transition in pure ferroelectric materials [17, 18], and has been also applied to relaxor ferroelectrics [19, 20, 21]. This approach is, however, limited to short-time dynamics in the present computer resource, and is unable to access slow dynamics by large-scale domain motion, which is curtail to huge dielectric/piezoelectric response at MPB. In the present situation, statistical-mechanical approach to a simplified model is still valuable to clarify what the essence of physics near MPB is.
In this paper, we propose a simple model, which can reproduce several important properties near MPB [22]. By applying large-scale Monte Carlo simulation to this model, we calculate dielectric response, domain structure, and structure factor. Our model exhibits intrinsic competition between different phases, which are connected by polarization rotation. We show that the intrinsic atomic-scale disorder strongly modifies the shape of domain structure at MPB (transition region between phases). Our result indicates that in addition to the polarization rotation mechanism, drastic change of domain shape at MPB is crucial to huge dielectric/piezoelectric response. We also discuss its relevance to experimental results.
We constitute a simple model to describe MPB by the following strategy: (1) The model is taken so that it exhibits competition between different phases when magnitude of dipole moments is uniform, and then (2) atomic-scale inhomogeneity is introduced by considering random distribution of magnitude of dipole moments. As a simplest model fulfilling these requirements, we propose a model consisting of dipole moments on a two-dimensional square lattice:
| (1) |
Here, is a three-dimensional vector representing an electric polarization caused by the ionic displacement at site , and is a displacement vector from site to . We further divide the square lattice into two sub-lattices, A and B as shown in Fig. 1 (a), and locate dipoles with different magnitude on each lattice.
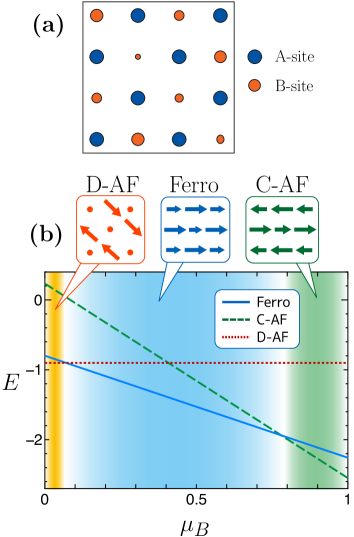
Let us first consider a uniform model, in which magnitudes of dipole moments are constant on each sub lattice. We denote the magnitudes of moments on the A- and B-site with and , respectively. We show the ground-state energies and configurations as a function of in Fig. 1 (b), assuming that periodicity like in Luttinger and Tisza’s preceding study [25]. As depicted in Fig. 1 (b), there are three ground states. When the length of B-site moment is close to unity, the ground state is a columnar-antiferroelectric (C-AF) state [26]. On the other hand, the ground state is a diagonal-antiferroelectric (D-AF) as the ground state when is sufficiently small. In the limit, the D-AF state can be regarded as another C-AF state on the square lattice constructed by A-sites. It is noteworthy that directions of easy axis anisotropies between the C-AF and the D-AF states differ from each other by 45-degrees. That is, the length of B-site dipole moment affects directions of easy axes of dipoles on A-site. Between the two AF states there is a wide ferroelectric region. The ferroelectric order has an anisotropic easy axis except for [26]. The easy axis in this ferroelectric phase is vertical and horizontal near the C-AF boundary, while it is diagonal near the D-AF boundary.
Analysis of the uniform dipole model has shown that the present model exhibits different ordered phases controlled by the ratio . We then introduce effect of atomic-scale randomness through spatial distribution of magnitude of dipole moments. Here, we assume that magnitude of the A-site dipole moments is fixed as unity (), whereas magnitude of the B-site dipole moments has spatial distribution. That is, we set magnitude of the B-site moment as
| (2) |
where is an integer-valued random variable following the Poisson distribution . The strength of randomness is controlled by setting the average value of Poisson distribution.
Before showing analysis for the random dipole model, we briefly mention relevance of the present model to the MPB observed in perovskite oxides. In our model, the A-site dipoles corresponds to the displacement of Pb ions, whereas the B-site dipoles to the displacement of transition metal ions (the B-site in the perovskite structures). Since the intrinsic randomness is induced by compositional disorder on the B-site, assumption of distribution in B-site dipole moments is not far from reality. Then, is related to strength of disorder, i.e., an compositional ratio between a relaxor ferroelectric material and a pure ferroelectric material. Our model has also been motivated from recent theoretical work focusing on importance of large polarization in the B-site [27]. We will discuss how the present effective model can be extended to more realistic one in the last part of this paper.
We performed Monte Carlo simulation in order to examine effects of the B-site randomness. To realize an effective spin update in systems with long-range interactions, O Monte Carlo method was adapted [28, 26]. The long-range dipole interactions were estimated by using the Ewald summation method. We consider square lattices throughout this paper. To calculate dielectric susceptibilities, we apply an alternate external electric field with sinusoidal shape given as as a function of the Monte Carlo step . Though we cannot define time in Monte Carlo simulation, one Monte Carlo step can approximately be regarded as forward time-evolution by a certain time step. In this paper, we set the magnitude and period of electric field as and , respectively. For thermalization, we discarded Monte Carlo steps while keeping on applying external alternate field. We executed Monte Carlo steps for measurement, so that cycles are executed for measurement. In order to average B-site randomness, 512 independent samples were simulated.
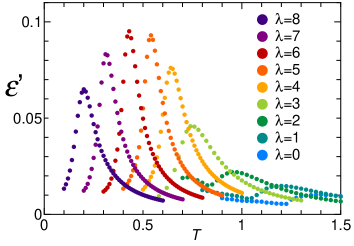
In Fig. 2, we shows real part of calculated dielectric susceptibilities per site for several values of as a function of the temperature . As seen from the figure, the dielectric susceptibilities has a maximum at , and the maximum temperature is lowered as increases. The peak of the dielectric susceptibility is well suppressed for small , whereas it rapidly grows with increasing . The maximum value becomes largest at an optimum value , and it is reduced for larger value of . These features well resemble the behavior of the dielectric response near MPB in perovskite oxides, when we think to be the MPB in the present model.
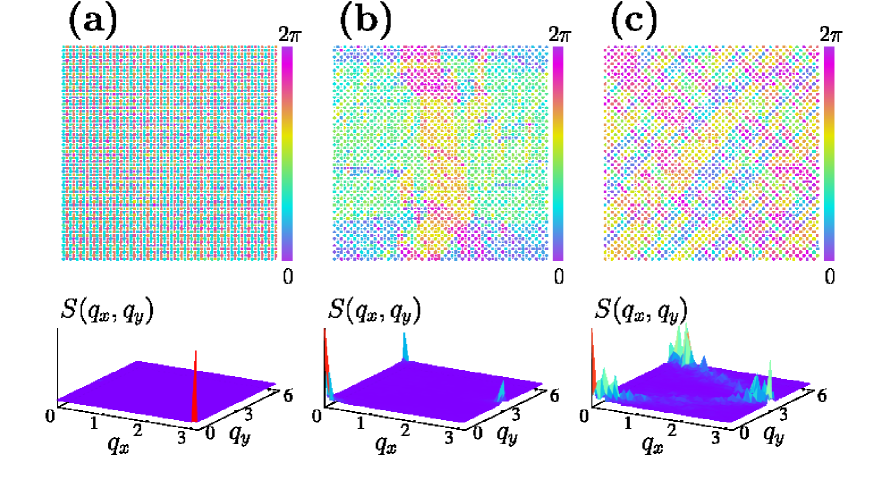
To examine the mechanism of emerging of the maximum, snapshots and structure factors for , , and are shown in the upper and lower panels of Fig. 3, respectively. For , the columnar-antiferroelectric (C-AF) phase is stable at low temperatures (Fig. 3 (a)). The long-range C-AF ordering is indicated by a sharp peak at , and most of the width of the ferroelectric domains are a unit lattice length as seen from the snapshot, explaining suppression of dielectric susceptibilities for small . On the other hand, a relaxor ferroelectric (R-F) phase is realized at at low temperatures (Fig. 3 (c)). One broad peak of the structure factor at indicate ferroelectric short-range ordering, the other peak at reflects the difference of magnitude of moments on the A- and B-sublattice. Here, we point out that at finite temperatures, direction of polarization in ferroelectric domain is affected by the neighboring phases. At , polarization in ferroelectric domain is restricted along the diagonal direction affected by the D-AF phase. In this phase, strong randomness make peaks in the structure factor diffusive, i.e., extended along the diagonal direction, leading to butterfly-shaped structure factors which are typically observed in relaxors. These properties characteristic of the R-F phase explains relatively large dielectric response for in our model.
Here, we note important difference between the C-AF phase and R-F phase. The former phase realized for small has easy axis of dipole moments along or direction, whereas the latter phase realized for large along the diagonal direction and . This difference can be seen by the shape of domains shown in the upper panels in Fig. 3 (a) and (c). We stress that transition between these two phases necessarily accompanies polarization rotation [10]. What happens if is set on the boundary between the above two phases? This is the main problem which we will clarify from now.
The boundary between the C-AF and R-F phases is located around (Fig. 3 (b)). At , ferroelectric ordering remains in this boundary region as indicated by two peaks in the structure factor. The ferroelectric domain size becomes, however, much larger as seen from the snapshot. The remarkable enhancement of correlation length for ferroelectric ordering is also indicated from the sharpness of the peak in the structure factor at ; the correlation length becomes much larger than the case of , for which diffusive butterfly-shaped pattern is induced by local atomic-scale domain. A noteworthy fact is that directions of the polarization in ferroelectric domains are not restricted in contrast to the C-AF and R-F phase. This feature can be seen also from the shape of the domain walls, which are irregular shaped and much rounder than in the C-AF and R-F phase. The free-wheeling of the polarizing directions in the intermediate region comes from competitions between the C-AF and the R-F states. Because of the B-site randomness, the competitions differ from area to area. In view of the local stability, a favorable dipole direction is affected by neighboring B-site moments. However, the direction of the ferroelectric domain that the dipole belongs to also affects the favorable direction. Therefore, favorable directions of dipoles can be changed easily by a small disturbance, so that dipoles react immediately to the external electric field in the intermediate phase. This competition is the reason why the largest susceptibility peak is achieved in the intermediate region.
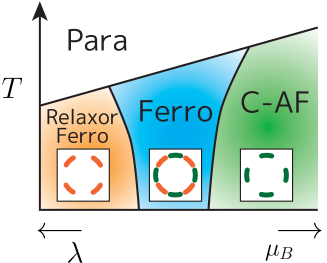
In Fig. 4 we summarize a schematic phase diagram of our model. Since an increase in size of dipole moment raises transition temperature, phase boundary adjacent to the paraelectric phase is proportional to the average size of . Stable dipole configurations are influenced by (see Fig. 1(b)), so that we observed the R-F, ferroelectric, and C-AF phases as increasing (decreasing ). Due to the configurational entropy, ferroelectric phase becomes wider as increasing temperature. In the present model, the B-site randomness controls not only the stability of the C-AF and R-F phase, but also changes the easy axis of dipole moments. A schematic figure of the easy-axis potential on dipole moments is also shown in Fig. 4. In the intermediate region, the easy-axis potential is mixture of the ones of the C-AF and R-F phase. The resulting mixed potential forms the dimple at the bottom of a wine bottle, and it makes dipoles easy to rotate.
Our result is consistent with polarization rotation mechanism proposed by Fu and Cohen [10], which claims multiple ordering energetically degenerate near MPB. Their discussion is, however, based on the spatially averaged quantities as well as other theoretical works based on the LGD theory, and couldn’t predict anything on domain structures. Indeed, our Monte Carlo simulation has demonstrated that change of anisotropy in dipole moments does strongly affects spatial structure of ferroelectric domains. This result indicates that local polarization rotation under suppressed anisotropy due to phase competition makes domain wall flexible to external field, leading to huge dielectric response. This is the main result of this paper.
Our observation of large ferroelectric domain formation near the MPB is expected to be examined by experiments such as neutron scattering [29, 30, 31] and transmission electron microscopy (TEM) [32, 33, 34, 35, 36]. Recently, Matsuura et al. observed that correlation length becomes large near the MPB [29]. The same group further fortified the mechanism by inelastic neutron scattering measurements and an analysis of a pseudospin-phonon coupled model [31], which is a similar scenario of our model. An anomalous nature of ferroelectric domain at the MPB has also been reported in the TEM experiment [36].
Finally, we discuss extension of our simple model toward more realistic models. It is straightforward to extend our model to three-dimensional models without any problems except for computational resources. In our model, we omitted short-range interaction related to covalent bonding between neighboring ions and strain of the surrounding media. As a result, the C-AF phase has been realized in our model in the pure material side (small- region), instead of pure ferroelectric phase usually realized in perovskite oxides. This artifact can be corrected by considering short-range interaction, though it is left for future work. We, however, claim that essence of physics at MPB should come from local polarization rotation due to suppressed anisotropy by mixture of anisotropy potentials, which are sufficiently taken into account in the present model.
In summary, we proposed a simple dipole model, and executed Monte Carlo simulations to it. We showed that there appear a boundary ferroelectric phase between the C-AF and R-F phases at an optimal B-site randomness, and that it has large ferroelectric domains with flexible walls. This novel feature is due to mixture of two different easy axes neighboring phases. We expect that our model explains the reason why the realization of the large dielectric response around MPB regions of a wide variety of binary and ternary Pb-based solid solutions.
We thank Kenji Ohwada, Masato Matsuura, and Shigeo Mori for valuable discussions. The computation in the present work is executed on computers at the Supercomputer Center, Institute for Solid State Physics, University of Tokyo. The present work is financially supported by MEXT Grant-in-Aid for Scientific Research on Priority Areas “Novel States of Matter Induced by Frustration” (19052002).
References
- [1] G. A. Smolenskii and A. I. Agronovskaya: Sov. Phys. Tech. Phys. A3 (1958) 1380.
- [2] For recent reviews, A. A. Bokov and Z.-G. Ye: J. Mater. Sci. 41 (2006) 31.
- [3] S.-E. Park and T. R. Shrout: J. Appl. Phys. 82 (1997) 1804.
- [4] J. Kuwata, K. Uchino, and S. Nomura: Ferroelectrics 37 (1981) 579.
- [5] B. Jaffe, W. R. Cook, and H. Jaffe: Piezoelectric Ceramics (Academic, London, 1971).
- [6] A. F. Devonshire: Adv. Phys. 3 (1954) 85.
- [7] A. Bell: J. Materi. Sci., 41 (2006) 13.
- [8] Y. Ishibashi and M. Iwata: Jpn. J. Appl. Phys. 37 (1998) L985; Jpn. J. Appl. Phys. 38 (1999) 800; Jpn. J. Appl. Phys. 38 (1999) 1454.
- [9] Y. Yamada, Y. Uesu, M. Matsuda, K. Fujishiro, D. E. Cox, B. Noheda, and G. Shirane: J. Phys. Soc. Jpn. 71 (2002) 966.
- [10] H. Fu and R. E. Cohen: Nature 403 (2000) 281.
- [11] D. Vanderbilt and M. H. Cohen: Phys. Rev. B 63, 094108 (2001).
- [12] K. Ohwada, K. Hirota, P. W. Rehrig, P. M. Gehring, B. Noheda, Y. Fujii, S.-E. E. Park, and G. Shirane: J. Phys. Soc. Jpn. 70 (2001) 2778.
- [13] K. Ohwada, K. Hirota, P. W. Rehrig, Y. Fujii, and G. Shirane: Phys. Rev. B 67 (2003) 094111.
- [14] H. Yokota, N. Zhang, A. E. Taylor, P. A. Thomas, and A. M. Glazer: Phys. Rev. B 80 (2009) 104109.
- [15] D. Phelan, X. Long, Y. Xie, Z.-G. Ye, A. M. Glazer, H. Yokota, P. A. Thomas, and P. M. Gehring: Phys. Rev. Lett. 105 (2010) 207601.
- [16] J. Kaneshiro and Y. Uesu: Phys. Rev. B 82 (2010) 184116.
- [17] W. Zhong, D. Vanderbilt, and K. Rabe: Phys. Rev. Lett. 73 (1994) 1861.
- [18] W. Zhong and D. Vanderbilt: Phys. Rev. B 52 (1995) 6301.
- [19] B. P. Burton, E. Cokiayne, S. Tinte, and U. V. Waghmare: Phase Transition 79 (2006) 91.
- [20] S. Tinte, B. P. Burton, E. Cockayne, and U. V. Waghmare: Phys. Rev. Lett. 97 (2006) 137601.
- [21] B. P. Burton, E. Cockayne, S. Tinte, and U. V. Waghmare: Phys. Rev. B 77 (2008) 144114.
- [22] A similar approach has been employed by the authors to explain a phase diagram and dielectric response of Pb(In1/2Nb1/2)O3 (PIN) [23, 24].
- [23] Y. Tomita, T. Kato, and K. Hirota: J. Phys. Soc. Jpn. 79 (2010) 023001.
- [24] K. Ohwada, and Y. Tomita: J. Phys. Soc. Jpn. 79 (2010) 011012.
- [25] J. M. Luttinger and L. Tisza: Phys. Rev. 70 (1946) 954.
- [26] Y. Tomita: J. Phys. Soc. Jpn. 78 (2009) 114004.
- [27] I. Grinberg, P. Juhás, P. K. Davies, and A. M. Rappe: Phys. Rev. Lett. 99 (2007) 267603.
- [28] K. Fukui and S. Todo: J. Comp. Phys. 228 (2009) 2629.
- [29] M. Matsuura, K. Hirota, P. M. Gehring, Z.-G. Ye, W. Chen, G. Shirane: Phys. Rev. B 74 (2006) 144107.
- [30] K. Ohwada, J. Mizuki, K. Namikawa, M. Matsushita, S. Shimomura, H. Nakao, and K. Hirota: Phys. Rev. B 83 (2011) 224115.
- [31] M. Matsuura, H. Hiraka, K. Yamada, and K. Hirota: J. Phys. Soc. Jpn. 80 (2011) 104601.
- [32] D. Fu, H. Taniguchi, M. Itoh, S.-Y Koshihara, N. Yamamoto, S. Mori: Phys. Rev. Lett. 103 (2009) 207601.
- [33] A. A. Bokov and Z.-G. Ye: J. Appl. Phys. 95 (2004) 6347.
- [34] Z.-G. Ye, M. Dong, and L. Zhang: Ferroelectrics 229 (1999) 223.
- [35] Z.-G. Ye and M. Dong: J. Appl. Phys. 87 (2000) 2312.
- [36] K. Kurushima and S. Mori: Materials Science and Engineering 18 (2011) 092015.