![[Uncaptioned image]](/html/1301.6113/assets/x1.png)
Research Proposal for an Experiment to Search for the Decay
A. Blondel, A. Bravar, M. Pohl
Département de physique nucléaire et
corpusculaire,
Université de Genève, Genève
S. Bachmann, N. Berger, M. Kiehn,
A. Schöning, D. Wiedner, B. Windelband
Physikalisches Institut, Universität
Heidelberg, Heidelberg
P. Eckert, H.-C. Schultz-Coulon, W. Shen
Kirchoff Institut für Physik, Universität
Heidelberg, Heidelberg
P. Fischer, I. Perić
Zentralinstitut für Informatik, Universität
Heidelberg, Mannheim
M. Hildebrandt, P.-R. Kettle, A. Papa, S. Ritt, A. Stoykov
Paul Scherrer Institut, Villigen
G. Dissertori, C. Grab, R. Wallny
Eidgenössiche Technische Hochschule
Zürich, Zürich
R. Gredig, P. Robmann, U. Straumann
Universität Zürich, Zürich
December 10th, 2012
Executive Summary
We propose an experiment (Mu3e) to search for the lepton flavour violating (LFV) decay . We aim for an ultimate sensitivity of one in -decays, four orders of magnitude better than previous searches. This sensitivity is made possible by exploiting modern silicon pixel detectors providing high spatial resolution and hodoscopes using scintillating fibres and tiles providing precise timing information at high particle rates.
Existing beamlines available at PSI providing rates of order muons per second allow to test for the decay in one of muon decays. In a first phase of the experiment, we plan to make use of this and establish the experimental technique whilst at the same time pushing the sensitivity by three orders of magnitude.
The installation of a new muon beamline at the spallation neutron source is currently under discussion at PSI. Such a High Intensity Muon Beam (HiMB) will provide intensities in excess of muons per second, which in turn are required to reach the aimed sensitivity of .
The proposed experiment is highly complementary to other LFV searches for physics beyond the standard model, i.e. direct searches performed at the Large Hadron Collider (LHC) and indirected searches in the decay of taus and muons, such as the decay , which is the subject of the MEG experiment currently in operation at PSI. The proposed experiment for the search will test lepton flavour violating models of physics beyond the Standard Model with unprecedented sensitivity.
This sensitivity is experimentally achieved by a novel experimental design exploiting silicon pixel detectors based on High Voltage Monolithic Active Pixel Sensors (HV-MAPS). This technology provides high granularity, important for precision tracking and vertexing, and allows one to significantly reduce the material budget by thinning down the sensors and by integrating the hit digitisation and readout circuitry in the sensor itself. The detector geometry is optimized to reach the highest possible momentum resolution in a multiple Coulomb scattering environment, which is needed to suppress the dominating background from the radiative muon decay with internal conversion, . The time information of the decay electrons111Here and in the following, the term “electron” denotes generically both decay electrons and positrons., obtained from the pixel detector is further improved by a time-of-flight system consisting of a scintillating fiber hodoscope and tiles with Silicon Photo-Multipliers (SiPM) for light detection. By combining both detector systems accidental background can be reduced below the aimed sensitivity of .
We will complete the sensor development and start constructing the detector in 2013, in order to be ready for first exploratory data taking at an existing beam line with a first minimal detector setup in 2015. A detector capable of taking data rates of order muons per second and capable of reaching a sensitivity of will be available in 2016. This Phase I detector is the main focus of this proposal.
In Phase II, beyond 2017, the experiment will reach the ultimate sensitivity by exploiting a possible new high intensity muon beamline with an intensity of muons per second. In the absence of a signal, LFV muon decays can then be excluded for at confidence level.
Part I Introduction
Chapter 1 Motivation
In the Standard Model (SM) of elementary particle physics, the number of leptons of each family (lepton flavour) is conserved at tree level. In the neutrino sector, lepton flavour violation (LFV) has however been observed in the form of neutrino mixing by the Super-Kamiokande [1], SNO [2], KamLAND [3] and subsequent experiments. Consequently, lepton flavour is a broken symmetry, the standard model has to be adapted to incorporate massive neutrinos and lepton flavour violation is also expected in the charged lepton sector. The exact mechanism and size of LFV being unknown, its study is of large interest, as it is linked to neutrino mass generation, CP violation and new physics beyond the SM (BSM).
The non-observation of LFV of charged leptons in past and present experiments might at a first glance be surprising, as the mixing angles in the neutrino matrix have been measured to be large (maximal). This huge suppression of LFV effects is however accidental and due to the fact that (a) neutrinos are so much lighter than charged leptons and (b) the mass differences between neutrinos (more precisely the square of the mass differences) are very small compared to the W-boson mass.
The situation completely changes if new particles beyond the SM are introduced. If e.g. SUSY is realized at the electroweak scale, the scalar partners of the charged leptons (sleptons) will have large masses, and if not fully degenerate, induce LFV interactions via loop corrections. These LFV effects from new particles at the TeV scale are naturally generated in many models and are therefore considered to be a prominent signature for new physics.
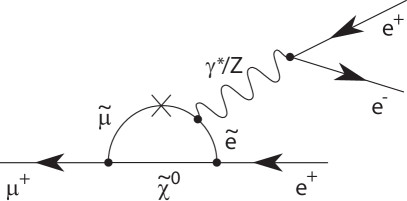
In many extensions of the SM, such as grand unified models [4, 5, 6], supersymmetric models [7] (see Figure 2.2), left-right symmetric models [8, 9, 10], models with an extended Higgs sector [11] and models where electroweak symmetry is broken dynamically [12], an experimentally accessible amount of LFV is predicted in a large region of the parameter space.
| Decay channel | Experiment | Branching ratio limit | Reference |
|---|---|---|---|
| MEGA | [13] | ||
| MEG | [14] | ||
| SINDRUM | [15] | ||
| SINDRUM II | [16] |
Seesaw and Left-Right symmetric (supersymmetric) models are good candidates for realising grand unification, which also unify quark and lepton mass matrices. Moreover, it has been shown that LFV effects in the low energy limit can be related to mixing parameters at the GUT scale or to heavy Majorana masses in these models [17, 18]. Seesaw models are therefore very attractive in the context of LFV as they are also able to naturally explain the smallness of the masses of the left handed neutrinos. In this context the recent results from neutrino oscillation experiments are very interesting, as they measured a large mixing angle , which enhances the LFV-muon decays in most models which try to explain the small neutrino masses and the large mixing.
Currently the most accurate measurement is provided by the Daya Bay reactor neutrino experiment [19] yielding , excluding the no-oscillation hypothesis at standard deviantions. The Daya Bay measurement is in good agreement with measurements by the RENO [20], Double Chooz [21] and T2K [22] experiments. These results are very encouraging, as large values of lead to large LFV effects in many BSM models.
The observation of LFV in the charged lepton sector would be a sign for new physics, possibly at scales far beyond the reach of direct observation at the large hadron collider (LHC). Several experiments have been performed or are in operation to search for LFV in the decays of muons or taus. Most prominent are the search for the radiative muon decay [13, 23, 24, 14], the decay [15], the conversion of captured muons to electrons [16] and LFV tau decays [25, 26, 27, 28, 29, 30, 31, 32, 33, 34, 35, 36, 37, 38, 39, 40, 41, 42, 43].
The recent search performed by the MEG-Collaboration yields [14] and sets currently the most stringent limit on many LFV models. The MEG collaboration plans to continue operation into 2013 in order to increase the number of stopped muons and to reach a sensitivity of a few times . Plans to upgrade the experiment to further improve the sensitivity are currently under discussion.
In the near future the DeeMe experiment [44] at J-PARC plans to improve the current muon-to-electron conversion limit of [16] by almost two orders of magnitude. By the end of the decade this limit could be improved by even four orders of magnitude by COMET at J-PARC [45] and Mu2e at Fermilab [46, 47].
Selected limits for lepton flavour violating muon decays and muon-to-electron conversion experiments, which are of high relevance for the proposed experiment, are shown in Table 1.1. A search for the LFV decay with an unprecedented sensitivity of as proposed here would provide a unique opportunity for discoveries of physics beyond the SM in the coming years.
Chapter 2 Theory
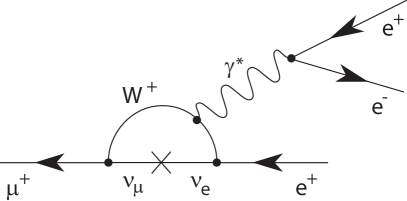
In the SM, charged lepton flavour violating reactions are forbidden at tree level and can only be induced by lepton mixing through higher order loop diagrams. However, the dominant neutrino mixing loop diagram, see Figure 2.1, is strongly suppressed in the SM with B and thus giving potentially high sensitivity to LFV reactions in models beyond the Standard Model (BSM).
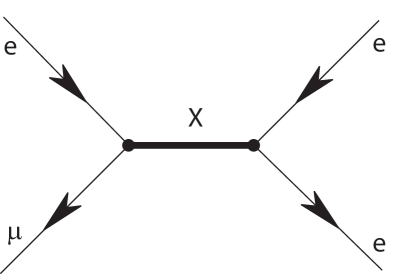
Such an example is shown in Figure 2.2, where a /-penguin diagram is shown with new supersymmetric (SUSY) particles running in a loop. These loop contributions are important basically for all models, where new particle couplings to electrons and muons are introduced. Lepton flavor violation can also be mediated by tree couplings as shown in Figure 2.3. These couplings could be mediated by new particles, like Higgs particles or doubly charged Higgs particles, R-parity violating scalar neutrinos or new heavy vector bosons, the latter being motivated by models with extra dimensions [48, 49]. These models usually also predict semihadronic decays of tau leptons or the muon conversion process , which is experimentally best tested in muon capture experiments.
The lepton flavor violating three electron decay of the muon can be mediated, depending on the model, via virtual loop (Figure 2.2) and box diagrams or via tree diagrams (Figure 2.3). The most general Lagrangian for this decay can be parameterized as [50] 111A representation of Lagrangian containing explicitly the contributions from the loop and box diagrams can be found in [51].:
| (2.1) |
The form factors describe tensor type (dipole) couplings, mostly acquiring contributions from the photon penguin diagram, whereas the scalar-type () and vector-type () form factors can be regarded as four fermion contact interactions, to which the tree diagram contributes in leading order. In addition also off shell form factors from the penguin diagrams, which are not testable in the decay contribute to [51]. In case of non-zero dipole and four-fermion couplings also interference effects have to be considered, which can be exploited to investigate violation of time reversal (-invariance).
By neglecting higher order terms in , the total branching ratio of the decay can be expressed by:
| (2.2) |
where the definition is used. The term proportional to is logarithmically enhanced and can be assigned to the photon penguin diagram. The constants and are -violating mixing parameters. In case of a signal, the different terms can be measured from the angular distribution of decay particles using a polarized muon beam.
2.1 Comparison versus
In the decay physics beyond the SM is only tested by photon penguin diagrams, in contrast to where also tree, -penguin and box diagrams contribute. To compare the new physics mass scale reach between the processes and a simplified model is chosen; it is assumed that the photon penguin diagram Figure 2.2 and the tree diagram Figure 2.3 are the only relevant contributions. The Lagrangian then simplifies to222A similar study was presented in [52]:
| (2.3) |
where for the contact interaction (“tree”) term exemplarily a left-left vector coupling is chosen. In this definition a common mass scale is introduced and the parameter describes the ratio of the amplitudes of the vector-type (tree) term over the tensor () term.
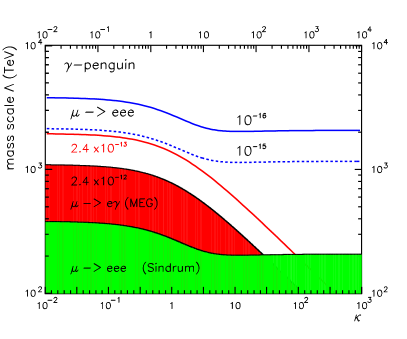
Limits on the common mass scale as obtained from the experimental bounds on ( CL MEG 2011) and ( CL SINDRUM) are shown in Figure 2.4 as function of the parameter . Experimentally, for small values of (dipole coupling) the mass scale is best constrained by the MEG experiment whereas the four fermion contact interaction region with is best constrained by the SINDRUM experiment.
For comparison also a hypothetical ten times improved limit is shown for the MEG experiment (post-upgrade) and compared to the sensitivities of the proposed experiment of (phase I) and (phase II). It can be seen that in this simple model comparison high mass scales will be best constrained by the proposed experiment for all values of already in phase I.
In case of dominating tensor couplings (, ) a quasi model independent relation between the decay rate and the decay rate can be derived:
| (2.4) |
This ratio applies for many supersymmetric models, where LFV effects are predominantly mediated by gauge bosons and where the masses of the scalar leptons or gauginos are of electroweak scale. In these models, which are already heavily constrained or even excluded by the recent LHC results, the sensitivity of the proposed Mu3e experiment in terms of branching ratio has to be two orders of magnitude higher than that of the MEG experiment in order to be competitive.

2.1.1 -penguin Contribution
However, besides the tree and -penguin diagrams also the -penguin diagram can significantly contribute to the process . The -penguin diagram is of particular importance if the new physics scale is higher than the electromagnetic scale, as can be easily derived from a dimensional analysis. The enhancement of the -penguin contribution over the -penguin contribution and its non-decoupling behaviour when going to high mass scales was discussed for Little Higgs models [53, 54] as well as for several SUSY models [55, 56, 57, 58, 59]. SUSY models with -parity violation and right handed neutrinos received recently quite some attention in this context, as approximate cancellations of different -diagram contributions are not present in extended Minimum Super-Symmetric Standard Models (MSSM).
The effect of such an enhanced Z-penguin coupling, where the LFV contribution to the process is exemplarily enhanced by a factor of ten relative to the photon-penguin contribution, is shown in Figure 2.5. It can be seen that the sensitivity of the process to new physics is significantly enhanced at small values of and that in such a case a sensitivity of is already sufficient to be competitive with the process with a sensitivity of a few times .
2.2 Discussion of Specific Models
In the following, selected models are discussed in more detail in the context of the proposed experiment.
2.2.1 Inverse Seesaw SUSY Model
Despite the fact that the most simple supersymmetric models with light squarks and gluinos were recently excluded by LHC experiments [60, 61, 62, 63, 64, 65, 66, 67, 68, 69, 70, 71, 72, 73, 74, 75, 76, 77, 78, 79, 80, 81, 82, 83, 84] supersymmetry can still exist in nature, just at higher mass scales or in more complex realisations. In many of these realisations with a non-minimal particle content the -penguin contribution discussed above gets significantly enhanced.
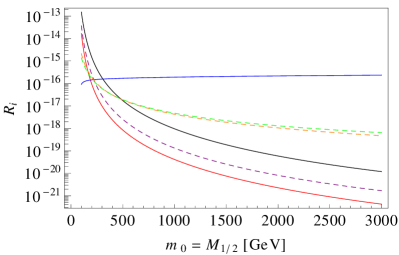
As a first example results obtained by a supersymmetric model with an inverse seesaw mechanism [58] are discussed here. The inverse seesaw model [85] constitutes a very appealing alternative to the standard seesaw realization and can be embedded in a minimal extension of the MSSM by the addition of two extra gauge singlet superfields, with opposite lepton numbers. Similar to other models, e.g. flavour violating Higgs decays in the MSSM, the -penguin exhibits here a non-decoupling behaviour, which is shown in Figure 2.6 for an effective right-handed neutrino mass of and degenerate sterile neutrino masses of . At small mass scales of the constrained MSSM (cMSSM) the photon-mediated penguin contribution clearly dominates over the other contributions from Higgs-mediated penguin and Z-mediated penguin diagrams. This picture completely changes at higher mass scales above - GeV, where the -mediated penguin diagram becomes dominant. The non-decoupling behaviour of the -penguin is clearly visible which will allow to test this model at any SUSY mass scale for the seesaw parameters given in this example at phase II of the proposed experiment.
2.2.2 Supersymmetric Model

This model represents a supersymmetric version of the SM, minimally extended by additional symmetry groups [86, 87]. This model includes the generation of light neutrino masses by the seesaw mechanism, can explain the observed large neutrino mixing angles and can be easily embedded into a grand unified theory. This model predicts an additional light Higgs particle, which is expected to mix with the lightest MSSM Higgs particle, and has been recently studied also in the context of LFV processes [59]. Also in this study it is found that at high SUSY mass scales the photon-mediated LFV penguin diagrams are more suppressed than the -mediated LFV penguin diagrams and that this suppression scales with as naively expected from a dimensional analysis. Branching ratio predictions for the processes and are shown in Figure 2.7 as function of the right-handed neutrino mass for the SUSY model parameters as given in the figure caption. Also here it can be seen that for high masses GeV the -mediated penguin diagram starts to contribute dominantly to the process and that for GeV the process is expected to have an even higher branching fraction than . For even higher masses the non-decoupling behaviour is visible in the prediction.
2.2.3 Other Models
The above discussed enhancement of the -mediated penguin diagram appears also in Little Higgs Models with T-parity (LHT) where ratios have been predicted [53, 54, 88, 89], or in Left-Right Symmetric models with additional Higgs triplets. LFV interactions in Higgs-triplet models can be also generated directly in tree diagrams, see Figure 2.3.
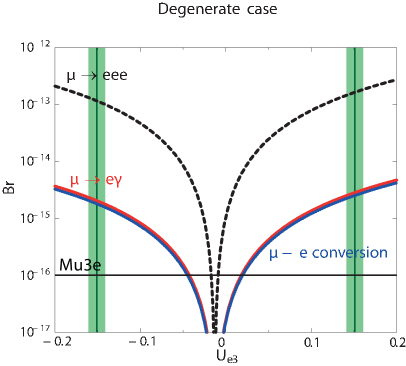
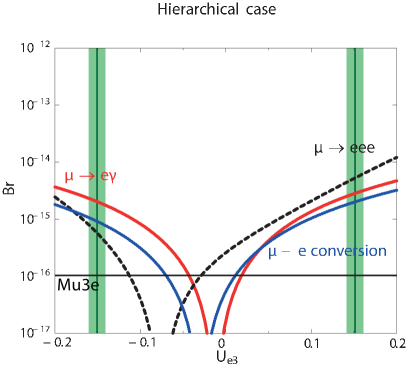
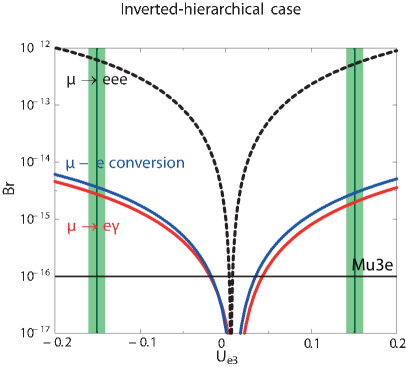
In [11], these LFV violating effects are studied in a model where the Higgs triplet is responsible for neutrino mass generation. Figure 2.8 shows the predicted branching ratios for each of the three LFV muon processes and for different realisations of the neutrino mass hierarchy. Note that the absolute value of the branching ratios depends on the mass scale and can vary. For the hierarchical case, Figure 2.8 b), all branching ratios are expected to be of similar size whereas for the degenerate, Figure 2.8 a), and the inverted case, Figure 2.8 c), the branching ratio dominates in the allowed region of . As the LFV-mediating Higgs triplet boson does not couple to quarks, the decay is enhanced compared to the decay and the muon-to-electron conversion processes, which are both loop suppressed.
This enhancement of the LFV tree diagram is also found to be large in extra dimension models [90, 48] or models with new heavy bosons. In Randall-Sundrum (RS) models [48], flavor changing neutral currents (FCNCs) arise already at the tree level. This is caused by the flavor-dependent couplings of these gauge bosons, due to their non-trivial profiles in the extra dimension. Moreover, FCNCs arise through the exchange of the Higgs boson, as due to the contribution to the fermion masses from compactification, there is a misalignment between the masses and the Yukawa couplings.
Electroweak precision observables suggest that for RS models featuring the Standard Model gauge group, the new-physics mass scale (the scale of the Kaluza Klein excitations) should not be lower than at CL [91, 92, 93]. Thus, without additional structure/symmetries, the experimental situation suggests that it could be challenging to find direct signals from RS models at the LHC. In such a situation, precision experiments, like the measurement of the decay , will furnish the only possibility to see the impact of warped extra dimensions.
2.3 Theory Summary
The search for the decay is in itself of fundamental interest and might reveal surprises not foreseen by any of the models discussed above. This search is largely complementary to other LFV searches, in particular to the decay and to the conversion in muon capture experiments. In a wide range of models for physics beyond the standard model, highest sensitivity in terms of branching ratio is expected for the decay process.
Chapter 3 Experimental Situation
3.1 SINDRUM Experiment
| SINDRUM parameter | Value | |
|---|---|---|
| rel. momentum resolution | () | |
| rel. momentum resolution | () | |
| polar angle | () | |
| vertex resolution | ||
| MWPC layer radiation length in | - |
The SINDRUM experiment was in operation at PSI from 1983-86 to search for the process . No signal was found and the limit was set at CL [15], assuming a decay model with a constant matrix element.
The main components of the experiment were a hollow double-cone shaped target of dimension to stop surface muons of in a solenoidal magnetic field of , five layers of multiwire proportional chambers and a trigger hodoscope. The main tracking parameters which were most relevant for the search sensitivity of the experiment are shown in Table 3.1.
The time resolution obtained by the hodoscope of less than was, together with the achieved momentum resolution, sufficient to suppress the accidental background completely.
After all selection cuts, no candidate event was seen by the SINDRUM experiment. The sensitivity of the experiment was mainly determined by the background process and estimated as [94]; the obtained limit was basically given by the limited number of muon stops.
3.2 MEG Experiment
The MEG experiment at PSI is in operation since 2008 and is searching for the LFV decay . The main components used for event reconstruction are drift chambers for positron detection and a liquid xenon calorimeter for photon detection.
In the first running period in the year 2008 about muons were stopped on target [24]. No signal was found and a limit on the decay of ( C.L.) was set.
After upgrading the detector the search sensitivity and the limit was improved using data taken in the years 2009/2010 to ( C.L.) [14].
The dominant background contribution for comes from accidentals where a high energy photon from a radiative muon decay or from a bremsstrahlung process is recorded, overlayed with a positron from the upper edge of the Michel spectrum. This accidental background mainly determines the final sensitivity of the experiment.
The amount of background is predominantly determined by the timing, tracking and energy resolution. Selected resolution parameters as achieved in the 2009 run are summarized in Table 3.2. The MEG experiment will continue operation until middle of 2013. The final sensitivity is expected to be a few times . The collaboration has started to discuss possible upgrades to further improve the sensitivity by about one order of magnitude. These numbers are to be compared to the bound from the earlier MEGA experiment of [13].
| MEG parameter 2011 publ. | Value |
|---|---|
| rel. momentum resolution | (core) |
| polar angle | |
| azimuthal angle | |
| radial vertex resolution | |
| long. vertex resolution : |
The study of the decay sets stringent bounds on models predicting new heavy particles mediating LFV dipole couplings. These dipole couplings can also be tested in the process , where the sensitivity is reduced by a factor of (note however that for also box diagrams, -mediated penguin diagrams and tree digrams contribute as described in chapter 2). In the case that the LFV dipole couplings are dominant, the projected sensitivity of of the MEG experiment corresponds accordingly to a sensitivity of about in the search for the decay and the envisaged sensitivity of corresponds to more than one order of magnitude higher sensitivity compared to the MEG experiment.
| Decay | Belle limit | Babar limit | Belle II proj. | Belle II proj. | SuperB proj.1 |
|---|---|---|---|---|---|
| channel | () | () | () | ||
| [26] | [27] | [42, 43] | [42, 43] | [96] | |
| [26] | [27] | [96] | |||
| [34] | [28] | [42, 43] | [42, 43] | [96] | |
| [34] | [28] | [96] | |||
| [25] | [33] | [42, 43] | [42, 43] | [96] | |
| [25] | [33] | [96] | |||
| [35] | [31] | [96] | |||
| [35] | [31] | [96] |
1 The SuperB projections assumed a polarized electron beam; they also assumed that all backgrounds except initial state radiation can be suppressed to the desired level. The SuperB project was canceled in November 2012.
3.3 Muon Conversion Experiments
Muon to electron conversion experiments on nuclei exploit the clear signature of monochromatic electrons. Differently to the search for LFV muon decays, which are performed using DC anti-muon beams in order to reduce accidental backgrounds, muon conversion experiments are performed using pulsed muon beams to reduce the rapidly decaying pion background. A limitation of this type of experiment is the background from ordinary decays of captured muons with large nuclear recoil and from pions.
The most stringent limits for muon-electron conversion on various nuclei have been obtained by the SINDRUM II collaboration [97, 98, 16]. The strongest limit has been set using a gold target [16].
Similar to the process, the sensitivity to dipole couplings in muon conversion is reduced by about compared to the more direct search. However, new experiments planned at Fermilab (Mu2e [46, 99, 100]) and at J-PARC (COMET [101, 102, 45] and PRISM [103, 104]) aim for branching ratios of or smaller relative to the captured muon decay and have a higher sensitivity to LFV dipole couplings than the running MEG experiment. Similar to the process, also four-fermion couplings are tested in conversion experiments. These couplings involve light quarks and are thus complementary to all other LFV search experiments.
The Mu2e and COMET experiments are ambitious projects and are expected to come into operation at earliest by the end of this decade. In a few years time the DeeMe experiment at J-PARC [44] will start taking data, aiming for a sensitivity for muon-to-electron conversions of .
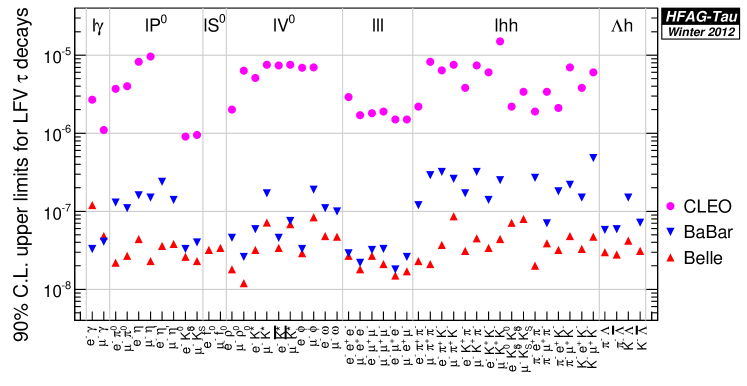
3.4 LFV in Decays
A wide variety of LFV decay channels are open in decays. These decay modes have been extensively explored at the -factories, producing limits on branching ratios of a few , see Table 3.3 and Figure 3.1. The next generation of experiments at colliders could push these limits down by one to two orders of magnitude. For certain channels such as , the LHCb experiment could also be competitive given the luminosity expected in the coming years [107, 108].
3.5 LFV at the Large Hadron Collider
LFV signatures might be observed at the LHC if e.g. supersymmetric particles are discovered, which naturally generate LFV couplings in slepton mass mixing. Consequently, if sleptons are light enough to be produced in pairs, different lepton flavors might show up in decay chains such as: .
Known and new scalar or vector particles could also have lepton violating tree couplings and might be directly reconstructed from resonance peaks: or . Due to the existing bounds on flavor changing processes, these LFV decays are small and difficult to detect above the large background from -production with subsequent leptonic decays. It seems however, that with high enough luminosities, the LHC can e.g. go beyond the LEP bounds [109, 110, 111, 112] on LFV decays [113].
If new particles exist at the TeV mass scale, i.e. in the discovery reach of the LHC, it is very likely that precision experiments will discover lepton flavor violation via radiative loops. Dedicated LFV search experiments like the proposed experiment would then allow one to measure the LFV couplings of the new particles, complementary to the scale experiments at the LHC.
Chapter 4 The Decay
4.1 Kinematics
The decay proceeds promptly. For discriminating signal and background, energy and momentum conservation can be exploited. The vectorial sum of all decay particle momenta should vanish:
| (4.1) |
and the total energy has to be equal to the muon mass.
The energies of the decay electrons (positrons) are in the range . All decay particles must lie in a plane and the decay is described by two independent variables in addition to three global rotation angles, which describe the orientation in space.
4.2 Detector Acceptance

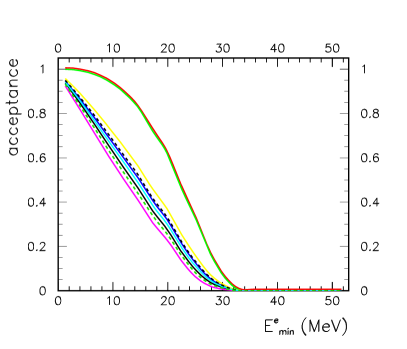
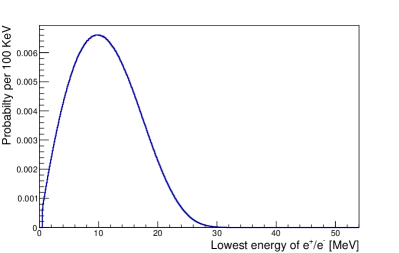
The acceptance of the proposed experiment is determined by its geometrical acceptance and energy coverage. For various coupling assumptions about the LFV amplitude, see also equation 2.1, the energy spectrum of the highest energy, , and lowest energy decay particles, , are shown in Figures 4.1 and 4.2, respectively. In order to achieve a high acceptance, the detector must be able to reconstruct tracks with momenta ranging from half the muon mass down to a few with large solid angle coverage. The proposed experiment should cover the energy range to provide acceptances of or more for all models.
4.3 Backgrounds
The final sensitivity of the proposed experiment depends on the ability to reduce backgrounds from various sources. Two categories of backgrounds are considered; irreducible backgrounds, such as , which strongly depend on the granularity and resolution of the detector, and accidental backgrounds that scale linearly or with the square of the beam intensity.
In the following sections, the main background sources considered are discussed.
4.3.1 Internal Conversions
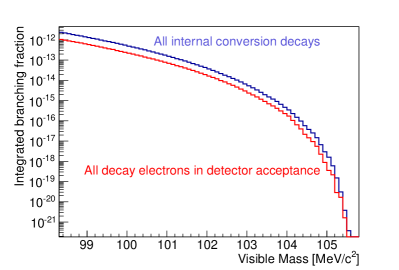
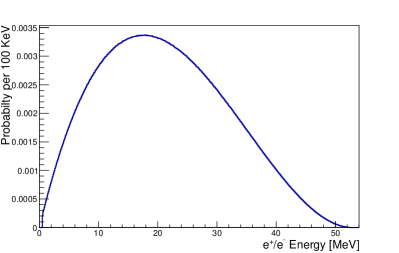
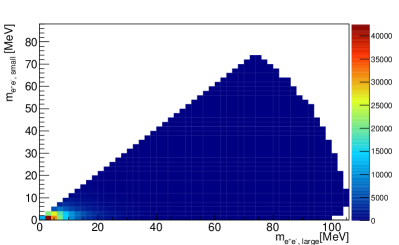
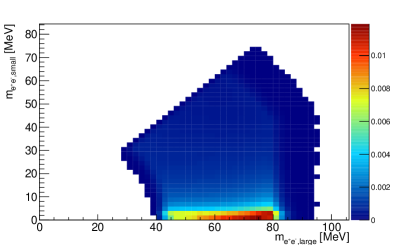
The decay occurs with a branching fraction of [117]. It can be distinguished from the process by making use of energy and momentum conservation to reconstruct the undetected neutrinos; in order to separate the events from events, the total momentum in the event is required to be zero and the energy equal to the muon rest energy. The branching fraction as a function of the energy cut of the process [116] is shown in Figure 4.3. Figures. 4.4 and 4.5 show the energy spectrum of all and the lowest energy electron from internal conversion decays, Figs. 4.6 and 4.7 the invariant masses of combinations calculated with the matrix element from [116]. This process is the most serious background for the search and can only be resolved by a very good energy resolution.
4.3.2 Michel Decays
Using a beam of positive muons, one of the main processes contributing to accidental background is that of the ordinary Michel decay . This process does not produce a negatively charged particle (electron), which is one of the main characteristics of the decay, and can therefore only contribute as potential background if a track is wrongly reconstructed. Other processes which “naturally” provide negatively charged tracks (electrons) are radiative decays with internal or external photon conversions or Bhabha scattering.
4.3.3 Radiative Muon Decays
The process (branching fraction for photon energies above [117]) can deliver an oppositely charged electron if the photon converts either in the target region or in the detector. Contributions from conversions outside of the target are greatly suppressed if a vertex constraint is applied and by minimizing the material in both the target and detector. Photon conversion in the target generates an event topology similar to the radiative decay with internal conversion: , which is discussed above.
Due to the missing energy from the neutrinos, this process mainly contributes to the accidental background in combination with an ordinary muon decay.
4.3.4 Bhabha Scattering
Positrons from the ordinary muon decay or beam-positrons can undergo Bhabha scattering with electrons in the target material, leading to an electron-positron pair from a common vertex. Due to the missing energy, this process mainly contributes to the accidental background in combination with an ordinary muon decay.
4.3.5 Pion decays
Certain decays of pions, especially (branching fraction [117]) and (branching fraction [117]) with subsequent photon conversion are indistinguishable from signal events if the momenta of the final state particles fit the muon mass hypothesis; a low pion contamination of the primary beam (estimated to be in the order of for the high intensity beamline), the small branching fraction and the small slice of the momentum is assumed to lead to negligible rates in the kinematic region of interest.
4.3.6 Summary of Background Sources
First simulation studies have been performed to calculate the different background contributions. Their results indicate that purely accidental backgrounds for muons stops per second are small for the proposed high resolution detector.
The main concern are irreducible backgrounds, such as the process , which can only be reduced by a very good tracking resolution resulting in total energy resolution of for the aimed sensitivities .
Part II The Mu3e Experiment
Chapter 5 Requirements for Mu3e
5.1 Goals of the Experiment
The goal of the Mu3e experiment is to observe the process if its branching fraction is larger than or otherwise to exclude a branching fraction of at the certainty level. In order to achieve these goals, muon decays have to be observed111Assuming a total efficiency of . and any background mimicking the signal process has to be suppressed to below the level. The additional requirement of achieving these goals within a reasonable measurement time of one year of data taking dictates a muon stopping rate of and a high geometrical acceptance and efficiency of the experiment.
We plan to perform the experiment in two phases. The exploratory phase I will make use of existing muon beams at PSI and serve to commission the detectors, gain experience with the new technologies and validate the experimental concept, whilst at the same time producing a competitive measurement. The goal for this first phase is to reach a sensitivity of , thus pushing the existing limit by three orders of magnitude. For this level of sensitivity, the demands on the detector are somewhat relaxed, thus allowing for cross-checks between detectors also on analysis level or running without the full instrumentation. The lower data rates also will not require the full read-out and filter farm system. The second phase of the experiment on the other hand will aim for the ultimate sensitivity and thus require that the detector works as specified and a new beamline delivers of muons.
The expected rate at an existing beamline is of muons on target. In order to have a safety margin, we usually assume for phase I background studies, except where the running time is concerned.
This proposal discusses the phase I experiment in detail and shows the path leading to full rate capability. We also discuss alternative approaches.
5.2 Challenges for the Experiment
5.2.1 Backgrounds
There are two kinds of backgrounds: Overlays of different processes producing three tracks resembling a decay (accidental background) and radiative decays with internal conversion (internal conversion background) with a small energy fraction carried away by the neutrinos. Accidental background has to be suppressed via vertexing, timing and momentum measurement, whereas momentum measurement is the only handle on internal conversion.
5.2.2 Geometric acceptance
For a three-body decay with a priori unknown kinematics such as , the acceptance has to be as high as possible in order to test new physics in all regions of phase space. There are two kinds of acceptance losses, losses of tracks downstream or upstream, where beam entry and exit prevent instrumentation, and losses of low transverse momentum tracks, which do not transverse a sufficient number of detector planes, and are not reconstructed.
5.2.3 Rate capability
The Mu3e detector should be capable of running with of muon decays. This poses challenges for the detectors, the data acquisition and the readout.
5.2.4 Momentum resolution
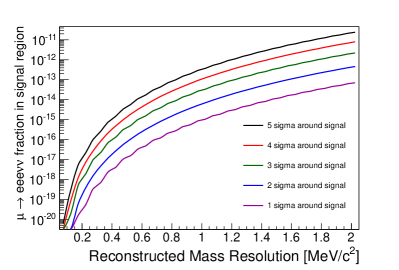
The momentum resolution directly determines to what level internal conversion background can be suppressed and thus to which level the experiment can be ran background free. In order to reach a sensitivity of with a cut on the reconstructed muon mass, the average momentum resolution has to be better than . For the phase I experiment aiming at , this requirement is relaxed to , see Figure 5.1.
5.2.5 Vertex resolution
Keeping apart vertices from different muon decays is a key tool in suppressing accidental background. The vertex resolution is essentially determined by the amount of multiple scattering (and thus material) in the innermost detector layer. Ideally the vertex resolution is sufficient to eliminate almost all combinatorial backgrounds; for the phase I rates, this appears achievable, whereas in the phase II experiment, very good timing is needed in addition.
5.2.6 Timing resolution
Good timing is essential for reducing combinatorial background at rates which lead to more than about 10 muon decays per frame on average.
Chapter 6 Experimental Concept
The Mu3e detector is aimed at the background free measurement or exclusion of the decay at the level of . As discussed in more detail in the preceding chapter 5, these goals require to run at high muon decay rates, an excellent momentum resolution in order to suppress background from the internal conversion decay and good vertex and timing resolution in order to efficiently suppress combinatorial background.
We intend to measure the momenta of the muon decay electrons in a solenoidal magnetic field using a silicon pixel tracker. At the electron energies of interest, multiple Coulomb scattering in detector material is the dominating factor affecting momentum resolution. Minimizing this material in the active detector parts is thus of utmost importance.
The proposed detector consists of an ultra thin silicon pixel tracker, made possible by the High-Voltage Monolithic Active Pixel (HV-MAPS) technology (see chapter 10). Just four radial layers around a fixed target in a solenoidal magnetic field allow for precise momentum and vertex determination. Two timing detector systems guarantee good combinatorial background suppression and high rate capabilities.
The Mu3e experiment is designed to have a sensitivity four orders of magnitude better than the current limit on (), so it is reasonable to plan for a staged detector design, with each stage roughly corresponding to an order of magnitude improvement.
6.1 Momentum Measurement with Recurlers
Due to the low momenta of the electrons from muon decay, multiple scattering is the dominating effect on momentum measurement. With our fine-grained pixel detector, we are thus in a regime where scattering effects dominate over sensor resolution effects, see Figs. 6.1 and 6.2. Thus adding additional measurement points does not necessarily improve the precision.
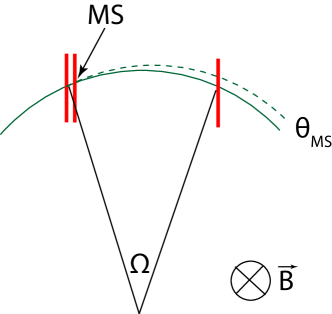
The precision of a momentum measurement depends on the amount of track deflection in the magnetic field and the multiple scattering angle , see Figure 6.3; to first order:
| (6.1) |
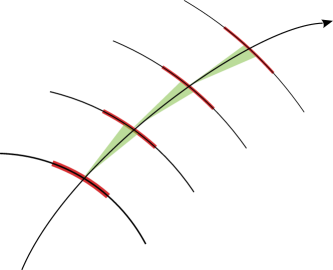
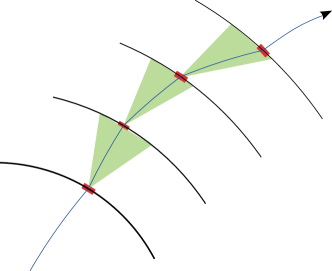
So in order to have a high momentum precision, a large lever arm is needed. This can be achieved by moving tracking stations to large radii, which however compromises the acceptance for low momentum particles. In the case of muon decays, all track momenta are below and all tracks will thus curl back towards the magnet axis if the magnet bore is sufficiently large. After exactly half a turn, effects of multiple scattering on momentum measurement cancel in first order, see Figure 6.4. To exploit this feature we optimized the experimental design specifically for the measurement of re-curling tracks, leading to a narrow, long tube layout.
Measuring the momentum from bending outside of the tracker also allows us to place timing detectors inside, without strongly affecting the resolution.

6.2 Baseline Design
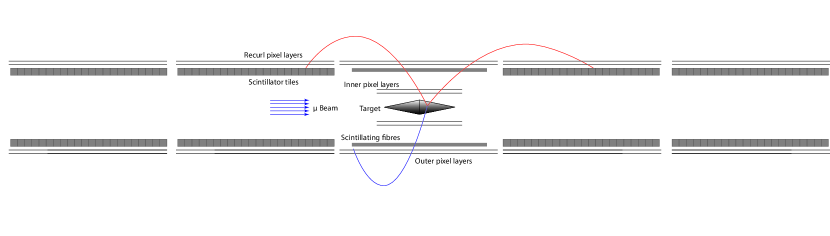
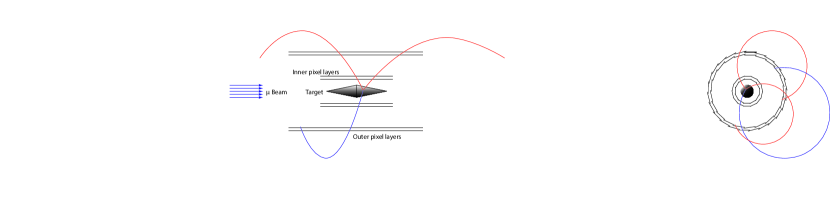
The proposed Mu3e detector is based on two double layers of HV-MAPS around a hollow double cone target, see Figures 6.5 and 6.6. The outer two pixel sensor layers are extended upstream and downstream to provide precise momentum measurements in an extended region with the help of re-curling electrons. The silicon detector layers (described in detail in chapter 10) are supplemented by two timing systems, a scintillating fibre tracker in the central part (see chapter 11) and scintillating tiles (chapter 12) inside the recurl layers. Precise timing of all tracks is necessary for event building and to suppress accidental combinatorial background.

The entire detector is built in a cylindrical shape around a beam pipe, with a total length of approximately , inside a solenoid magnet with inside diameter and total length (chapter 8). In the longitudinal direction the detector is sub-divided into five stations, the central detector with target, inner silicon double layer, fibre tracker and outer silicon double layer, and two forward and backward recurl stations with two silicon recurl layers surrounding a tile timing detector. In order to separate tracks coming from different muon decays, the target has a large surface with length and diameter. The target shape is a hollow double cone, see chapter 9. Around the target the two inner silicon pixel layers, also referred to as the vertex layers, cover a length of . The innermost layer will have 12, the second one 18 sides of each, corresponding to an average radius of and , respectively. The inner silicon layers are supported by two half cylinders made from thin Kapton foil mounted on plastic end pieces. All silicon sensors are thinned to , resulting in a radiation length of X/X per layer. The detector will be cooled with gaseous helium.
The hit information from the silicon sensors is read out at a rate of MHz using timestamps providing a time resolution of ns.
The fibre tracker sits inside silicon pixel layer three at around , providing timing information for decay positrons and electrons. It is composed from three to five layers of thick long scintillating fibres, see Figure 6.6. The fibre tracker is read out by fast silicon photo multipliers and can provide timing information with accuracy.
The silicon pixel layers three and four are just outside the fibre tracker at a mean radius of and . The active area has a cylindrical shape of length. The layer three has 24 sides, layer four 28 sides of width each. Both outer layers are constructed as modules of 4 sides, six modules for layer three and seven modules for layer four. Similar to the inner two layers the mechanical frames of these modules are build from Kapton foil with plastic end pieces.
Copies of silicon pixel layer three and four are also used in the recurl stations. Two recurl stations each are covering the upstream and downstream regions. These recurl stations add further precision to the momentum measurement of the electrons, see section 6.1. While the silicon layer design is (almost) identical to the central part, the timing detector in the recurl region can be much thicker compared to the fibre tracker, as the particles can and should be stopped here. This is done by using scintillating tiles of about size. These tiles provide a much better time resolution than the thin fibre tracker in the center. Following the dimensions of the recurl silicon layers, the tile station have a active length of and a cylindrical shape with a radius of . All central detector components are mounted on spokes providing a light stiff support. The recurl silicon layers and tiles are mounted on the beam pipe support. In addition to the silicon and scintillating tile sensors the beam pipe support also carries the services and the PCBs equipped with the front-end electronics (chapter 13). Signal and power connection to the silicon layers is provided by flex prints which are also part of the mechanical support of the silicon sensors.
6.3 Building up the Experiment
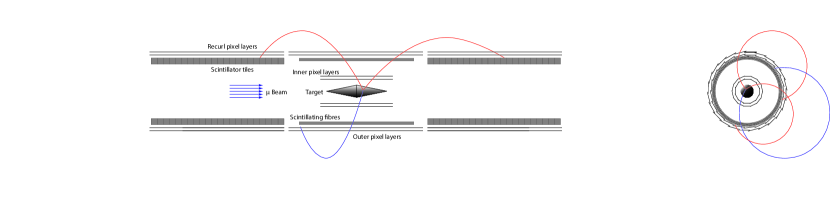
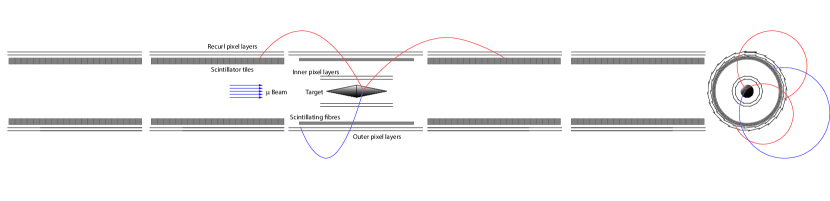
One of the advantages of the design concept presented is its modularity. Even with a partial detector, physics runs can be taken. The full instrumentation is only required for achieving the final sensitivity of at muon rates above . On the other hand, in an early commissioning phase at smaller muon stopping rates, the detector could run with the central silicon detector only (see Figure 6.7). The silicon detectors of the recurl stations are essentially copies of the central outer silicon detector; after a successful commissioning of the latter, they can be produced and added to the experiment as they become available together with the connected tile detectors. The fibre tracker can also be added later, since it is only needed to resolve combinatorial background at higher event rates and track multiplicities. The loss of momentum resolution due to multiple scattering at the additional material of the fibre tracker will be fully compensated by the improved momentum measurement with re-curlers. The configuration with two recurl stations (Figure 6.8) defines a medium-size setup, well suited for phase I running. The configuration with four recurl stations (Figure 6.9) defines the full setup for phase II running.
In the following sections, the experimental configurations for running at the existing E5 beam-line (the Phase I Experiment) and the final detector for running at muon stopping rate (the Phase II Experiment) are outlined.
6.4 The Phase I Experiment
The phase I of the Mu3e experiment will start with a minimum configuration (phase IA detector) with the target regions surrounded by double layers of inner and outer silicon pixel detectors, see Figure 6.7. This configuration defines the minimal configuration as it allows to determine the momentum, the vertex position and the time of the decay precise enough to produce very competitive physics results with a sensitivity down to ). It is foreseen to run in the first year in this configuration at a muon stopping rate on target at around . The number of decays in one readout frame of the pixel tracker of will be around one on average and combinatorial background can be suppressed with the help of the vertex reconstruction. The precision of the momentum resolution will be somewhat limited, as most tracks do not recurl within the instrumented volume, see chapter 17.
In the phase IB the detector will be complemented by the first pair of recurl stations, the corresponding tile detectors and the fibre tracker, see Figure 6.8. Adding the recurl stations will significantly enhance the momentum resolution and thus improve the suppression of internal conversion background. The insertion of the fibre tracker and the tile detector stations gives a much better time resolution in comparison to the silicon pixel only. The fibre tracker will deliver a time resolution of about -, while the tile detector will have resolution for the tracks passing the recurl stations. The high time resolution will allow running at the highest possible rate at the E5 muon beam line at PSI of . The sensitivity reach in this phase of the experiment of will be limited by statistics only. limited by the available muon decay rate.
6.5 The Phase II Experiment
A new high intensity muon beam line [118] delivering muon stops is crucial for the phase II of the proposed experiment. To fully exploit the new beam facility the limited detector acceptance at phase IB will be further enhanced by adding another a second pair of recurl and tile detector stations, see Figure 6.9. These extra stations will allow to measure precisely the momentum of all particles in the acceptance of the inner tracking detector. At the same time the extra tile detector stations with their high time resolution and small occupancy will help to fight the increased combinatorics at very high decay rates. The combined performance of the final detector setup together with the high stopping rate will allow to search for the decay with a sensitivity of B().
Chapter 7 Muon Beam
7.1 General Beam Requirements
The general beam requirements for a high intensity, low-energy, stopped muon coincidence experiment such as Mu3e are six-fold: an abundant supply of low-energy surface muons (from stopped pion decay at rest, at the surface of the production target [119]) capable of being stopped in a thin target; high transmission optics at , close to the kinematic-edge of stopped pion decay and hence close to the maximum production rate of such muons, as shown in Figure 7.1; a small beam emittance to minimize the stopping-target diameter; a momentum-byte of less than with an achromatic final focus, allowing an almost monochromatic beam with a high stopping density, to be stopped in a minimally thick target; minimization and separation of beam-related backgrounds such as beam originating from -decay in the production target, or decay particles produced along the beam line and finally minimization of material interactions in the beam, for example such as those in windows, thus requiring vacuum or helium environments to keep the multiple scattering under control.
7.2 Beam for phase I running
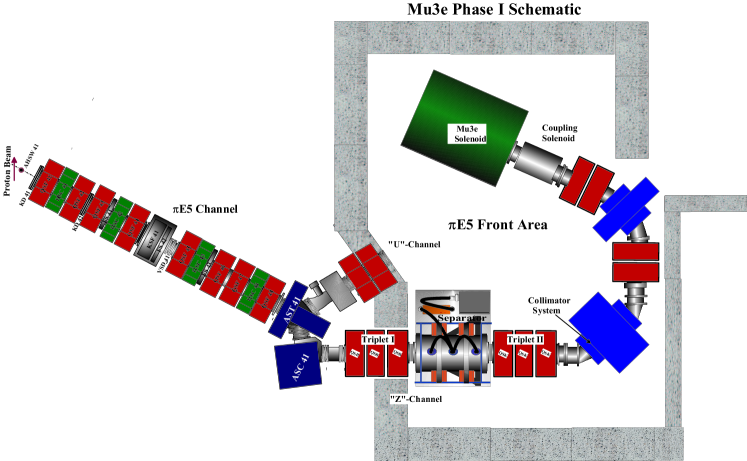
As previously outlined, a multi-staged detector configuration will be sought for phase I running, this in turn requires muon beam intensities ranging between for the initial phase IA (central detectors), while for phase IB a maximal intensity close to muons/s will be sought. The quoted maximum beam intensity which includes a phase space reduction factor due to collimation in the central region of the Mu3 magnet is based on measured intensities at the centre of the MEG detector, without a degrader and normalized to a proton beam current of . This demand for the highest intensities necessitates the selection of only one possible facility in the world, namely the E5 channel at PSI. Based on the experience gained in the design of the MEG beam line, a similarly developed concept is also envisaged for phase I of Mu3e. This should allow the required muon intensity to be achieved. However, since the area is likely to be shared with other experiments, that of MEG (R-99-05), and the Lamb-shift experiment (R-98-03) a compact muon beam line designed specifically to fit into the front-part of the E5 area is under design. This would not only allow the beam line elements, such as the Wien-filter, triplet I and II, plus the MEG collimator system to be used by this experiment, but would also allow access to the MEG detector during running periods, by means of placing a shielding wall just upstream of the MEG detector, as previously adopted during the run periods of experiment R98-03.
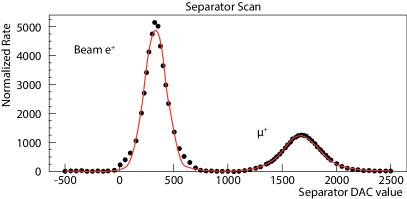
Figure 7.2 shows the potential area layout adopted. Surface muons of will be extracted from the E5 “Z-channel” and the initial part of the current MEG beam line, including: Triplet I, the crossed-field Wien-filter, Triplet II and the collimator system. This combination of elements allows for an optimal beam correlated background suppression, as demonstrated in Figure 7.3, which shows the separation quality post collimator, between muons and beam positrons for the above mentioned section of beam line. Due to the severe restrictions imposed by space, a matching section, including two dipole magnets of and bending angles respectively, with an intermediate quadrupole doublet or triplet, is envisaged. A final doublet/triplet or intermediate transport solenoid would in turn couple the beam line to the Mu3e superconducting magnet. The beam line vacuum is currently planned to end close to the centre of the target and includes collimation to match the beam-spot to the target size and prevent beam interactions from occurring directly in the small radii inner silicon layers. The expected usable muon intensity at the Mu3e target is between .
Although it is understood that simultaneous running of prospective E5 experiments is not possible, it is nevertheless clear that the Mu3e phase I beam line will in fact benefit from the availability of MEG beam elements upstream of the detector and that this option, together with provision of the available standard PSI magnets currently in storage or potentially sharable, would cover most of the beam line requirements, except that of a short coupling solenoid, for which a potential solution is also currently under study and possible dipole vacuum chamber modifications.
| Laboratory/ | Energy/ | Present Surface | Future estimated |
| Beam line | Power | rate (Hz) | rate (Hz) |
| PSI (CH) | (590 MeV, 1.3 MW, DC) | ||
| LEMS | " | ||
| " | |||
| HiMB | (590 MeV, 1 MW, DC) | ||
| J-PARC (JP) | (3 GeV, 1 MW, Pulsed) | ||
| currently 210 KW | |||
| MUSE D-line | " | ||
| MUSE U-line | " | (2012) | |
| COMET | (8 GeV, 56 kW, Pulsed) | (2019/20) | |
| PRIME/PRISM | (8 GeV, 300 kW, Pulsed) | () | |
| FNAL (USA) | |||
| Mu2e | (8 GeV, 25 kW, Pulsed) | (2019/20) | |
| Project X Mu2e | (3 GeV, 750 kW, Pulsed) | () | |
| TRIUMF (CA) | (500 MeV, 75 kW, DC) | ||
| M20 | " | ||
| KEK (JP) | (500 MeV, 2.5 kW, Pulsed) | ||
| Dai Omega | " | ||
| RAL -ISIS (UK) | (800 MeV, 160 kW, Pulsed) | ||
| RIKEN-RAL | |||
| RCNP Osaka Univ. (JP) | (400 MeV, 400 W, Pulsed) | ||
| MUSIC | currently max 4W | (2012) | |
| means per MW | |||
| DUBNA (RU) | (660 MeV, 1.65 kW, Pulsed) | ||
| Phasatron Ch:I-III |
7.3 High intensity muon beamline for phase II running
In order to reach the ultimate sensitivity goal of for the phase II experiment, an unpulsed muon stopping rate in the region is required. As demonstrated in Table 7.1, there are no such (pulsed or unpulsed) high-intensity sources of muons currently available world-wide. Future intensity frontier facilities are however in the planning in the US and Japan and are also associated with LFV-experiments, more specifically Mu2e and Project X in the U.S. [46, 99] and the COMET and PRIME/PRISM experiments in Japan [101, 45]. To meet the needs of such experiments a totally new concept is therefore necessary. One such concept, which is still in its infancy, though is proving to be a promising candidate, is the HiMB project at PSI [118], a next-generation high-intensity muon beam, currently under study. A detailed feasibility study is due to start at PSI in 2013. This concept would provide the basis for a new Mu3e beam line for the phase II measurements, based on the production of surface muons from the Swiss Spallation Neutron Source’s (SINQ) spallation target window.
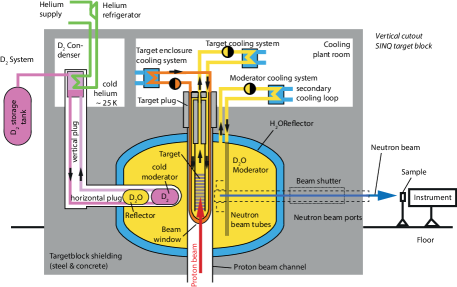

The layout of the source in the SINQ hall [120], together with a schematic diagram of the source with the proton beam injected from below is shown in Figure 7.4. The characteristics of the source, which resembles a medium-flux reactor, are that the protons are injected from below and defocussed onto a double-layered aluminium window separated by a D2O cooling layer, before being stopped in the target, a “cannelloni” construct of lead-filled zircaloy tubes.
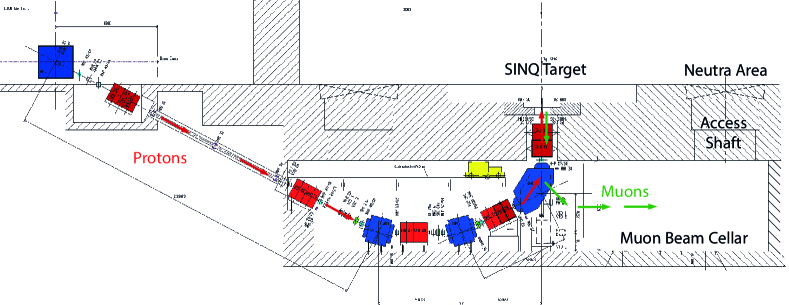
The HiMB project plans to extract the downward travelling muons produced in the aluminium window via a two-stage channel, the first stage, a solenoidal one, which uses the same beam-tube as the upward travelling protons and extracts the muons, in the opposite direction, to a large collection solenoid connecting to the second stage, a conventional dipole and quadrupole channel planned for the empty service cellar under the SINQ target. The general layout of both the proton channel and the service area are shown in Figure 7.5
There are several advantages of this concept, which would lead to a substantial enhancement compared to target E, namely: the increased number of primary proton interactions since of the beam stops in the target; a much larger pion energy range of up to can be exploited in the case of SINQ, above which the high energy tail of the pion production cross-sections becomes negligible, in the case of Target E this limit is around [121, 122]; a substantially larger pion-production volume contribution compared to Target E and finally a significantly larger surface muon production volume.

Realistic Monte-Carlo studies were undertaken together with M. Wohlmuther (Head of the Target Development Group at PSI) using the Los Alamos Laboratory MCNPX code (Monte Carlo n-particle extended code), used also to design the SINQ target. A simulation of the surface muon production rate was made using the complete model of the SINQ target environment. Based on a total of generated upward moving protons, corresponding to the measured 2D beam profile at SINQ, a complete particle tracking was done using three different event generators. For surface muons, the simulated fluences were determined for the conditions of a particle leaving the target with the correct energy, travelling downwards within the beam-pipe and crossing a horizontal plane below the window. This is shown schematically in Figure 7.6. The calculated fluences from the three event generators agreed to within of each other. Based on the standard event generator, which also has the smallest statistical uncertainty, a summed fluence (E) of surface and sub-surface muons of is calculated at a proton current of on target E, which corresponds to on SINQ. However, on the assumption that the proton current on Target E will only rise to a maximum of in the future, a value that has already been achieved during routine test periods since 2010 and taking into account the variation of event generators in the simulation, a conservative estimated fluence of good surface muons within a FWHM momentum-byte could clearly be extracted from the SINQ target (c.f. Table 7.2).
| Rate | ||
|---|---|---|
| MeV/c | FWHM | Hz |
| 28 | Full | |
| 28 | 10 | |
| 26 | 10 |
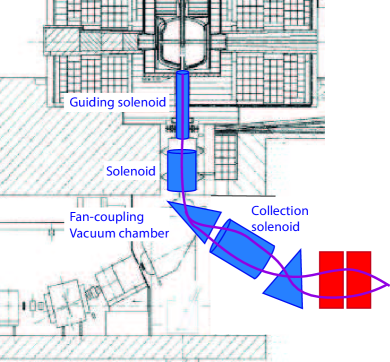
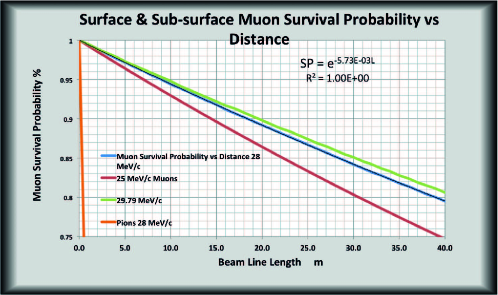
Conclusions seen from the source point of view look very promising and providing the beam can indeed be transmitted without significant losses, the phase II rates of muons could be realized. Finally, the current extraction principle, to be studied extensively in the feasibility study, is demonstrated in Figure 7.7. Muons originating from the target window are to be guided in a downward direction using a low-field guiding solenoid. Since the muon momentum is about a factor of 42 times smaller than that of the protons, the low-field for the muons should not dramatically affect the protons. The present radiation-hardened, defocusing quadrupoles QTH 31 and 32, just below the SINQ target, must be replaced by a rotationally symmetric element such as a solenoid, since the muons will not traverse a set of quadrupoles which only focus alternately in the horizontal and vertical planes but have field strengths that are 42 times too high for the muons. The extraction will be done in the fringe-field of the last dipole magnet AHO, which means that the following strong-focussing collection solenoid must be placed close to the “fan-coupling” in order to fully collect the beam. Following this solenoid is a dipole magnet whose function is to bend the beam onto the horizontal plane, where a conventional secondary beam line quadrupole channel could be constructed. As the current cellar ends within just a few meters of the above SINQ hall wall, one could envisage bending the beam upwards again at the end of the cellar and extracting to a hall, exterior to SINQ, on the East-side. This would imply a relatively long beam line of order , which is not too problematic from the muon loss (decay-in-flight) point-of-view where transmission for muons is expected at , as shown in Figure 7.8. Also shown are similar plots for the maximum momentum at the kinematic edge of pion-decay, as well as for a lower momentum sub-surface muon beam. Finally, the beam would naturally be free of pion contamination to a level of about , which is also important for backgrounds relevant to the decay such as and .
The HiMB project is in its infancy at present and there are many aspects that will be studied in detail within the scope of the planned feasibility study, to show the feasibility of this next generation high-intensity beam line. The initial step taken concerning the muon source intensity, the basis for the HiMB feasibility study, has been shown to be very promising. The next major steps to be studied are the optical extraction of the muons from the proton beam and the solenoidal replacement of the final proton defocussing quadrupole doublet in front of the SINQ target, while still maintaining the safety restraints on the SINQ target. The implementation of such a concept into the SINQ environment could only coincide with a major SINQ shutdown, which is currently planned for the period of 2016-2017.
Chapter 8 Magnet
The magnet for the Mu3e experiment has to provide a homogeneous solenoidal magnetic field for the precise momentum determination of the muon decay products. In addition it will also serve as beam optical element guiding the muon beam to the target. The basic parameters of the superconducting solenoid magnet, which are currently being specified for the preparation of order placements, are given in Table 8.1. The outer dimensions include also an iron field shield.
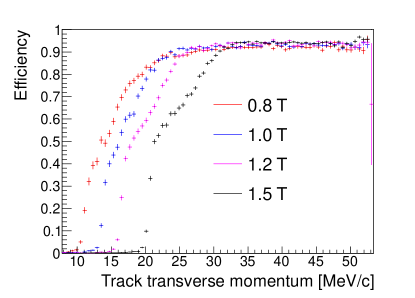
The nominal magnetic field strength is in the central part, providing the optimum bending radius in terms of resolution for the proposed experimental design. A higher magnetic field would lead to a loss of acceptance as the low momentum particles would not reach the central outer pixel layers (see Figure 8.1). A lower magnetic field would lead to less magnetic deflection at constant multiple scattering, leading to worse momentum resolution (see Figure 8.2). For systematic studies and to allow for possible reuses of the magnet for other experimental measurements, the field can be varied between 0.8 and .
The dimensions of the cylindrical warm bore of the magnet are in diameter and in length. The minimum diameter is given by four times the bending radius of the highest momentum () decay products at the lowest possible field of plus the target diameter. In addition the detector support and extraction rail system has to be taken into account when choosing the warm bore diameter.
The total length is a compromise between geometric acceptance for recurling particles and the very tight space constraints for the phase I experimental area at E5. In principle a longer solenoidal magnet would provide an intrinsically more homogenous field. At both ends of the magnet it is foreseen to have full access by means of removable flanges.
| Magnet parameter | Value |
|---|---|
| field for experiment | |
| field range | |
| warm bore diameter | |
| warm bore length | |
| field description | |
| field stability (100 days) | |
| outer dimensions: length | |
| width | |
| height |

While the ideal magnet would have a constant field throughout the inner volume, real solenoid magnets show a drop in field to at the end of the coil. The simplest solution would be a longer magnet, which however does not fit inside the phase I area. Another possibility is to introduce correction coils at both ends of the magnet, such that the high field region can be extended. The insertion of several compensating coils would make the magnet system more complex both in construction and operation due to the need of additional current settings and power supplies. At present the baseline magnet concept foresees three equal coils with a single power supply. The field change along the z-axis has to be taken into account for the reconstruction of tracks in the recurl stations by using a look up table for the field map plus interpolation between these points. Choosing the right granularity for the look-up table a linear interpolation of the field will be enough to reach an approximation of . For the fast online selection of events the assumption of a constant field in the active part of the experiment will be sufficient. Though the assumption of a constant (maximum) field leads to an systematic bias towards larger momenta and an increase of online selected background events from internal radiative muon decays with internal conversions, no signal events would be lost.
The superconducting magnet is made from three coils of equal size, which has advantages over one long coil in terms of mechanical stability. The small dips in the magnetic field can be treated numerically in the same way as the roll-off of the field to the ends of the magnet. The choice for the superconducting wires or conductors will be driven by commercial availability, since standard components allow for the desired maximum field strength. A warm normal conducting magnet is no option because of size, cost (copper price) and operational stability. Superconducting magnets have an intrinsic immunity against absolute field changes, as they have to run at a constant (low) temperature. If feasible in terms of number of cooling compressors, a dry cooled system will be chosen.
There will be a magnetic shielding around the magnet. The shielding is required since the experimental hall is densely populated with other experiments and infrastructure. Also for the read-out of the proposed experiment it will be much easier to work in a low field environment. A beneficial side effect of the shielding is a gain of field homogeneity inside the magnet and less field dependence on variation of outside parameters.
The long term stability of the magnetic field should be over each 100 day data taking period. This can be achieved by using state of the art magnet power supplies and by permanent measurement of the absolute field with a hall probe inside the experiment.
The cool-down time for a system of the projected size will be one week and the ramp time will be in the order of one hour. The number and power of the dry compressors will be chosen to fulfill these requirements, in the case of a dry cooled magnet.
The D0 Magnet [123] fulfills most requirements of the future Mu3e magnet and serves as a prototype for the magnet design process.
Chapter 9 Stopping Target
The main challenge for the design of the stopping target is to optimize the stopping power on one hand and to minimize the impact on the track measurement on the other hand. Therefore the stopping target should contain just enough material in the beam direction to stop most of the surface muons but should be as thin as possible in the flight direction of decay electrons measrued in the detector acceptance. Usage of a low material is advantageous as tails from large angle Coulomb scatterering are suppressed. In addition, the decay vertices should be spread out as widely as possible in order to reduce accidental coincidences of track vertices and to produce a more or less even occupancy in the innermost detector layer.
9.1 Baseline Aluminium Design
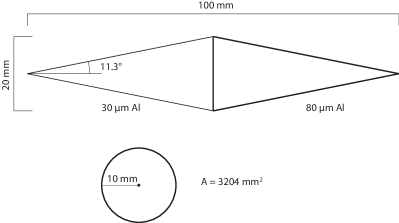
These requirements can be met by a hollow double cone target à la SINDRUM [15, 94]. In our baseline design (see Figure 9.1), the target is made from of aluminium in the front part and aluminium in the back part, with a total length of and a radius of . This results in an total area of and an effective target thickness in beam direction of corresponding to 0.063 radiation lengths of Aluminium. The target can be suspended from the innermost tracking layer by e.g. nylon fishing wire (which we assume in the simulation) and which does not significantly add material in the beam line.
In the Geant4 [124] simulation (see 15), about 83.3% of the muons111Muons are generated with an energy spectrum modeling the one observed in MEG. that reach the target are stopped. Obviously, this fraction can be increased by adding material, which will however lead to additional multiple scattering and thus a reduced momentum resolution. For the phase I experiment, where muon rates rather than momentum resolution is limiting the sensitivity, a thicker target could be envisaged.
Stopping muons in the target corresponds to about of power. Compared with the power dissipation of the sensor chips, this is negligible and easily taken care of by the helium cooling.
9.2 Vertex distribution
The distances between tracks on the target can be reconstructed already online and used by the event filter farm to reject frames containing only background, see section 14. The only physics process exhibiting three tracks from the same vertex is the radiative muon decay with an internal conversion at a rate of .
The simulated distribution of vertices (more precisely: intersections of simulated particles with the target) is shown in Figures 9.2 and 9.3. In the longitudinal direction, the effect of the thicker material in the back part can be clearly discerned, whereas for the transverse view, the “shadows” of the target suspension are visible in the projected beam profile.
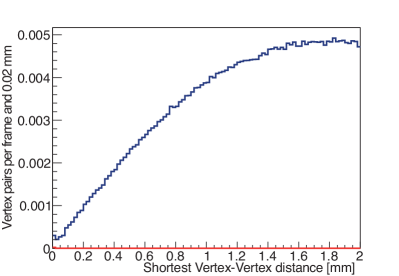
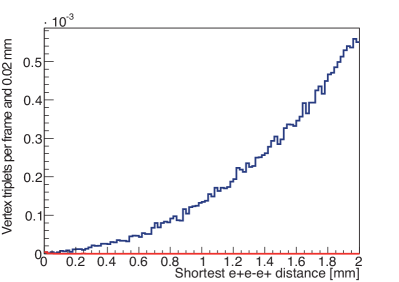
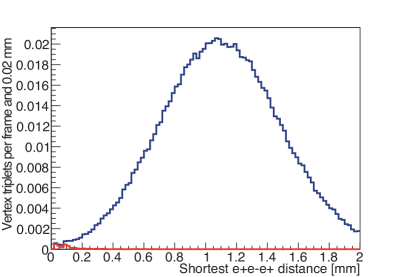
Figure 9.4 shows the shortest distance between two vertices in a frame for muon stop rate. Less than 10% of the frames have tracks that come within of each other on the target. Figure 9.5 shows the shortest distance within which three tracks approach on the target surface; one of the tracks has to be assigned negative charge, either because it is a true electron or a recurling positron track. Figures 9.6 show the same distributions for muon stop rate. Here all frames have two tracks approaching to closer than a millimeter, but a three track coincidence requirement still has a considerable suppression power, which can surpass a factor of , if recurlers can be identified with high efficiency (see also chapter 14).


9.3 Alternative Designs
9.3.1 Material Alternatives
If the aluminium foil design proves unworkable or not mechanically stable enough, it could be replaced by an equivalent design in carbon fibre reinforced plastic (CFRP), where the material thickness would be approximately double. thin CFRP structures were built e.g. for the CMS pixel detector upgrade [125].
Another material option would be the use of a low density foam-like material such as Rohacell, as used in the SINDRUM experiment [126].
9.3.2 Active target

We have also considered the use of our Kapton-sensor assemblies (see chapter 10) as an active target. This would lead to a vertex separation ability in the order of the pixel size (), as opposed to the expected from track extrapolation. At an appropriate inclination angle, a wedge of two chips with active area and thickness presents a comparable amount of material to the beam (however, the cabling and cooling required would add significant additional material at least in the downstream direction). Such an arrangement would sacrifice -symmetry.
The hit rate expected in an active target exceeds for high intensity running, corresponding to about per pixel, or per reticle, far beyond the expected in the innermost sensor layer. This in turn would necessitate the development of a completely new read-out block for the sensor chips. The gain in selectivity when going from vertex resolution to does not justify the cost and technical risks associated with the active target.
Chapter 10 The Mu3e Pixel Detector
The Mu3e pixel tracker is to be built from High-Voltage Monolithic Active Pixel Sensors (HV-MAPS) thinned to . Signal and power lines are aluminum traces on a Kapton flex-print, which, together with a Kapton prism, also serves as a support structure. The detector should be cooled with gaseous helium.
10.1 HV-Maps Sensor
We propose to use Monolithic Active Pixel Sensors (MAPS) as tracking detectors as they integrate sensor and readout functionalities in the same device and thus greatly reduce the material budget. Classical concepts like hybrid designs have usually a higher material budget due to additional interconnects (bonds) and extra readout chips, which compromise the track reconstruction performance especially at low track momentum.
In the first MAPS designs ionization charges were collected mainly by diffusion with a timing constant of several hundreds of nanoseconds. MAPS designs with high bias voltages exceeding , however overcome this problem by collecting charges via drift and provide timing resolutions of better than .
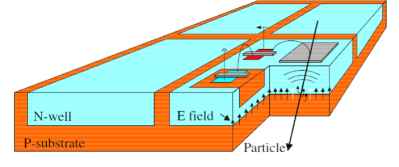
We propose to use the High Voltage MAPS design with the amplifier electronics completely implemented inside the deep pixel N-well, which was first proposed in [127] and since successfully tested [128, 129], see also section 10.4.
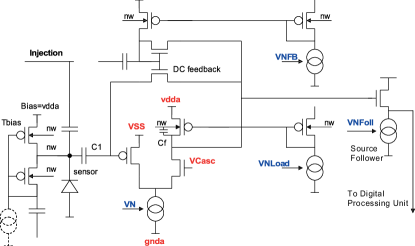
Figure 10.1 shows a sketch of a Monolithic Pixel Detector. The readout circuitry allows an efficient zero suppression of pixel information and the implementation of timestamps to facilitate the assignments of hits between different pixel layers.
For readout designs providing timing resolutions power consumptions of about are expected [130].
Because of the small size of the active depletion zone, the detectors can be thinned down to or less. By thinning, the material budget can be significantly reduced and becomes, averaged over the tracking volume comparable to ordinary gaseous detectors.
A further advantage is that HV-MAPS can be implemented in a “cheap” commercial process. We use the AMS/IBM HV-CMOS process [131], which was developed mainly for the automotive industry, and thus offers long-term availability as well as being specified for a very wide range of operating conditions. The process offers a maximum reticle size of . One of the few disadvantages of the process is the fact that the first metalization layer is in copper, thus introducing a small amount of medium material. There are however plans for replacing also that layer with an aluminium metalization in a future version of the process.
Radiation-tolerance studies of the HV-MAPS sensors in technology are ongoing also on other projects (e.g. ATLAS pixel R&D). Several test chips with similar pixel electronics as MUPIX have been irradiated at PS (CERN) up to doses between 80 and (the latest corresponds to a fluence of nearly ). The results are promising. Despite of the use of standard NMOS layouts, the chip irradiated to 80 MRad still detects the particles radiated by a 90Sr source. The setup irradiated to is strongly activated, and no accurate detection of 90Sr signals is possible. The chip was able to detect particles from the beam up to dose. The main radiation effect is that the electronics suffers from ionizing effects such that it is difficult to find a proper operation point for the pixel amplifier. As the Mu3e experiment is performed at a muon beam-line the requirements on radiation hardness are not comparable to those at hadron colliders like the LHC. The radiation tests of the HV-MAPS sensors done so far all indicated that there will be no radiation damage even at highest muon rates at phase II.
10.2 Sensor specification
| Small Sensor | Large Sensor | |
| Pixel Size [] | ||
| Sensor Size [] | ||
| Assembly | ||
| Assembly size [] | ||
| Max. LVDS links | 4 | 2 |
| Bandwidth [] | 3.2 | 1.6 |
We plan to use two types of sensors in the Mu3e experiment, a smaller one for the inner layers and a larger one for the outer layers, see Table 10.1. The pixel size is , much smaller than the multiple scattering contribution.
The wafers are to be thinned to . If the yields permit it, we will cut strips of three subsequent sensors from the wafers and mount them in one piece.
The sensor output is zero suppressed and consist of time-stamps and addresses of hit pixels, serialized on a low voltage digital signaling (LVDS) link. The sensor is configured via a JTAG interface [132]. Including supply voltages, we expect about 30 pads (and thus bond wires) to connect the chip to the Kapton flex-print.
10.3 Path towards the Full Sensor
10.3.1 The MUPIX Prototypes
First purpose-built sensor prototypes (the MUPIX series of chips) became available in 2011.
MUPIX1 and 2
The MUPIX 1 and 2 are small demonstration prototypes with a matrix of pixels of size for an active area of approximately , see Figures 10.2 and 10.4. Each pixel consists of the sensor diode, a charge-sensitive amplifier and a source follower to drive the signal to the chip periphery. In addition there is a capacity allowing to inject test charges. On the periphery, a comparator turns the analog signal into a digital time-over-threshold (ToT) signal. The threshold of the comparators is set globally for the chip and adjusted pixel-per-pixel with a 4-bit tune digital to analog converter (DAC). See Figure 10.3 for an overview of the pixel electronics. In the test chips, the comparator output of an individual pixel can be observed via a dedicated output line. Alternatively, the whole chip can be read out via a shift register, where all the available information is whether a particular pixel saw a signal during an active gate.
The MUPIX 1 chip had an issue with feedback in the comparator that occasionally led to double pulses. This issue has been fixed in MUPIX 2, which in addition contains temperature sensors.

MUPIX3
In August 2012, we submitted the MUPIX 3 chip, a major step towards the final sensor. The new chip has pixels of size for an active area of approximately , see Figure 10.5. It implements the full digital column logic, allowing for address generation and serial readout of zero-suppressed data. In addition, MUPIX3 has faster signal shaping.
The main differences with the final sensor are the lack of a high-speed LVDS output, buffers in the columns and the chip-wide hit collection logic. For this prototype, the corresponding logic will be emulated off-chip in an FPGA. Also several control voltages which should be generated on-chip in the final version are currently produced on a test printed circuit board (PCB) in order to allow for easier debugging.
We have just received the first MUPIX 3 samples. First test results will become available early 2013.
10.3.2 Plans for 2013
As soon as the first results from the MUPIX 3 sensor are available, we will prepare another multi-project-wafer (MPW) run, implementing the remaining digital logic and addressing potential issues discovered with MUPIX 3. This should clear the path for an engineering run in the second half of 2013, opening up the possibility to build a full scale tracker prototype.
10.4 Characterization of the Prototypes
We have studied the properties of the MUPIX 1 and 2 prototypes using injection pulses, LEDs, laser diodes, X-rays, radioactive sources and test beam measurements. In the following, we will outline the core results; details of the findings can be found in a master [133] and a bachelor thesis [134].
The test setup was based on a test board housing the chip itself and a logic interface card. The chip test board has voltage regulators for the supply voltages, digital to analog converters for the threshold and injection pulse height and a flat ribbon connector to the logic interface card. This interface card uses a FPGA both to program and readout the MUPIX chip and to communicate with a PC via USB. These two boards together with a C++ control software have been used for all tests described here.
10.4.1 Signal to Noise Ratio
Injection pulses can simulate the charge deposition of ionizing particles. A scan of the injection pulse height at constant threshold would deliver a step function if no noise were present. Due to the additional noise on top of the injection pulse the step function is transformed to an error function with a finite slope. In turn the width of the step function can be used to determine the noise as a function of the applied threshold. A 55Fe source has been used as reference signal for the determination of the signal to noise ratio (SNR). The injection pulse height corresponding to the 55Fe signal is found by matching the time over threshold of both signals at a given threshold. For the MUPIX 2 chip the signal to noise ratio as a function of threshold ranges between 21.5 and 35.7, see Figure 10.6. Any signal to noise ratio >9 is considered good.
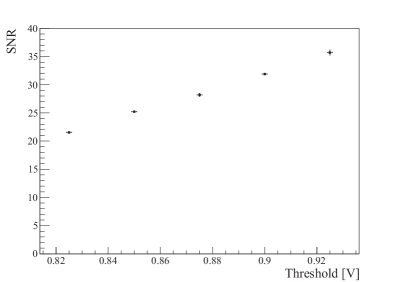
10.4.2 Pixel to Pixel Uniformity
Using a similar method as for the measurement of the signal to noise ratio, the pixel to pixel uniformity can be determined and optimized. At a constant injection pulse height a scan of the threshold setting for the entire pixel matrix is carried out. For each pixel the error function fit is performed and the value of the error function rising edge plotted, see Figure 10.7a). As can be seen in Figure 10.7c) the distribution of the threshold values for the pixels of the same chip is quite broad. In order to compensate for these inequalities, a threshold offset, the so called tune DAC (TDAC) value can be set for each pixel. The best TDAC values for the pixels are found by running an automated procedure, see [133]. Figure 10.7b) and d) show that the threshold spread (reflecting the response uniformity) after tuning the threshold offsets has decreased by almost an order of magnitude from to RMS.
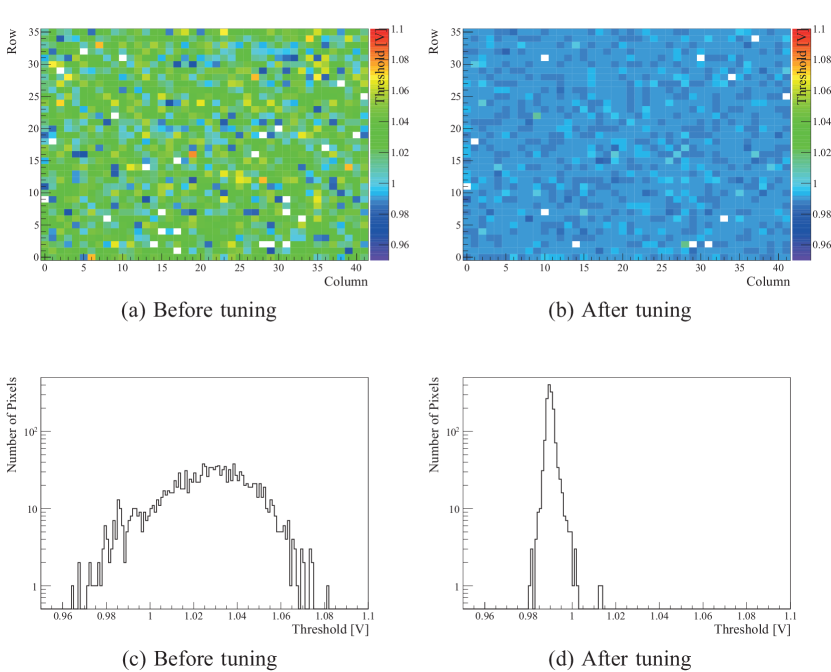
10.4.3 Pixel Response Time
The timing characteristics of the MUPIX chip is very important because of the requirement to run at high muon decay rates. A fast response of the MUPIX chip leads to precise timing of hits and helps suppressing combinatorial background. In the inner detector layers the double pulse resolution should be good as the hit rate is up to for each pixel.
Timing studies have been carried out using a LED driven by a pulse generator to stimulate the sensor. The discriminator output of a single pixel is then compared to the second output of the pulse generator on an oscilloscope. In this configuration it is possible to measure the latency between generator and pixel output and the time over threshold (ToT) of the pixel. By plotting latency and ToT for many threshold values one obtains the pulse shape, see Figure 10.8. The measured pulse shape reflects the RC-CR shaping characteristic of the pixel electronics. The charge collection process in the depletion zone is much faster and has little influence on the measured timing.
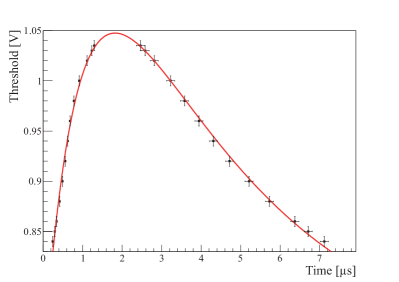
By generating double pulses and dividing the number of unresolved pulses at the pixel output by the number of all pulses, the double pulse resolution can be determined. Figure 10.9 shows this ratio as a function of pulse to pulse delay. An error function has been fitted and the point of un-resolved pulses gives a double pulse resolution of consistent with the expectation from the chosen shaper characteristics.

10.4.4 Measurements with Radioactive Sources
Radioactive sources allow to test the MUPIX chips with real particles. For a 55Fe source the time over threshold (ToT) distribution, which is an measure for the energy distribution, is shown in Figure 10.10. X-ray fluorescence in the range of 4 to has been used to derive a relative energy resolution of 10 to .
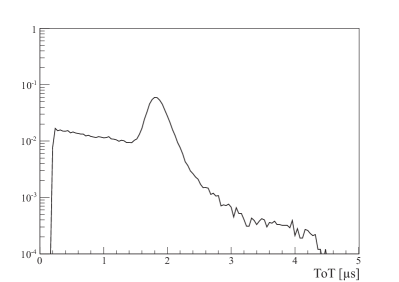
The 55Fe peak in the ToT spectrum has been used to study the influence high voltage (HV) and temperature on the pixel signal. Figure 10.11 shows the 55Fe peak as a function of the HV, revealing first a steep rise as the depletion zone grows. Between 20 and , the ToT stays almost constant. At even higher voltages the electric field in the depletion zone becomes strong enough for the creation of secondary electron-hole pairs, which results in a signal amplification. The temperature dependence of the pixel sensor is important, because in the later experiment the different parts of the detector will operate at different temperatures varying by -. In Figure 10.12 the 55Fe peak of the ToT spectrum is plotted as a function of temperature between 20 to . As can be seen the ToT goes down from 1.6 to below , with a slope of /. Measurements with test pulse injection and simulation studies confirm that the observed temperature dependence is a feature of the charge sensitive amplifier of the pixel analog stage.
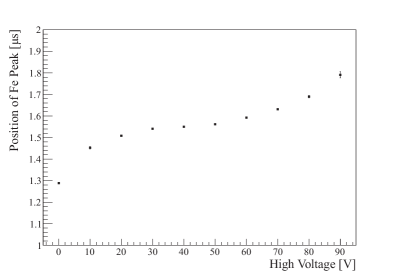
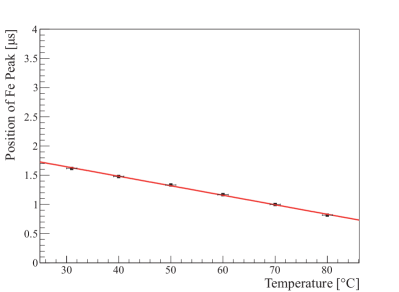

10.4.5 Testbeam results
In August 2012 the MUPIX2 chip was tested at the CERN SPS. The beam from the SPS was a pion beam, chosen for little multiple scattering effects due to the device under test (DUT). In two separate data taking periods the MUPIX2 was mounted inside the TimePix telescope [135]. This silicon pixel telescope has four layers before and four layers after the DUT, providing very precise pointing resolution of . The MUPIX2 chip was tested facing the beam and under an angle of . For both beam periods a threshold scan was performed in order to derive the efficiency as a function of threshold, but no threshold calibration to equalize the gain of the pixels was performed. Figure 10.13 shows the resolution in and direction of the MUPIX2 chip facing the beam and tested at three different threshold values. The measured resolution of in and in corresponds to the expected resolution given the telescope resolution and the pixel size. Further results are still subject to studies and will follow soon.
10.5 Mechanics
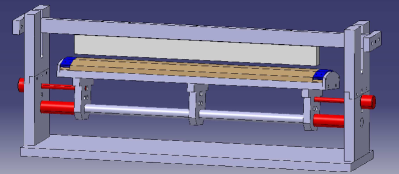

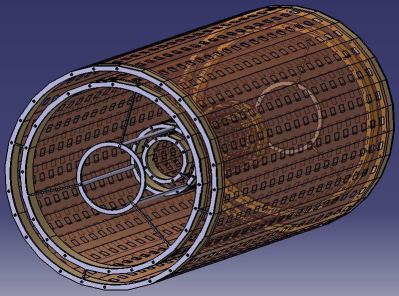

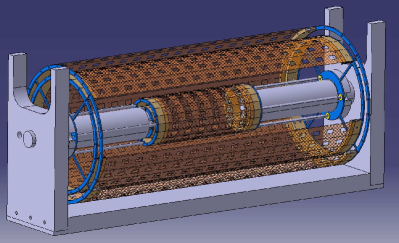
The pixel detector mechanics has been optimized for very low material budget in the active detector region. Additional requirements are mechanical stability, resistance to temperatures over a wide range and a modular design for ease of assembly and repair. It is proposed to build the frame for the silicon pixel detector from thin Kapton foil. The sensors are glued and bonded on a flex-print and then mounted onto the Kapton frame.
The Kapton foil used for the mechanical frame construction is thin. It gains in mechanical stability as it is folded around a prism-shaped template and glued to plastic end-pieces. For this process tools have been built, which support the detector modules until they are ready for full station assembly, see Figures 10.14 and 10.15. In a separate tool the thin pixel chips are glued on the single layer Kapton flex-print. Alignement groves secure the correct position of the chips. In the next step the chips are wire bonded to the flex print. With a vacuum lift tool the flex-prints are then positioned and glued to the mechanical frames. The radiation length of a pixel detector layer is summarized in Table 10.2.
The pixel detector is build from layers of four different sizes and prism shapes, see Figure 10.16. As the digital readout circuits of the pixel chips create an approximately wide dead area, there is a overlap to the adjacent sensor. The inner double layers have active length. Layer 1 has 12 and layer 2 18 sides of width. Each inner layer is assembled from two half-modules. As a consequence the plastic end-pieces are half moon shaped. When all four half modules of the inner detector layers are produced and tested they are mounted to two thin rim wheels. A mechanical prototype for the inner double layer has been constructed from Kapton foil both for the frame and the flex-print layer, while the pixel chips have been simulated with thick glass plates. Glass of thickness is of comparable flexibility as thinned silicon, which is shown in Figure 10.19. The resulting mechanical unit is surprisingly sturdy and fully self supporting, as can be seen in Figure 10.20. Layer 3 and layer 4 have a three times larger active length of . The sides of these outer layers are wide. The layers 3 and 4 have 24 and 28 sides. An outer double layer module combines four sides, so layer 3 consists of 6 and layer 4 consists of 7 modules, see Figure 10.17. The station assembly is done in a special mounting frame, combining the inner two layers with the modules of the outer two layers on large rim wheels (Figure 10.18). Re-curl stations will be assembled accordingly.
| Component | thickness | X/X0 |
| [] | [] | |
| Kapton frame | 25 | 0.018 |
| Kapton flex-print | 25 | 0.018 |
| Aluminum traces | 15/2 | 0.008 |
| ( coverage) | ||
| HV-MAPS | 50 | 0.053 |
| Adhesive | 10 | 0.003 |
| Full detector layer | 125 | 0.100 |
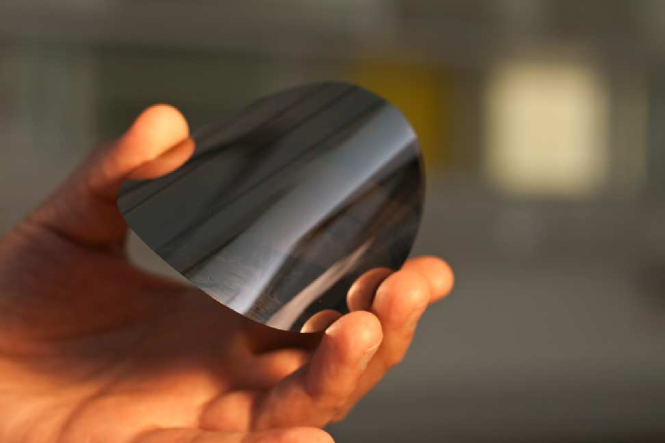
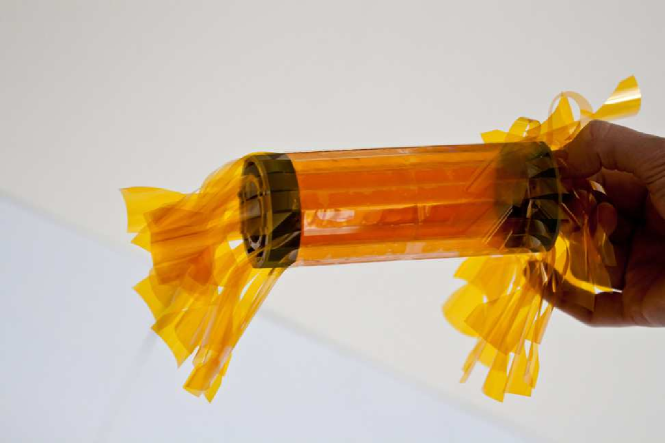
10.6 Cooling
The cooling system for the pixel detector must be capable of keeping the temperatures at a reasonable level () and should at the same time add very little extra material to the active volume of the detector. Cooling with gaseous helium has been chosen as it appears to offer a reasonable compromise between cooling potential and radiation length.
Given its size, the heat load introduced by the pixel detector is considerable. Table 10.3 details the contributions of the different parts of the pixel detector assuming a realistic heat load of . It is worth mentioning that the heat load is strongly dependent on the clock speed at which the pixel chips are running. Pixel chips with very low occupancy, for example those installed in the recurl stations, could optionally be operated at half the clock speed which would largely reduce the total thermal power of the pixel detector.
In order to keep the temperature of the coolant equally low in all parts of the detector, it is foreseen to place nozzles between the support structures pointing at different parts of the sensor layers.
In order to study the potential of gaseous helium cooling a bachelor thesis has been carried out [136]. In this thesis a thin sandwich of aluminum foil, Kapton and silicon was heated inductively and cooled with a helium flow. For the long sample heated with a flow of was necessary to maintain a temperature difference between helium and sensor of . Further studies using a full scale central detector prototype in a wind tunnel are on the way. This full scale prototype will be assembled from aluminized Kapton foil such that Ohmic heating can be applied. It is planned to run the upcoming tests with the helium heat exchanger acquired for phase I of the experiment.
| Detector Part | size [] | power [] |
|---|---|---|
| layer 1 | 158.4 | 23 |
| layer 2 | 237.6 | 35 |
| vertex layers (1+2) | 396 | 59 |
| layer 3 | 1728 | 259 |
| layer 4 | 2016 | 302 |
| outer layers (3+4) | 3744 | 561 |
| central detector (1-4) | 4140 | 621 |
| detector with | ||
| 2 recurl stations | 11628 | 1744 |
| full detector | 19116 | 2867 |
10.7 Alternative Technologies
Since the Mu3e pixel detector plays the key role in the experiment, it is important to carefully compare the chosen HV-MAPS technology with alternatives. To do so one has to have the detector requirements in mind, see chapter 5. The goal of a branching ratio sensitivity of leads to a high muon decay rate on target of . In order to suppress combinatorial background a very good vertex resolution of ) is needed. The suppression of the background from the conversion decay requires very precise momentum reconstruction of better than , for the branching ratio sensitivity. The momentum resolution for the low energetic decay products of to will be governed by the multiple scattering in the detector. Only concepts with extremely low radiation length of < in total can achieve this.
In the following different technology options for the Mu3e tracking detector are compared. The result of this comparison is summarized in table 10.4.
10.7.1 Time-Projection Chamber
Time projection chambers are a very attractive concept for tracking detectors with good spacial resolution and very low radiation length. The example of the ALICE TPC [137] has demonstrated that very high track densities can be handled with such a detector. Over the last two decades many studies for TPCs with very low radiation length, i.e. for a proposed chamber at SLAC [138], have been carried out. The drift time of an electron in a possible TPC for the Mu3e experiment with total length would be in the order of , using the proposed gas mixture of Helium:CO2:Isobutane (83:10:7). This time of at decay rate means that the DAQ and event filter farm would have to handle frames containing > muon decays, which is not realistic. Another problem would be strong space charge effects due to continuous very high track density, see [139]. These two aspects rule out the usage of a TPC in the phase IB and phase II of Mu3e, while it would be possible to use a TPC in phase IA.
10.7.2 Other Pixel Technologies
| Mu3e | STAR | BELLE | LHCb | |||
|---|---|---|---|---|---|---|
| Parameter | required | HV-MAPS | He TPC | MIMOSA28 | DEPFET | VeloPix |
| sensor thickness X/X0 [%] | 0.1 | - | ||||
| readout cycle [] | ||||||
| power [] | - |
The usage of pixel detectors in particle and heavy-ion physics has recently lead to a variety of thin detectors capable of dealing with high particle fluxes. It is worth to discuss the solutions developed for the upgrades of the STAR, BELLE and LHCb vertex detectors.
The STAR upgrade vertex detector [140] is based on Monolithic Active Pixel Sensors (MAPS), more precisely the MIMOSA 28 sensor [141]. The vertex detector under construction is located around the interaction point at r=, and has an intrinsic hit resolution of <. An ultralight carbon fibre support structure has been developed with a thickness of . The radiation length is X/X0= per layer in the active region. The power dissipation is about and forced air cooling at is used [142]. The charge collection for the MIMOSA chips is based on electron diffusion, resulting in charge collection times of . This has to be compared to the charge collection times of drift based silicon detectors like silicon strip and hybrid silicon pixel detectors of a few . The signal integration of the MIMOSA 28 chip is . This long integration time corresponding to > decay events rules out the usage of the MAPS developed for STAR vertex upgrade in Mu3e,
Belle2 is building a lightweight silicon vertex tracker based on DEPFET pixel sensors [43]. The Belle2 silicon vertex detector has two layers at r=, . The monolithic sensors are only thick and self supporting, resulting in a radiation length of X/X0= per layer [143]. The cooling system uses liquid CO2 for the readout electronics and cold dry air with forced convection for the sensors. The sensor chip is equipped with an integrated read out amplification, the charge is then accumulated internally. The readout is enabled externally and done in a row wise rolling shutter mode. The readout time for the entire chip is . As for the MIMOSA 28 sensor the relatively long readout time makes the Belle2 DEPFET sensor unsuitable for the Mu3e detector. On top of this the Belle2 DEPFET sensor produces analog output signals and requires further electronics for analog to digital conversion, baseline subtraction, discrimination and zero-suppression.
The proposed pixel detector for the LHCb vertex upgrade belongs to the TIMEPIX family of chips. The main goal of the LHCb upgrade is to move from a readout to a readout in order to make a track based L0-trigger possible. The power consumption per chip is [144], which is quite high. The sensor thickness is to . The LHCb Velo upgrade pixel sensor is a hybrid design, so in addition to the sensor there is also the readout chip thickness, the solder bump bonds, aluminum traces and cooling elements summing up to X/X0= per layer. In LHCb the vertex detector is inside a vacuum tank around the interaction point, so the cooling scheme relies on a high thermally conductive spine (diamond) in combination with a liquid CO2 cooling outside the active area. Alternative cooling studies look at micro-channel cooling which would extend the CO2 cooling to the pixel chips in the active area. The pixel sensor is designed to have less than time-walk at 1000 electrons. The output bandwidth is > with on-chip zero suppression. The readout is hit driven and asynchronous. While the readout speed would be ideal for the Mu3e detector, the radiation length per layer of X/X0= is too high.
10.7.3 Conclusion
In the field of tracking detectors with good resolution, low radiation length and high rate capabilities there has been a very strong progress in the recent years, see Table 10.4. Time projection chambers with helium gas mixtures would provide excellent momentum resolution. Because of the very long drift times in a large TPC and the constantly high muon decay rates, it is not possible to do online track reconstruction in the event filter farm for decay rates exceeding , which corresponds to phase IA of the Mu3e running. As a change of technology between phases IA and IB is not desirable, the TPC option can only be considered as a back-up solution.
The above discussed pixel alternatives can be grouped in two categories. The systems based on the MIMOSA chip for the STAR upgrade and the DEPFET chip for Belle 2 have little radiation length of X/X0= and per layer, but have long readout cycles. On the other hand the VeloPix based tracker for the LHCb upgrade can be read out at , but has a relatively large radiation length of X/X0= per layer. In all three cases further RD would be required to transform the existing designs into one fulfilling the requirements of all phases of the Mu3e experiment.
Chapter 11 The Mu3e Fibre Detector
11.1 The time of flight detector
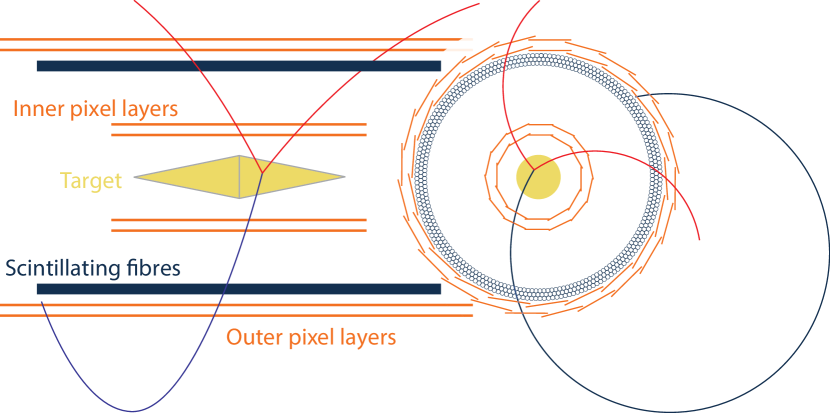
A cylindrical time of flight (ToF) detector complements the central silicon tracking system. It consists of a scintillating fibre (Sci-Fi) hodoscope with a radius of and a length of . The expected time resolution is of several and a detection efficiency close to . The main purpose of the ToF system is to measure very precisely the arrival time of particles in order to allow for the matching with hits detected in the silicon detectors. This will help to reject pile-up events (accidental backgrounds) and allow for a charge (direction of propagation) measurement for recurling tracks. The ToF system will operate at very high particle rates up to several per channel.
A detailed R&D program is ongoing to prove the feasibility of the Sci-Fi detector and to help optimizing the design of the Sci-Fi detector. The R&D activity covers all the aspects of the ToF detector development: scintillating fibres, SiPMs, amplifiers, and readout electronics. The challenging aspects of the ToF system are (i) the high rates per Sci-Fi readout channel and (ii) the large data flow generated by the readout digitizing electronics, which has to be handled in real time. Time resolutions of about have been already achieved with Sci-Fi hodoscopes with single-ended readout using multi-anode PMTs [145]. We aim at a similar time resolution.
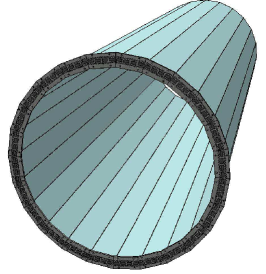
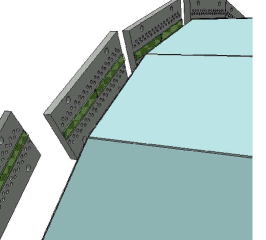
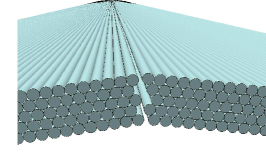
In the current design, the scintillating fibre detector is composed of 24 Sci-Fi ribbons, each long and wide, as illustrated in Figure 11.2. The ribbons will be supported by a carbon fibre mechanical structure. The use of diameter multi-cladding scintillating fibres produced by Kuraray is envisaged. Three to five Sci-Fi layers (Figure 11.2 right) are staggered such as to minimize empty spaces between fibres. Figure 11.3 shows a Sci-Fi ribbon and its cross section. In the figure the uniform staggering of the Sci-Fi layers can be seen. The overall thickness of the Sci-Fi arrays varies depending on the number of layers between . This thickness has to be kept as low as possible, to reduce the multiple scattering to a minimum compatible with the required performance (i.e. time resolution and efficiency). The empty space between adjacent ribbons will be minimized in order to guarantee continuous coverage.
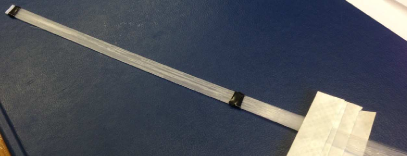
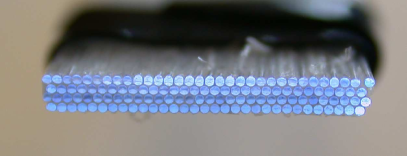
The scintillating light produced in the fibres will be detected with SiPM arrays at both fibre ends. The choice of SiPMs as a photo-detection device is based on the fact that they are very compact objects that can be operated in high magnetic fields with high gain () and at high counting rates.
Two different readout schemes for the fibres are being considered and investigated: 1) fibres are grouped in vertical columns (this is implemented by the structure of the readout photo-device), 2) each fibre is read out individually. In the first design we envisage to use the 32 channel SiPM arrays with pixels available from Hamamatsu [146, 147]. The active size of the sensor is with a total surface of . The pixels are arranged in columns, corresponding to an effective pitch of . Two such SiPM sensors will be assembled side by side with almost no dead region, giving a wide photo-sensitive region with 64 readout channels, and matching precisely the width of the Sci-Fi ribbons. The photo-detectors will be directly coupled to the Sci-Fi arrays to maximize the light collection efficiency, and consequently the timing performance. In total 96 SiPM arrays with 32 channels each will be required to readout the Sci-Fi tracker at each end, for a total of () readout channels.
A detailed understanding of the expected occupancies in the the Sci-Fi detector is required. The rates depend also on the background in the detector generated by secondary interactions in the materials of the different components. A particle crossing the Sci-Fi ribbons at , will excite one or two adjacent Sci-Fi columns, as sketched in Figure 11.4. A particle crossing the same Sci-Fi ribbon, for example at , will excite 4 to 5 adjacent Sci-Fi columns for a 5 layer ribbon and 2 to 3 for a 3 layer ribbon, thus increasing significantly the overall occupancy of the detector. At an expected rate of muon decays per second using Sci-Fi channels, the estimated rate in the Sci-Fi system is on average. At the same time the signal will be spread out over several SiPM channels. A well designed clustering algorithm will be required to reconstruct the timing and position of the crossing particle.
The lowest possible detector readout occupancy can be achieved by reading out each fibre individually. In absence of dark current noise and background, the occupancy is given by the rate of detected electrons from muon decays and is expected to be per fibre. When reading out each multi-cladding fibre individually, one has to take into account that the scintillating light travels preferentially in the cladding of the fibre and exits the fibre in a cone with an aperture of about . In order to collect all the scintillating light exiting the fibre, and thus ensure high detection efficiency, the photo-detector has to be wider then the fibre diameter, at least around the fibre. This compensates also the misalignment, of the order of few tens of microns, between the fibres and the SiPMs. In order to avoid the light from one fibre to spill over to a neighboring photo-detector channel (optical cross-talk) the fibres and photo-detectors have to be separated by center-to-center. To summarize, the estimated, optimal size of the photo-detector for reading out each fibre individually is (for a square device), and a center-to-center separation of .
A transition region between the highly compact Sci-Fi ribbons and the photo-detectors of about will be required to fan-out the Sci-Fis to the desired center-to-center separation of before coupling the fibres to the SiPMs. To assure the precise alignment, the fibres will be glued in sockets with a precision of . The SiPMs will be coupled to the Sci-Fis using the same sockets. Reading out each fibre individually will require a total of about readout channels.
In case the SiPMs could not be coupled directly to the Sci-Fis (because of mechanical constraints inside the limited space), optical fibres coupled to the Sci-Fis will be used to transmit the scintillating light outside of the solenoid, where they will be coupled to the same type of SiPM arrays, however with some loss of light. In this case the use of multi-anode PMTs or multi-channel plate PMTs could be also envisaged as alternative photo-detector device to the SiPMs for the readout of the Sci-Fi ribbons.
Different manufacturers are also being investigated. The reported photo-detection efficiency of the Hamamatsu SiPMs is not that high (PDE ). Since the time resolution depends on the number of detected scintillating photons () in order to obtain the best timing performances we need to maximize the PDE of the SiPM arrays. Discussions with Hamamatsu to explore various possibilities to increase the PDE are ongoing. We will also discuss with other companies capable of producing such devices (we already contacted FBK in Italy and Ketek in Germany). Very likely it will be required to design SiPM sensors matching precisely the requirements of the Sci-Fi detector rather than using commercially available SiPMs.
Performance studies of Sci-Fi ribbons coupled to SiPM arrays will be carried out in test beams at PSI. The test beam activities will include the study of the time resolution, rate capabilities, detection efficiency, tracking resolution, and uniformity of the detector. Different readout electronics will be also tested.
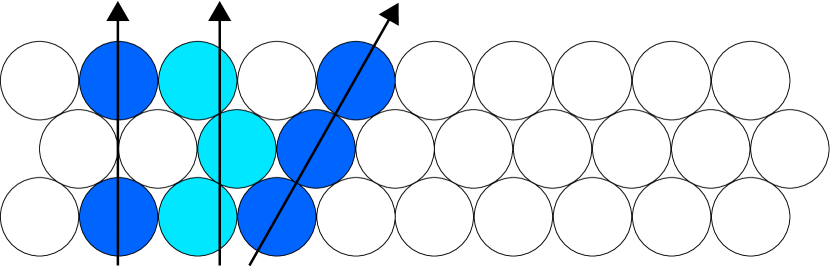
11.2 Readout of photon detectors
For the readout of the SiPMs different options are being investigated. Details are given in chapter 13.
One possibility is to use the well-established waveform digitizing technology based on the DRS switched capacitor array chip developed at PSI. The advantage of this technology compared to traditional constant fraction discriminators and TDCs is that pile-up can be effectively recognized and corrected for. Due to the bulkiness of this readout electronics, the digitizing electronics cannot be located in the proximity of the Sci-Fi detector. To transmit the electrical pulses from the SiPMs to the digitizing electronics two options are being considered. In a first version the signals are transmitted without amplification on shielded low attenuation coaxial cables. Given the low amplitude of the pulses ( per photo-electron) and potentially high noise from the digital readout electronics, the amplification of SiPM signals might be required. In this second version the pulses are first amplified about a factor of ten and then transmitted. Hybrid amplifier circuits will be installed on the other side of the SiPM mountings. We already developed fast amplifiers using transistors (rise time , decay time ) matching the input characteristics of SiPMs for optimal time performance and high rates.
A second possibility is to use the STiC chip, which includes a fast discriminator and a TDC digitizing the time information. The advantage of this solution is the compactness of the chip that could be installed very close to the SiPMs, with no need to amplify and to transmit analog signals outside of the solenoid. A third option could be offered by time to digital converters implemented in FPGAs.
11.3 GEANT simulations
To optimize the overall design of the detector and of the Sci-Fi sub-system in particular, extensive simulation studies are being carried out. We are exploring the propagation of scintillating light in the fibres in a dedicated simulation that allows to compare the optical properties for any possible fibre and ribbon geometry. Meanwhile a complete set of simulation tools is available which allows a profound analysis of the different possible layouts of the Sci-Fi system.
Ongoing simulation studies will help us to optimize and work out the details of the final Sci-Fi ToF design. Given that a crucial requirement of the experiment is to minimize all involved materials also a layer of reflecting paint or glue will add additional non active material to the detector and thus increase the overall material budget seen by the particles crossing the Sci-Fi ribbons, resulting in a deterioration of the overall momentum resolution of the tracking system. This and similar effects can now be studied easily with the available tools.
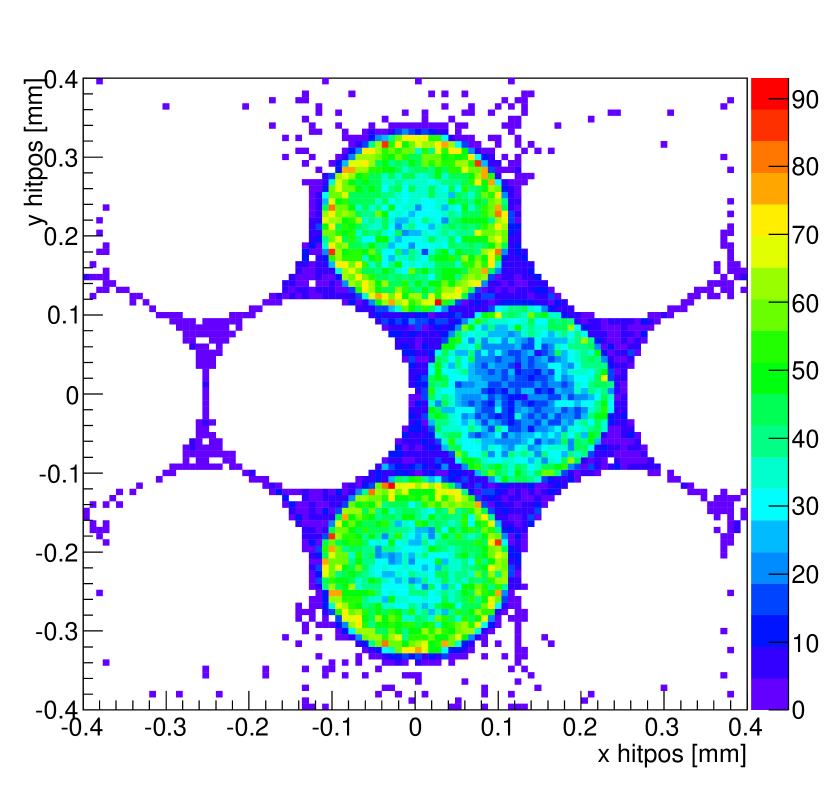

In combination with a simulation of the SiPM response [148], we are now able to estimate whether the aimed time resolution of a few hundred picoseconds is feasible with the fibre geometry and the SiPMs under investigation. First studies show that the resolution can be achieved with the baseline design (Figure 11.5). Further fibre geometries and readout combinations are currently being evaluated. In addition to the simulation test setups are being developed consisting of a complete ribbon with the SiPM detectors mounted on both ends to verify the simulation results and to get the prove whether the desired geometry can be constructed with reasonable effort. Furthermore the test stand will be used to evaluate readout electronics.
An additional source of concern is the cross talk and after pulsing observed in most APDs operated in Geiger mode. Both effects will lead to an increase of the occupancy of our electronics channels and thus have to be minimized. Since the Sci-Fi ribbons are read-out on both ends, this uncorrelated source of noise, in principle, can be rejected.
Chapter 12 The Mu3e Tile Detector
The second component of the Time-of-Flight hodoscope is a detector consisting of scintillating tiles which are, as in the case of the Sci-Fi tracker, read out by SiPMs. The tile detector is located in the recurl station on the inside of the recurl pixel layer (see Figure 6.5). The detector aims at a time resolution of below and an efficiency close to in order to effectively identify a coincident signal from three electrons and suppress combinatoric background. The main challenge of the detector design is to achieve these requirements under the high hit rate which is expected, especially in phase II.
12.1 Detector Design
The detector is divided into four modules (one for each recurl station) with a length of and diameter of . Each module is segmented into small tiles with a size of , which are individually wrapped in reflective foil in order to increase the light yield.
In the current design, each module consists of 48 rings with a thickness of , and each ring consists of 48 tiles (see Figure 12.1). This results in a total number of 2304 tiles per station, and a tile geometry of roughly . For the outer two recurl stations, the number of tiles might be decreased to due to the lower hit rate (see Figure 12.2), in order to reduce the costs. This detector geometry is the result of extensive simulation studies which will be continued in order to further optimize the detector performance.
The tiles are made of plastic scintillator material which provides a fast light response. The main requirements for the scintillator are a high light yield, fast rise and decay time and a scintillation spectrum which approximately matches the spectral sensitivity of the SiPM. Different scintillators have been compared using a Geant4 simulation in combination with a simulation of the SiPM response. The best suited scintillator was found to be BC420 from Bicron. However, the differences between the individual scintillating materials were found to be small, and thus also more inexpensive alternatives are feasible.

The scintillation light of each tile is read out by a SiPM which is directly attached on the inside of the tile. SiPMs are well suited for this application due to the compact size, insensitivity to magnetic fields, high photon detection efficiency (PDE) and excellent timing properties. The most important SiPM characteristics for this application are a high PDE and gain in order to obtain a large signal and therefore a good time resolution. Furthermore, a small signal decay time is desired in order to reduce signal pile up and thus increasing the signal efficiency. The S10362-33-050 MPPC from Hamamatsu with an active area of and 3600 pixels is a suitable sensor for this application. A possible alternative sensor is the PM3350 from Ketek which offers a larger PDE and gain compared to the Hamamatsu device, but has a longer decay time. A further option is the SensL MicroFB series, which will be available in the first quarter of 2013. These sensors are a very promising alternative, as the devices will have an additional fast output providing signals with a width of and provide a high PDE and gain. Measurements and simulation studies comparing the different sensor types will be continued, in order to find the devices which is best suited for this application.
For the readout of the SiPMs, two different options are currently discussed. One solution is to digitize the SiPM waveforms using the DRS chip. The waveforms then have to be further processed externally, in order to determine the time-stamps. The second option is the STiC chip which includes a fast discriminator and a TDC digitizing the time information. Details on both chips can be found in chapter 13.
12.2 Simulation
Simulation studies using the full detector simulation described in section 15 have been carried out in order to determine the detector performance. The optical properties of a tile are parameterized using a separate Geant4 simulation of a single tile. The SiPM simulation GosSiP [148] was used to generate the signal waveforms from the hit information of the full detector simulation. The simulation has been done for a detector design with thick tiles per recurl station with BC420 scintillator and S10362-33-050 MPPCs.
Figure 12.2 shows the hit rate per tile as a function of the position along the beam direction for phase II, including also tracks which pass several tiles, as well as background events e.g. from the collimators. These rates can be handled by the proposed readout electronics (see section 13). In order to further reduce the hit rate, and therefore the signal pileup, optimizations like adjusting the tile angle to match the mean incident angle of the tracks are currently studied.
The time-stamps for the individual hits are assigned using the signal waveforms generated by the SiPM simulation. A simple fixed threshold method is used which approximates the behaviour of the STiC chip. The same method can also be applied to the output of the DRS chip.
The optimal threshold was determined to be of the mean signal amplitude ( pixels). Due to the varying signal amplitudes and the fixed threshold, the individual time-stamps have to be corrected for the timewalk effect. Figure 12.3 shows the timewalk as a function of the Time-over-Threshold.

Figure 12.4 shows the distribution of the time-stamps relative to the true hit time given by the simulation for phase II. A fit of a Gaussian function yields a time resolution of . The non-Gaussian tails of the distribution come from signal pileup.
The efficiency for assigning a time-stamp to an isolated track within of the true hit time is . Inefficiencies at the edge of a recurl station, where a track deposits too little energy in a tile to pass the threshold can be neglected.
However, the efficiency is also influenced by signal pileup. For the simple fixed threshold model used in this analysis, an overall efficiency of for phase I and for phase II is achieved. With a more sophisticated peak-finding algorithm, it should be possible to resolve pileup signals which occur within a time interval of a few nanoseconds and consequently achieve an efficiency of . Also, using a SiPM with a fast output, like the SensL MicroFB series, will significantly reduce the pileup and thus increase the efficiency.
12.3 Time Resolution Measurements
First measurements of time resolution of a single tile and a Hamamatsu S10362-33-050 MPPC have been done using an oscilloscope with a bandwidth of . The scintillator material used in this measurements is NE110. Compared to BC420, this scintillator has a lower light yield and a slightly slower rise and decay time; using a more suited scintillator will thus improve the results. The scintillation light was triggered using a pulsed UV laser111The scintillator response to the UV light is a good approximation of the response to electrons..
Figure 12.5 shows the measured time resolution as a function of the signal amplitude for a threshold of . For a typical signal amplitude of pixels, a time resolution of is achieved, which is consistent with the simulation results. Figures 12.6 and 12.7 show the dependence on the applied threshold and SiPM bias voltage.
These results show, that a time resolution well below can be achieved. It is expected, the resolution will not be degraded using the DRS or STiC readout chip, which will be verified in future measurements.
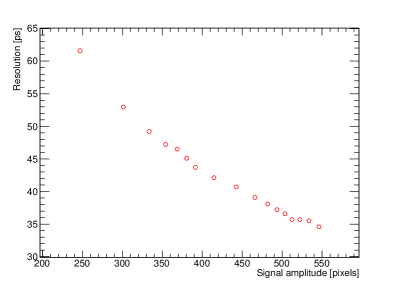

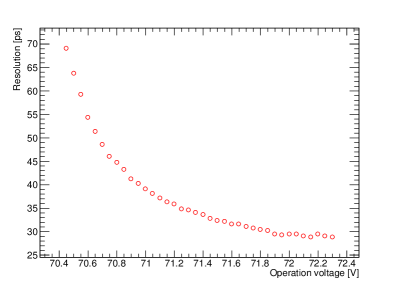
12.4 Detector Prototype
The design of a prototype of a tile detector module has been started (see Figure 12.1) and the construction is expected to be completed within 2013. In this prototype the mechanical design of the support structures and readout infrastructure will be tested and measurements of the detector performance will be carried out.
Chapter 13 Data Acquisition
13.1 Overview


The Mu3e data acquisition system works without a hardware trigger on a push basis, i.e. the detector elements continuously send hit information to the data acquisition (DAQ) system. The DAQ consists of three layers, namely front-end FPGAs, read-out boards and the filter farm. The topology of interconnects is built such that every farm PC gets to see the complete detector information for a select time slice. See Figure 13.2 for an overview of the readout scheme and Figure 13.1 for the scheme at detector start-up.
13.2 Occupancy
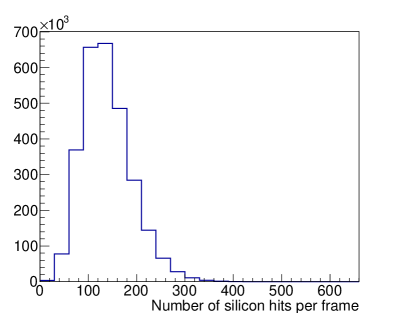
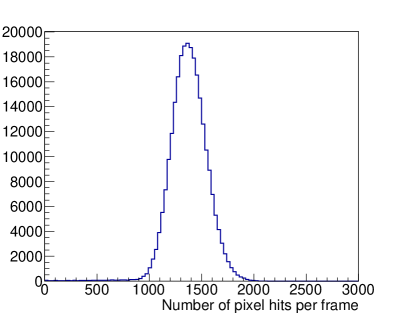
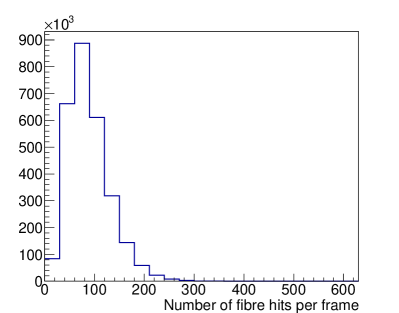
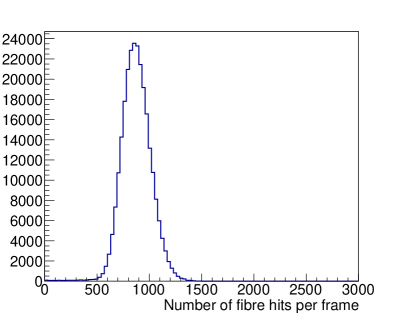

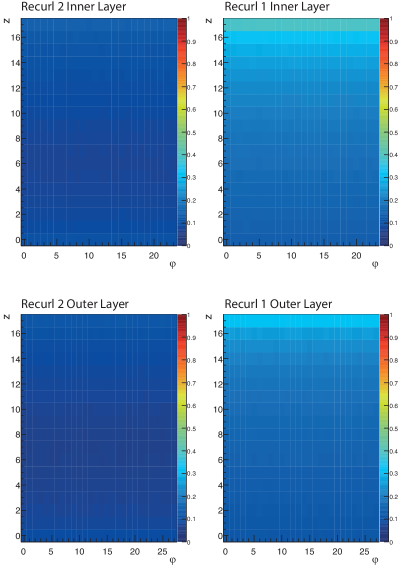
The bandwidth requirements of the data acquisition are largely determined by the expected detector occupancy, as all the Mu3e sub-detectors produce zero-suppressed output.
The occupancies shown are obtained with the full simulation running at a muon stop rate of ( for phase I) and pessimistically estimating the beam related background by loosing another () of muons along the beam line. Figures 13.3 and 13.4 show the expected number of hits per frame in the pixel detector. Figures 13.5 and 13.6 show the same for the fibre detector. The distribution of the occupancy over the pixel sensors is shown in Figures 13.7 and 13.8.
13.3 Front-end
13.3.1 Pixel detector
The pixel sensors contain electronics for hit detection and time as well as address encoding. All hits assigned to the same () time-stamp constitute a frame. The sensors collect the data of 16 frames into a superframe and send it off chip via an low-voltage differential signaling (LVDS) link. The signals travel over a maximum of on a Kapton flex-print to the edge of the sensitive area, where they are amplified by a driver chip. The Kapton prints then connects to a PCB located between the recurl layers and the beam-pipe. On this PCB, up to 72 LVDS links are fed into a FPGA. The FPGA provides buffering and collects a long stream of frames (at least 1024) into a frametrain. The assembled data are then output to 8 links, such that the data of one frame-train are sent on two links. On the PCB, the signals are converted to optical and sent off-detector via fibres. An additional pair of optical links per FPGA is required for slow control and monitoring.
| Sensor | Max | Average | ChipFPGA | ChipFPGA | Front end | FPGARO | |
|---|---|---|---|---|---|---|---|
| Chips | Hits | Hits | link capacity | total in Layer | FPGAs | capacity | |
| /Chip | /Layer | Mbit/s | Gbit/s | Gbit/s | |||
| Layer 1 | 72 | 0.35 | 18.0 | 220 | 16 | 8 | 17 |
| Layer 2 | 108 | 0.25 | 18.4 | 157 | 17 | 8 | 17 |
| Layer 3 | 432 | 0.15 | 31.0 | 94 | 40 | 12 | 29 |
| Layer 4 | 504 | 0.15 | 28.6 | 94 | 47 | 14 | 27 |
| Total | 1116 | 96 | 120 | 42 | 90 |
| Sensor | Max | Average | ChipFPGA | ChipFPGA | Front end | FPGARO | |
|---|---|---|---|---|---|---|---|
| Chips | Hits | Hits | link capacity | total in Layer | FPGAs | capacity | |
| /Chip | /Layer | Mbit/s | Gbit/s | Gbit/s | |||
| Layer 1 | 72 | 3.5 | 180 | 2203 | 155 | 8 | 166 |
| Layer 2 | 108 | 2.5 | 184 | 1574 | 166 | 8 | 170 |
| Layer 3 | 432 | 1.5 | 310 | 944 | 398 | 12 | 286 |
| Layer 4 | 504 | 1.5 | 286 | 944 | 465 | 14 | 264 |
| Recurl backward 1 inner | 432 | 0.5 | | | 315 | 133 | 6 | | |
| Recurl backward 1 outer | 504 | 0.5 | | | 315 | 155 | 7 | | |
| Recurl backward 2 inner | 432 | 0.25 | | | 157 | 66 | 6 | | |
| Recurl backward 2 outer | 504 | 0.25 | | | 157 | 77 | 7 | | |
| Recurl forward 1 inner | 432 | 0.3 | | | 189 | 80 | 6 | | |
| Recurl forward 1 outer | 504 | 0.3 | | | 189 | 93 | 7 | | |
| Recurl forward 2 inner | 432 | 0.2 | | | 126 | 53 | 6 | | |
| Recurl forward 2 outer | 504 | 0.2 | =490 | 126 | 62 | 7 | =452 |
| Total | 4860 | 1450 | 1903 | 86 | 1515 |
Hardware
The requirements for the on-detector FPGAs can be met by mid- or even low-price devices (such as the ALTERA Cyclone IV family or the XILINX Artix VII family). The FPGAs are to be mounted on PCBs that are placed between the recurl layers and the beam-pipe.
Firmware
The main task of the on-detector FPGAs is collecting the relatively short time slices of 16 clock cycles assembled on the pixel chips to the long intervals treated by the individual filter farm PCs. During this buffering, the hits can be time ordered inside a slice and the protocol overhead can be reduced. In addition, hits can be clustered.
A further task for the first line of FPGAs is the configuration and monitoring of the pixel chips. A histogram of the hit counts in a single sensor however requires of memory, thus exceeding the capacity of the devices; an external memory interface would significantly increase the pin count and the PCB complexity; the histograming task is thus deferred to the readout boards.
These tasks are all fairly standard and FPGAs that fulfill the bandwidth requirements for the in- and output channels do provide enough logic for implementing them.
13.3.2 Timing detector
For the timing detectors, three readout schemes are currently under investigation: One based on a further development of the DRS switched capacitor array developed at PSI, one based on the STiC chip developed at KIP, Heidelberg University and one with FPGA-based TDCs (mainly for the fibres).
DRS sampling readout
The readout of the tile and fibre detectors requires high rate capability and extremely good timing resolution. To achieve an overall detector timing accuracy below 100 ps, the associated electronics needs to be at least a factor of two better, i.e. 50 ps. The high rate environment causes significant pile-up, which limits the usage of conventional techniques such as discriminators and TDCs. Therefore one option to read out the tiles is with the well-established waveform digitizing technology developed at PSI, which is in use since many years in the MEG experiment. It is based on the DRS4 switched capacitor array, which is capable of sampling the SiPM signals with up to 5 Giga samples per second (GSPS) with a resolution close to 12 bits. It has been shown in the MEG experiment that this technology allows a timing accuracy in the order of 40 ps across many thousand channels. The knowledge of the exact waveform of an event is very well suited to detect and suppress pile-up.
The tile readout electronics could be placed outside the detector in special crates connected with a few meters of cable. This simplifies the design and maintainability, while not compromising the signal quality dramatically.
A principal limitation arises from the DRS4 chip, which is capable of only a limited event rate of about . While this will be sufficient for Phase IB, it has to be improved for Phase II. Therefore a new development has been started to design a new version of this chip. The DRS5 chip will use an internal analog memory (FIFO) to work in a dead-time less fashion up to an event rate of about . A critical part of the DRS5 chip which is the inverter chain operating the sampling circuitry has already been designed in the new CMOS technology and submitted. First test results are expected beginning of 2013. The dead-time less operation of this chip will be combined with higher sampling speed (10 GSPS) and a better timing accuracy, allowing for a time measurement well below .
In order to limit the amount of data to be read out, the FPGA connected to the DRS chip will already analyze the waveform and extract its major parameters like time and amplitude. Only a prescaled subset of events will contain the full detector waveform in order to cross-check the analysis algorithms in the FPGA. Methods have recently been published which obtain the timing information by cross correlation or cubic interpolation with an accuracy of about 1/10th of the sampling interval, which would be in the case of 5 GSPS.
STiC readout
The STiC chip offers an alternative to the DRS5 readout. STiC is a mixed mode 16-channel ASIC chip in UMC CMOS technology designed for SiPM readout with high time resolution. It is developed for Time-of-Flight measurements in high energy physics and medical imaging, in particular the EndoTOFPET-US project. The chip has a differential structure, however, it supports both differential and single-ended connection of SiPMs. A 6 bit DAC allows to tune the voltage at each input terminal within . In this way the SiPM operating voltage can be adjusted and temperature and device-to-device fluctuations can be compensated.
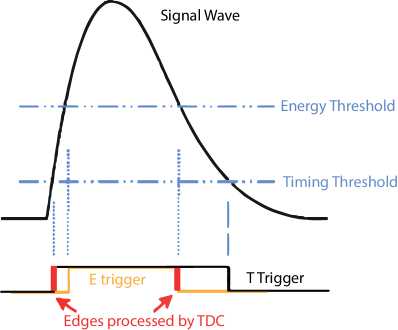
The time and charge information of the signal are encrypted into two time-stamps which are obtained by discriminating the signal with two different thresholds (see Figure 13.9). The thresholds can be tuned in a range of pixel signals for the timing and up to 200 pixel signals for the charge. The time-stamps are then processed by an embedded TDC module with a resolution of . A special linearization method is implemented to obtain a linear charge response in a very wide range. With the chip, a time-resolution of was measured for a 10 pixel signal of a MPPC S10362-33-50 without scintillator. For typical signal amplitudes of pixels, which are expected in the tile detector, the timing jitter of the chip is negligible.
The data rate of the current chip is limited to per channel. However, the chip will be modified to allow for data rates of per channel within 2013/2014. Until 2016, the data rate will be further increased to several MHz in order to match the requirements for phase II.
FPGA based readout
A further alternative for the fibre readout is the use of time to digital converters implemented in FPGAs. Resolutions of can be achieved fairly cheaply; much better performance requires the use of carry chain techniques, which greatly reduces the number of channels per FPGA and makes programming much more fickle. It has however been shown that resolutions of can be achieved with this technology [149]. Whilst definitely not the optimal solution, FPGA based timing could serve as a low-cost, low-risk solution for phase IB running.
13.4 Read-out links
In total there are three different types of read-out links in the Mu3e data acquisition system. The same type of links can be used for a small number of slow and fast control links in the opposite direction.
The data from the MUPIX chips will be transmitted to the front-end FPGAs via LVDS links at , which is a quasi industry standard. The fast serializers and LVDS drivers for the MUPIX chip will be adopted from a similar chip design by a group from Bonn [150]. The link will be physically implemented as a matched differential pair of aluminum traces on the sensor flex-print, shielded by ground lines on both sides. It is foreseen to have a first set of LVDS repeaters just outside the acceptance of the detector. Very compact commercially available LVDS repeaters have already proven to be radiation tolerant. Outside the acceptance, the flex-print will then be of multilayer type, with differential signal inner layers, shielded by ground planes. The connection to the PCB housing the front-end FPGA is made by small form factor connectors, which support high bandwidth. Lastly the routing on the front-end FPGA PCB will be done with matched differential copper traces going to the pre-defined LVDS inputs of the FPGA itself.
There will be two types of optical high speed data links. The first one is going from the front-end FPGAs to the read-out boards, the second from the read-out boards to the FPGA PCIe boards in the event filter farm PCs. The optical links from the front-end FPGAs to the read out boards have a bandwidth of , which fits well the FPGA specifications. Each FPGA has eight (or more) fast transceiver blocks. The optical interface can be implemented using radiation tolerant components developed by the Versatile Link group [151]. Especially the 12-way laser array with MTP/MPO standard connector would give a very compact form factor, the fall back solution would be a radiation hard dual laser transmitter system, the VTTx module developed at CERN [152]. The data laser will have a wavelength of and the optical fibre is of 50/125 multi-mode type, since this is a standard both in industry and in particle physics detector readout. In the case of the 12-way emitter the fibres will go to a splitter and patch panel in order to combine fibres going to the same read-out board. In the case of dual transmitters the fibres can be combined in groups of 12 using break-out fibre cables. The fibres traveling from the experimental area to the filter farm counting house can be further combined in cables containing fibres going to the same sub-farm. An optical patch panel for each sub-farm will allow to connect the long distance 96-fibre cables to 12 fibre patch cords going to the readout boards. The readout boards have 2 or 3 12-way optical inputs, which are populated with commercial receiver modules. The high-end FPGAs used on the read-out card have up to 66 high speed transceiver blocks, which will be used for the de-serialization of the data.
The last type of link connects the read-out cards to the FPGA PCIe boards in the event filter farm PCs. This optical link will be implemented as high speed link. Since each read-out board is connected to every sub-farm PC with one of the high speed links, they are point to point single fibre links. The fibres are of 50/125 multi-mode type operated at to stay compatible with the links from the detector. If 12-way optical transmitters and receivers running at can be purchased, they will be used for this high speed link. Otherwise single fibre transmitters and receivers will be used both on the read-out board and the FPGA PCIe board side. In practice the high speed optical receivers for the FPGA PCIe boards could be on optical mezzanines such as the 8 channel St. Luce card developed by TU Dortmund [153].
13.5 Read-out cards
The main tasks of the read-out cards is to act as switches between the front end and the on-line reconstruction farm and to act as buffers between the synchronous front end and the asynchronous back end. The board design and choice of FPGAs is dominated by the number of fast links required. We plan to adapt an existing development, e.g. LHCb TELL1 cards [154] or PANDA compute nodes [155], which would both fulfill our needs.
13.6 Event filter interface
The filter farm PCs will be equipped with FPGA cards in PCIe slots and optical receiver daughter cards, as described in more detail in section 14.2.
13.7 Data collection
The filter farm will output selected events at a data rate in the order of 50 MBytes/s in total. This data rate is low enough to be collected by a single PC connected to the filter farm by common GBit Ethernet and written to local disks. Then the data will be transferred to the central PSI computing center, where it is stored and analyzed. For the central data acquisition the well established MIDAS (Maximum Integrated Data Acquisition System) [156] software package will be used. This software is currently used in several major experiments such as the T2K ND280 detector in Japan [157], ALPHA at CERN and the MEG experiment at PSI [158]. It can easily handle the required data rate, and contains all necessary tools such as event building, a slow control system including a history database and an alarm system. A web interface allows controlling and monitoring the experiment through the Internet. The farm PCs will use MIDAS library calls to ship the data to the central DAQ PC. The framework also offers facilities to send configuration parameters from a central database (the “Online DataBase” or ODB) to all connected farm PCs and to coordinate common starts and stops of acquisition (run control).
For the purpose of monitoring and data quality control of the experiment the MIDAS system offers taps to the data stream for connections of analysis and graphical display programs. The output of graphical user interface programs can be fed back into the web interface of the MIDAS system so the experiment can be monitored also remotely with just a Web browser.
13.8 Slow control
The slow control system deals with all “slow” data such as high voltages for the SiPMs and silicon sensors, ambient temperatures and pressures. For the configuration and control of the silicon pixel sensors the JTAG standard [132] will be used. It is planned to use the MIDAS Slow Control Bus (MSCB) system [159] to link all distributed control and monitoring devices into a single system. The MSCB system is also well established at several laboratories. It uses a serial differential bus for communication, and simple micro controllers in all control devices. The micro controllers perform local control loops such as high voltage stabilization, and send measured values to the central DAQ system for monitoring. Many devices already exist for this system, such as the SCS-2001 unit shown in 13.10. Since the system was developed at PSI, it can be quickly adapted to new hardware. The high voltage control for the SiPMs can for example be directly integrated into the carrier boards holding the SiPMs, thus eliminating the need for high voltage cables. The optimized protocol of the MSCB system allows the monitoring of many thousand channels with repetition rates in the 100 ms range, which will be more than enough for this experiment.
In addition to the MSCB system, the MIDAS slow control package contains interfaces to the PSI beamline elements via the EPICS system [160]. This allows monitoring and control of the beamline from the main DAQ system, which has been proven very versatile in other experiments using this scheme.
All slow control data will be stored in the history system of the MIDAS system, so that long term stabilities of the experiment can be effectively verified. The slow control data is also fed into the main event data stream, so that any offline analysis of the event data has this data available.
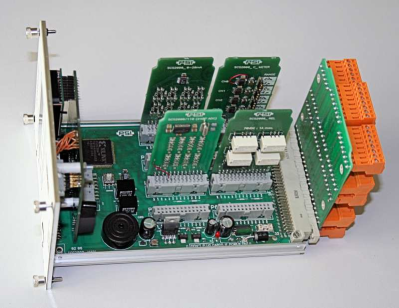
A special case is the configuration of the pixel detectors, which require many million parameters, like the trim-DAC values for each pixel. Since the amount of data here is considerably larger than for all other systems, an extension of the slow control system is planned. A dedicated program manages, visualizes and exchanges the pixel detector configuration parameters between an optimized database and the pixel hardware. In this way the time required to configure the pixel detectors can be minimized, while this program is still connected to the main DAQ system. It can be synchronized with run starts and stops, and can inject pixel monitoring data periodically into the event data stream for offline analysis.
Chapter 14 Online Event Selection
14.1 Selection Algorithms
As in the final analysis, event selection in the filter farm can rely on the coincidence of three tracks in time and vertex and on their kinematics. Especially for high rate running, coincidence in time in the fibre detector is not sufficient to reduce the data rate by three to four orders of magnitude. Thus a track reconstruction will be required. The triplet based multiple scattering fit described in chapter 16 is well suited for online implementation and current GPUs can perform triplet fits per second111As tested on a AMD Radeon 6990 using OpenCL under Linux., thus already fulfilling the needs of Mu3e up to at least medium intensity (few muons/s) running.
Triplets of the tracks thus reconstructed can then be fit to a common vertex. Even loose vertex requirements can give a reduction factor at muon rate and for the phase I experiment (see Figures 14.1 and 14.2). Combining the vertexing with modest kinematic requirements (e.g. on the three-particle invariant mass or the planarity) should produce the required data reduction, leaving the timing information as a valuable offline cross-check (and obviating the need for online timing reconstruction).
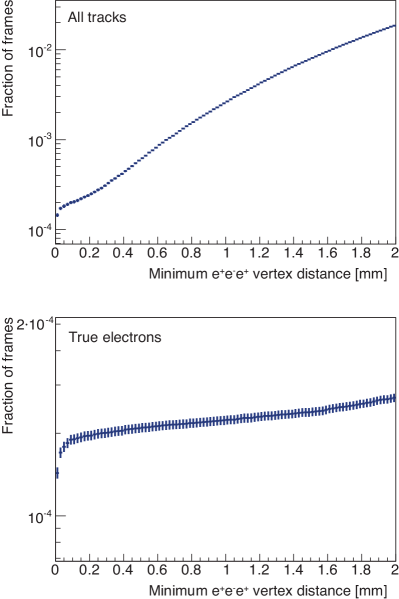
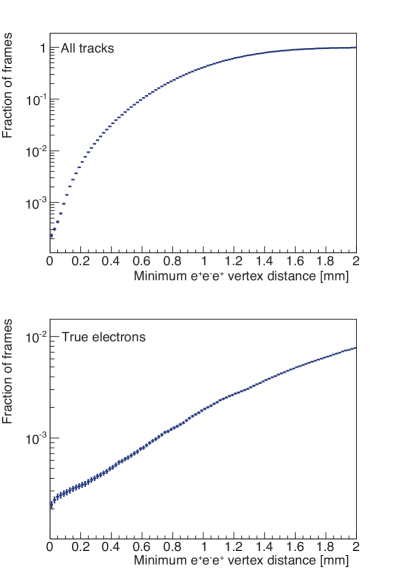
14.2 Hardware Implementation
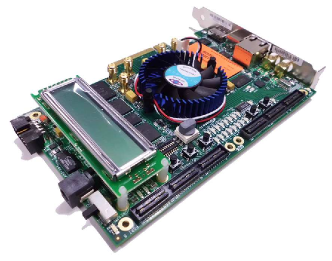
The data will arrive on the farm PCs via optical links on a PCIe FPGA board. The FPGA will perform the event building and buffering and also allows to run simple clustering and sorting algorithms. The event data are then transferred via DMA over the PCIe 3 bus222Note that PCIe is actually not a bus protocol, but offers switched point-to-point connections. The bus designation is due to the software-side backwards compatibility to the original PCI bus interface. to the memory of a graphics processing unit (GPU), where the selection algorithms are run. The GPU then posts selected events and monitoring data to the main memory of the PC, from where the CPU ships it via Ethernet to the central data acquisition computer running the MIDAS software. At that computer, the data streams from the farm PCs are combined into a single data stream, combined with various slow control data, compressed and stored.
For the receiver FPGA cards, evaluation boards from either XILINX [161], or ALTERA (Figure 14.3) [162, 163] or similar hardware built by the collaboration could be used in conjunction with daughter boards with the optical receivers (similar to e.g. the optical receiver boards used in the LHCb readout electronics [164]). The maximum data rate over the PCIe 3.0 bus is , amply sufficient for phase I333For phase I running, the FPGA-GPU link can also be implemented on PCIe 2.0 (max. ), which is better supported on currently available FPGAs.. For the full phase II rate, the raw link speed is still sufficient, would however have to be fully and efficiently used. The PCIe 4.0 standard, doubling this rate, should become commercially available around 2017, compatible with phase II running; alternatively, the number of farm PCs could be increased.
The GPU boards will be obtained commercially as late as possible in order to profit from the fast developments and sinking prices. As far as raw floating point throughput is concerned, current high-end GPUs already pack enough power for high rate running [165, 166]. Newer cards are however expected to offer higher memory bandwidth and better caching. Also the performance of the driver software (especially as far as the PCIe 3 bus is concerned) and the GPU compilers is expected to improve. The two GPU vendors AMD and NVIDIA offer fairly different architectures; which one performs better depends a lot on the details of the algorithm to be implemented; we are currently performing tests with both architectures and will choose a vendor once we have a mature implementation.
We currently plan to host the farm PCs in individual tower casings, ensuring enough space for the FPGA board and the high end GPU whilst allowing for air cooling. At load, each tower will consume around , so adequate cooling of the counting house is essential.
Chapter 15 Simulation
This chapter describes the Geant4 [167, 124] based simulation used to derive the figures and plots in this proposal.

15.1 Detector geometry
15.1.1 Beam delivery
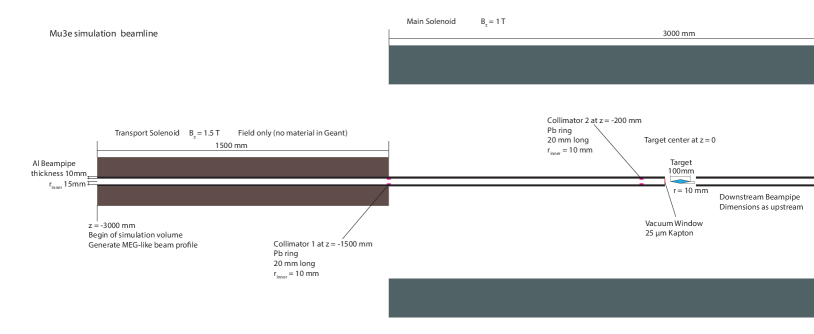
In the simulation, the beam is started in front of the target inside a beam transport solenoid. Beam particles are generated with a profile and momentum spectrum like the one observed in MEG. before the target, the beam enters the main solenoid and shortly before the target it exits the beam vacuum through a thin window. Along the beamline, two thick lead collimators reduce the beam to the target size. For an overview of the simulated beamline elements, see Figure 15.2. In this simple setup, about a third of the generated muons decay in the target, which, whilst not very efficient, gives a conservative estimate of beam-induced backgrounds.
15.1.2 Target
The target is simulated as a hollow aluminium double cone supported by three nylon strings at each end and a nylon string along its axis, see also chapter 9.
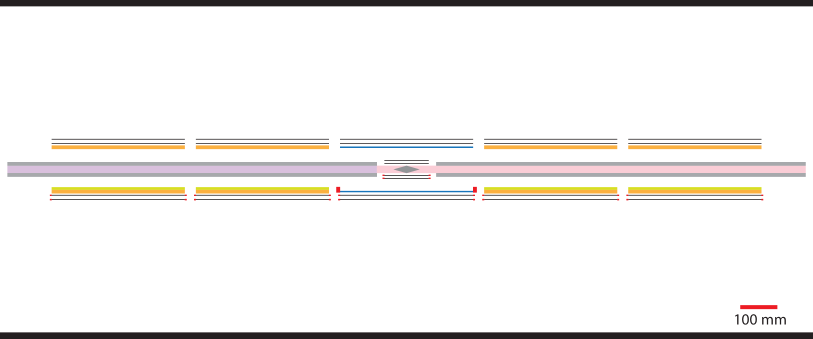
15.1.3 Pixel detector

The pixel detector is simulated as of silicon on top of of aluminium representing the traces on the flexprint (covering half the available area) on top of of Kapton, with the silicon offset such that an overlap with next sensor is created, see Figure 15.4. Half a millimeter of the pixel sensor at the edge is assumed to be inactive, the rest is divided into pixels. The simulated sensor layers are supported at their ends by plastic and aluminium structures modeled on those in the mechanical prototype shown in Figure 10.20.
15.1.4 Scintillating fibres
The fibre detector is simulated as three circular layers of scintillating fibres in the main simulation. A detailed simulation including optical transport and the effect of fibre cladding and coating also exists, see section 11.3. The results of the detailed simulation regarding light yield and propagation times will eventually be fed back into the main simulation in a parameterized form. The response of the silicon photomultipliers is simulated by the GosSiP package [148]. In the simulation, the fibres are supported at both ends by massive aluminium rings.
15.1.5 Tile detector
The simulated tile detector consists of plastic scintillator tiles mounted on an aluminium tube. Also here, a separate detailed simulation including light transport and silicon photomultiplier response is available and will have to be fed back into the main simulation in a parameterized form.
15.2 Magnetic field
The simulated magnetic field can be read from arbitrary field maps or generated in the code via integration over current loops. The propagation of muons in the field includes spin tracking. For the simulations shown in this report, the field was generated from 100 current loops spaced equally over , with currents normalized such that the longitudinal component of the field in the center of the target is , supplemented by a field in the center of the beam transport solenoid, see section 15.1.1 and Figure 15.2.
15.3 Physics Processes
15.3.1 Multiple Coulomb scattering
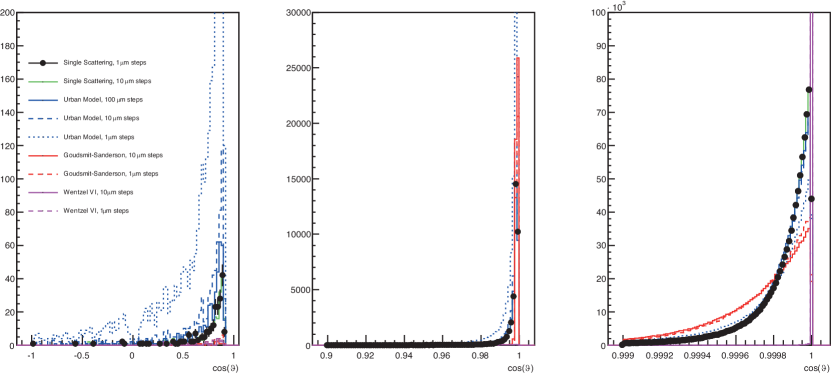
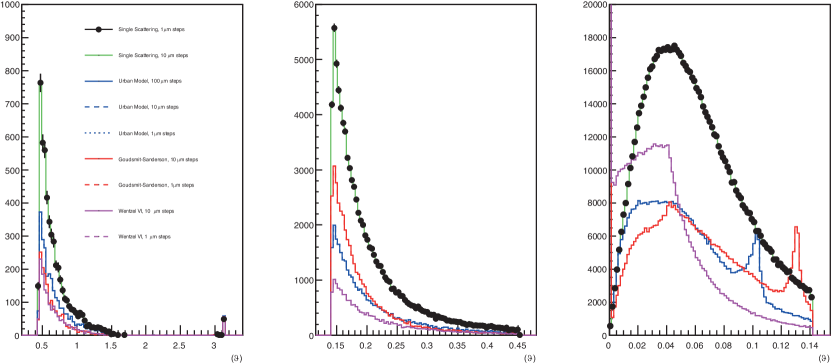
Multiple coulomb scattering is the main limiting factor for the resolution of the experiment; an accurate simulation is thus crucial. The best results are obtained by simulating each individual scattering, which however results in prohibitively large computing times. A large selection of multiple scattering parameterizations are available in Geant4; in a test setup they were compared to the single scattering model, see Figure 15.5. The best overall description is obtained from the Urbán-Model [168] at large step widths, which also has the shortest computation times. In the helium gas on the other hand, none of the parameterizations performs adequately, see Figure 15.6.
We plan to verify the simulation results with beam telescope measurements in 2013, which should also lead to a usable parameterization of multiple scattering in gases.
15.3.2 Muon decays
Michel decay
Geant4 implements the Michel decay including polarization of both the muon and the positron based on [169] and [170]. The spectra of the neutrinos do not follow the physical distribution, this does however not affect the simulation for Mu3e. Somewhat more worrying is the fact that the Michel matrix element contains radiative corrections but is not clearly separated from the radiative decay matrix element.
Radiative decay
Radiative decay with internal conversion
The radiative decay with internal conversion is simulated using the hit and miss technique on events generated evenly in phase space using the RAMBO code [173] and applying the matrix element from [116]. Unfortunately, there is currently no polarized version of the matrix element available and thus the simulation is unpolarized. The hit and miss technique is very expensive in terms of computation time, if the complete phase space is to be simulated (as the matrix elements varies by more than 16 orders of magnitude), this can however be overcome by restricting the simulation to regions of particular interest, e.g. high invariant masses of the visible particles.
Signal
The signal kinematics are highly model-dependent, see chapter 4. If not otherwise noted, we have used three particle phase space distributions in the simulation, following the practice of SINDRUM and earlier experiments.
Special decays
The simulation allows the simulation of overlap decays, where we force more than one muon decay to happen at a single vertex. Thus we can simulate the accidental backgrounds arising e.g. from the overlap of an internal conversion decay and a Michel decay without having to generate in excess of frames.
15.4 Time structure
As the Mu3e experiment operates with a quasi continuous beam, the paradigms of bunch crossing and event from collider experiments do not apply; they have however informed the design of the Geant4 package. In our simulation, particles are assigned a ID, which is unique over a run and thus conserves identities and mother-daughter relationships across the boundaries of read-out time frames. Before each step of tracking the particle through the detector, it is checked whether the particle has just crossed into the next time slice. If so, its information is stored, its time relative to the time slice adjusted and tracking deferred to the next slice. Thus we ensure that we correctly treat muons stuck in the target before decaying and decay products crossing read-out frame boundaries while traversing the detector. In order to simulate a steady state, where approximately the same number of muons enter the target and decay, the first of simulation running, during which the target is loaded, are usually thrown away and not used in occupancy or efficiency studies.
Currently not simulated are effects of the structure of the primary proton beam on the time structure seen in the detector; if this would be needed, a measured structure could easily be superimposed on the generation of muons in the simulation framework.
Chapter 16 Reconstruction
16.1 Track Reconstruction in the Pixel Tracker
A precise track reconstruction of electrons is of highest importance for the identification of the decay with a sensitivity of 1 out of () ordinary Michel decays in phase I (II), which have to be suppressed by 16 orders of magnitude.
Due to the high rate and the resulting high occupancy especially at phase II of the project with up to 100 tracks per readout frame, the reconstruction algorithm has to deal effectively with the combinatorial background in order to reduce the fake rate, i.e. the rate of wrongly reconstructed tracks, to an acceptable level. The combinatorial problem is not only due to the high rate but also due to the large bending of the low momentum electrons in the strong magnetic field of , which, depending on the position and flight direction can make several turns in the detector (recurlers). Hit combinations can span over distances of more than half a meter. Hits of recurling tracks are found on opposite sides of the detector and still have to be correctly combined by the reconstruction program. This is of particular importance for the determination of the flight direction and therefore charge of the particle. Only for a fully reconstructed track the time information provided by the time of flight system can be correctly applied.
As the full detector readout is triggerless, all muon decays have to be fully reconstructed already on filter farm level, setting high demands on the speed of the online track reconstruction algorithm. A further complication comes from the fact that the track resolution is dominated by multiple scattering in the silicon pixel sensors and not by the pixel size, in contrast to most other experiments. Therefore, standard non-iterative circle fits of tracks [174] as used in high energy experiments can not be used here.
In order to reduce multiple scattering, the number of sensor layers are reduced to a minimum in the detector design which, unfortunately, also reduces redundancy for track reconstruction. Therefore, the track reconstruction also has to cope with a minimum of information provided by only four sensor layers.
16.2 Track Fitting and Linking
For the track reconstruction two different approaches are followed in the Mu3e experiment, the broken line fit [175, 176] and the fast linear fit based on multiple scattering [177]. The broken line fit determines hit positions and scattering angles simultaneously and was implemented in 2D [175, 178] and recently also in 3D [176, 179]. It is based on linearisation of a previous circle fit, works non-iteratively and provides the correlation between all fit quantities. The broken line fit, however, requires knowledge of the assignments of hits to tracks from a previous linking step. Therefore, the broken line fit can only be used in the final step of the track reconstruction, also because a previous track fit is required for the linearisation procedure.
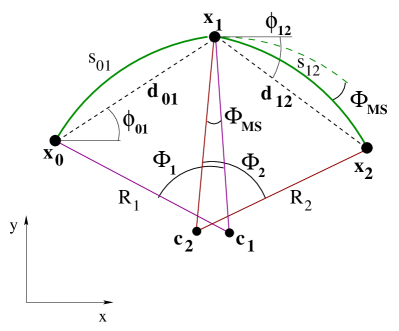
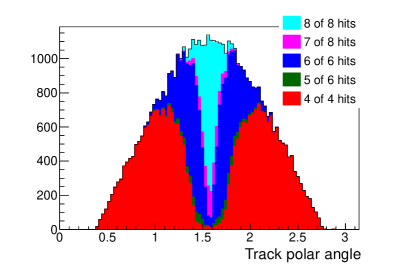

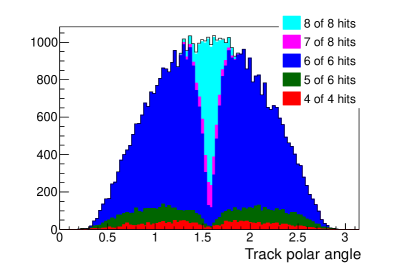
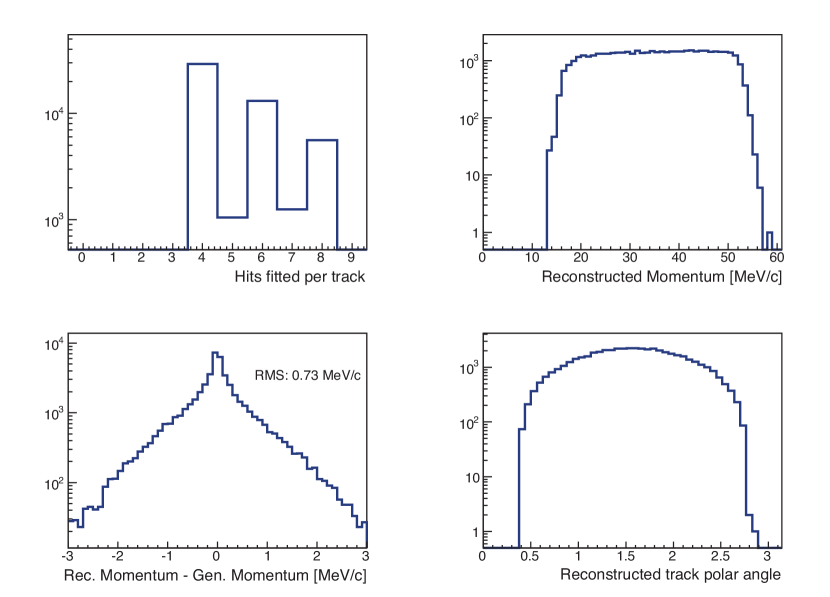
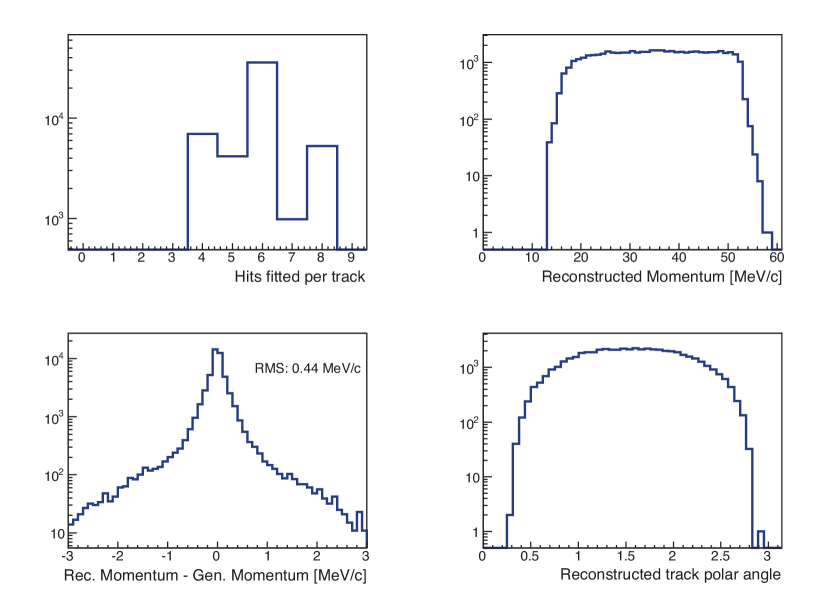
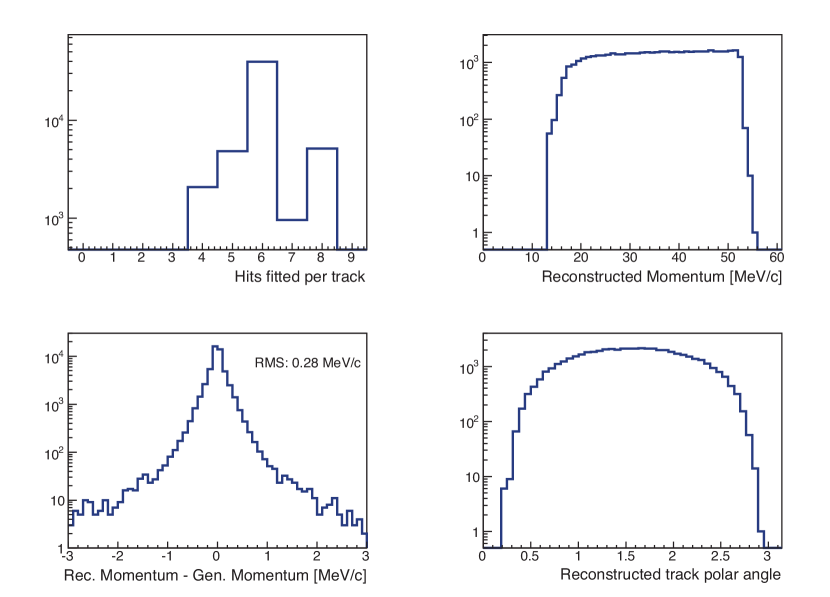
The fast three-dimensional multiple scattering (MS) fit [177] is based on fitting the multiple scattering angles at the middle hit position in a hit triplet combination, see Figure 16.1. In this fit, spatial uncertainties of the hit positions are ignored. This is a very good approximation for the Mu3e experiment as the pixel resolution uncertainty given by is much smaller than the uncertainty from multiple scattering in the corresponding sensor layer. The MS-fit requires a detailed knowledge of the material distribution in the detector for the calculation of the scattering angle uncertainty. It minimises the azimuthal and polar scattering angles at the sensor corresponding to the middle hit and exploits energy conservation111the energy loss in the Mu3e experiment is only about keV per sensor layer and can be neglected for track finding.. The hit triplet trajectory, represented by two connected helical curves, is described by the following two equations:
| (16.1) | |||||
| (16.2) |
The quantities, also shown in the sketch of Figure 16.1, are the following: is the three dimensional track radius, which can be directly related to the momentum of the particle for a given magnetic field; () are the bending angles of the first (second) arc and () and () are the distances between the hits in the plane transverse and longitudinal to the solenoidal magnetic field between the first and second (second and third) hit, respectively. These equations can be linearised and solved in a fast non-iterative procedure [177].
This linearized MS-fit is used as basis for the full reconstruction of tracks in the pixel detector. Tracks with more than three hits are fitted by subsequently combining several hit triplets. In the current reconstruction program [180], long tracks combining hits from several pixel layers are reconstructed first, then shorter tracks with fewer hit assignments are reconstructed. This procedure is repeated until no hits are left or no further tracks are found. Tracks with unresolved hit ambiguities are ignored in the following study to ensure high quality tracks with low fake rate. Also tracks with less than four hits combined are ignored.
The number of hits linked to tracks depends on the single hit efficiency, which is assumed to be 98% in the following studies, on the track direction (polar angle), the geometry of the pixel tracker and the geometrical acceptance of the detector, which is largest in phase II with four recurl stations. The multiplicity of linked tracks as function of the polar angle is shown in Figures 16.2, 16.3 and 16.4 for the three different detector configurations. The multiplicity of linked hits is highest in the central region of the detector, where recurling tracks can be fully reconstructed. In the current version of the reconstruction program, only single turns of tracks are reconstructed, corresponding to a maximum of eight hits - four hits assigned to the outgoing trajectory and four hits assigned to the returning trajectory. In cases where one hit is missing, only seven hits are linked. For upstream or downstream going tracks the recurlers are not fully reconstructed, leading to tracks with mainly four linked hits or six linked hits depending on the detector setup and the number of implemented recurl stations. It should be noted here that there is a big qualitative difference between the four-hit tracks and tracks with more than 4 hits (recurlers). The bending radius of recurling tracks can be measured with much higher precision due to the larger bending in the magnetic field. This leads to very different momentum resolutions for the different detector setups.
In phase IA without Recurl Stations most tracks are reconstructed with only four linked hits. This yields a momentum resolution for reconstructed Michel electrons of about , see Figure 16.5. This resolution improves considerably to by adding two inner Recurl Stations in phase IB (Figure 16.6) and it improves further to by adding two inner and two outer Recurl Stations in phase II Figure 16.7). The reconstruction of the recurling tracks, which provide high resolution momentum information, is crucial for the success of the experiment.
16.3 Vertex Fitting
A vertex fit will be used to precisely reconstruct the position of the muon decay for signal events. The vertex fit intrinsically checks the consistency of the assumption that all three signal candidate tracks originate from the same vertex. A common vertex fit of the three candidate electrons allows a suppression of the combinatorial background of Michel decays by a factor of about due to the very good pointing resolution of the pixel detector, which is mainly given by the multiple scattering at the first sensor layer. Instead of using a common vertex fit, also the distance between target impact points of reconstructed and extrapolated tracks can be used to discriminate signal against background. For simplicity the latter approach is used here for the following sensitivity study.
Chapter 17 Sensitivity Study
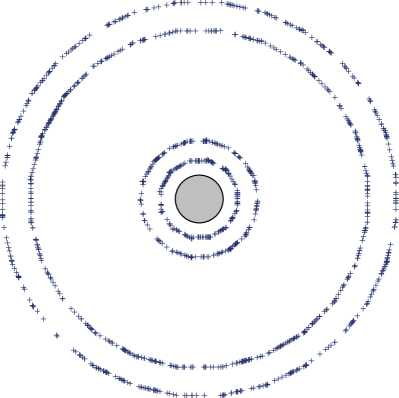
| Phase IA | Phase IB | Phase II | |
| Recurl stations | 0 | 2 | 4 |
| Scintillating fibres | No | Yes | Yes |
| Charge measurement | No | Yes | Yes |
| Target stopping rate1 (Hz) |
1 Highest possible rates are assumed in the simulation in order to be conservative.
A sensitivity study based on a full simulation of the pixel detector is performed to estimate the background contribution at the different phases of the Mu3e experiment. The simulation includes a first material description of the detector, which varies between the different detector phases. The increasing level of detector instrumentation at later stages of the experiment will provide more information for particle tracking on one hand. On the other hand, the scintillating fibre tracker, which will be added at a later stage of the experiment when running at high muon rates, will also add multiple scattering and consequently increase confusion in the track linking step. In addition, the factor 10 and 100 higher increased particle rates at the Phase IB and II, respectively, will significantly increase the combinatorial background from Michel decays and other accidentals. A detailed simulation is therefore required to estimated the sensitivity reach of the different experimental phases. The simulated setups are summarized in Table 17.1.
17.1 Simulation and Reconstruction Software
In order to estimate the maximum achievable sensitivities at the different stages of the project the track reconstruction program [180] is interfaced to a) a full GEANT simulation of the detector and b) to a fast simulation program, which is mainly used for the following sensitivity studies. Both simulations were cross checked to give comparable values for the track parameter resolution.
In a first test it was proven that the track reconstruction program is relatively insensitive with regards to changes of the single hit efficiency. Using tight reconstruction criteria it is found that a loss of signal hits corresponds to an about loss of tracks and an about loss of signal events.
Noise hits also affect the track reconstruction. From noise studies of the MUPIX2 prototype chip it is known that the noise rate is very small (no noise hits were observed in an overnight run at a low threshold). To simulate the effect of noise 100 additional hits are randomly generated in the pixel detectors, corresponding to a noise rate of Hz per pixel. This rate will be remeasured as soon as a first large scale detector including a full readout chain becomes available.
17.2 Signal Acceptance
Signal events are generated by using a constant matrix element in phase space. This choice is motivated by LFV models with effective four-fermion contact interactions, which predict a constant matrix element. The so generated signal events are used for the following efficiency studies.
The resulting signal efficiency is mainly given by the acceptance of the experiment, which is in total about for the innermost detector layers being placed at radii of approximately and . The total acceptance consists of two contributions, one related to the orientation of the decay plane with respect to the instrumented regions of the experiment and one from the minimum bending radius (momentum), which can be reconstructed in the experimental setup.
By moving the inner pixel layers closer to the target, the total acceptance can be slightly increased to about . Further improvements of the total acceptance to about or more are only possible by using a longer inner barrel design and by reconstructing particles with a lower momentum threshold. The latter can be achieved in two ways - a) by including highly bent trajectories in the track reconstruction or b) by decreasing the strength of the magnetic field, which however also compromises the momentum resolution.
In the following, a conservative design is chosen with inner sensor layers placed at and outer sensor layers placed at , providing a signal acceptance of about .
The resulting mass resolutions calculated from the reconstructed track parameters are shown in Figures 17.2-17.4 for the different phases. Compared to phase IA, the mass resolutions improve considerably by adding the recurl stations at phase IB and phase II and yield - despite the additional material from the scintillating fibre tracker - resolutions well below . Of special importance for the background suppression is the strong reduction of the tails in the phase II setup.
17.3 Selection
17.3.1 Kinematic Selection of Signal Events
The mass resolution can be further improved by rejecting badly reconstructed signal events, where one or several tracks are either wrongly reconstructed or suffer from large multiple scattering. A wrong measurement of the track momentum or direction affects momentum balance and leads to a measurable missing momentum. In the following we follow the strategy of the SINDRUM experiment [15] and define an acoplanar momentum vector , which is obtained by projecting the vectorial sum of all track momenta into the decay plane defined by the three tracks. The correlation between the reconstructed invariant mass and the variable is shown in Figures 17.5. In addition to the main spot at small values of , which originates from well measured signal events, two diagonal sidebands originating from wrongly measured signal events are visible. By applying the cut , which will also be used to reject background events in the following, most of the wrongly measured signal events are rejected.
The resulting mass resolution plots are shown in Figure 17.6-17.8, which show by about improved resolutions and significantly reduced tails. The expected mass resolutions and signal efficiencies for the three stages of the experiment are summarized in Table 17.2.

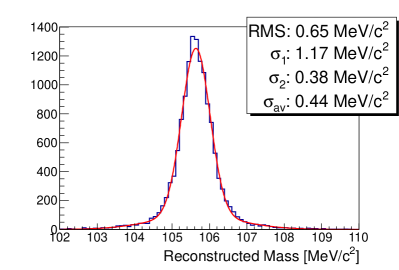
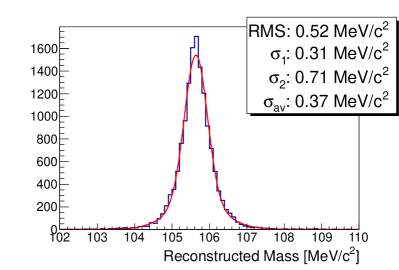


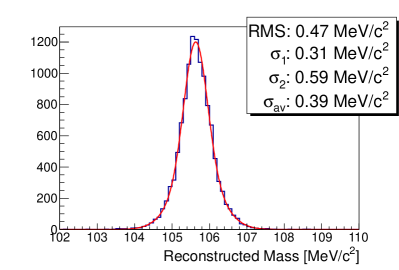
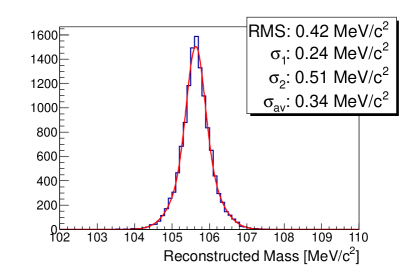
| Phase IA | Phase IB | Phase II | |
| Michel decays: | |||
| Efficiency (unpolarized) | |||
| Momentum RMS | |||
| Wrong charge fraction | |||
| Signal: | |||
| Reconstruction efficiency | |||
| Energy sum RMS (reconstructed) | |||
| Efficiency after selection | |||
| Energy sum RMS (selected) | |||
| Track resolution () |
The main criterion for the kinematic selection of signal events is the reconstructed invariant mass. In a final analysis the number of signal and background events will be determined by a fit of the invariant mass distribution, see also Figures 17.12-17.14 or by exploiting multivariate methods which include several estimators. For sake of simplicity the number of signal events is here determined from a 2-sigma mass window around the nominal muon mass.
17.3.2 Reduction of the Background
The acoplanar momentum cut is also very effective in reducing the dominating background from radiative events with internal conversion . These events are characterized by missing energy carried away by the two undetected neutrinos. Most of these background events have either a small value of the reconstructed three electron mass or show some momentum imbalance. In particular the class of dangerous background events, which have only little missing energy, carried away by the two neutrinos, and are wrongly reconstructed such that the reconstructed invariant mass matches the muon mass, show some significant momentum imbalance. Most of these background events are rejected by the cut .
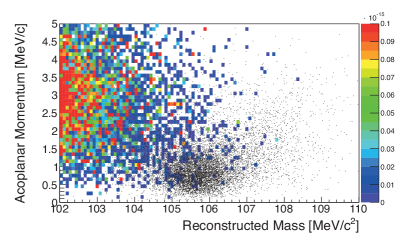
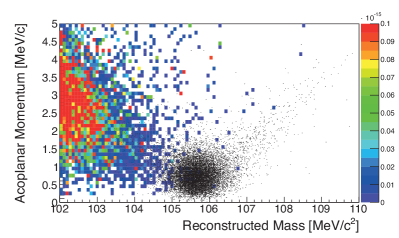
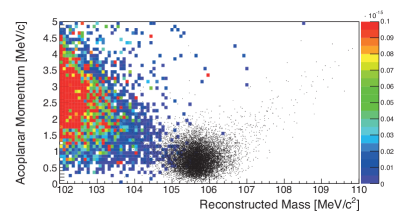
The separation of signal and background in the plane versus is shown for the three stages of the experiments in Figures 17.9-17.11. A clear separation of signal and background events at a level of muon decays is visible. This separation improves with the upgraded experiment at phase IB and II.
The projected invariant mass distribution of signal and background after applying the acoplanar momentum cut is shown in the Figures 17.12-17.14. Theses distributions are used as basis for the estimated sensitivity calculation.
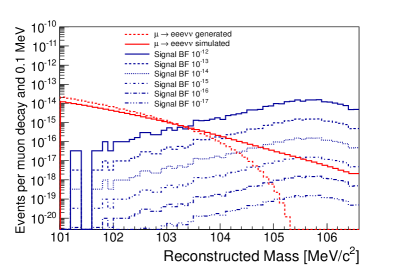


17.3.3 Reduction of Accidental Background
The dominant contribution to the accidental background comes from combinatorial background of three Michel decays () and from coincidences of a radiative muon decay with internal conversion with a Michel decay . Both types of backgrounds are significantly reduced by applying vertex and time requirements. The combinatorial Michel background depends quadratically on the vertex and time resolution, whereas the coincidences coincidence rate scale linearly with the vertex and the time resolution.
The vertex resolution in the transverse direction can be represented by the distance of closest approach when the track is extrapolated to the muon decay position. This values is about in all phases of the experiment and given in Table 17.2. For a target size of in length and in diameter a reduction factor of can be derived per coincidence.
The estimation of the reduction factor from the timing cut, relevant for phases Ib and II, is difficult as the design for the time of flight system has not been finalised yet. Another difficulty comes from the fact that the timing resolutions of the scintillating fibre detector the scintillating tiles detector are expected to be different and that particles depending on their flight direction will be measured in both detectors or by the scintillating fibre detector only if staying in the central region. In the latter case the particles will be measured many times in several turns, what also leads to an increase in precision. Preliminary studies indicate that timing resolutions of in the scintillating fibre detector and in the Scintillating Tiles Detector can be achieved, see sections 11 and 12. For the sensitivity calculation it is assumed that all particles will be measured with a time resolution of better than and that reduction factors of per coincidence can be obtained at a signal efficiency of .
17.4 Results
The signal efficiencies and the expected background reduction factors of the different selection cuts are summarized in Table 17.3. Single event sensitivities are calculated, which are defined as the branching ratio at which one background event is expected. The sensitivity of the experiment scales with one over the number of muons on target as long as the single event sensitivity is not reached and with one over the square root of the number of muons on target after. It can be seen that the single event sensitivity at phase IB is higher than at phase II. This comes from the fact that the combinatorial background increases at higher muon rates. However, the time to reach the aimed sensitivity of takes in phase IB ten years of running whereas at phase II this sensitivity can be reached in 180 days because of the higher muon rate, see Figure 17.15. Although the expected sensitivity at phase IA, even without the time of flight system, is quite high with it would take a long time of running to reach this sensitivity. However, about one month of running is sufficient to reach a sensitivity of , which is factor ten smaller than the current experimental bound.
| Phase IA | Phase IB | Phase II | |
| Backgrounds: | |||
| Michel | 0 | ||
| and accidental Michel | 0 | ||
| Total Background | |||
| Signal: | |||
| Track reconstruction and selection efficiency | |||
| Kinematic cut () | |||
| Vertex efficiency | |||
| Timing efficiency | - | ||
| Total efficiency | |||
| Sensitivity: | |||
| Single event sensitivity | |||
| muons on target rate (Hz) | |||
| running days to reach | 350 | 18 | |
| running days to reach | - | 180 | |
| running days to reach single event sensitivity | 260 |
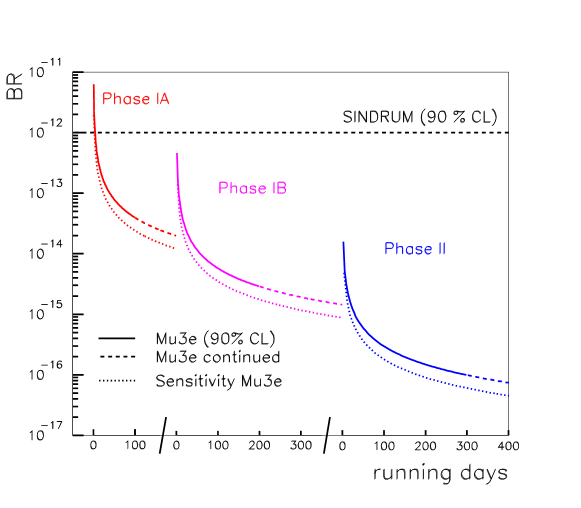
Part III The Mu3e Collaboration
Chapter 18 The Institutes in Mu3e
18.1 Responsibilities
The responsibilities of the institutes participating in Mu3e are outlined in Table 18.1. This list concerns the phase I experiment and does not imply funding responsibilities.
18.2 Collaborators
18.2.1 University of Geneva
Currently working on Mu3e:
Alain Blondel Professor
Alessandro Bravar Professor
Martin Pohl Professor
Antoaneta Damyanova Master student
Planned positions:
1 Postdoc
1 Ph.D. candidate
18.2.2 University of Zürich
Currently working on Mu3e:
Ueli Straumann Professor
Peter Robmann Senior scientist
Roman Gredig Ph.D. candidate
18.2.3 Paul Scherrer Institut
Currently working on Mu3e:
Felix Berg Ph.D. candidate
Malte Hildebrandt Senior scientist
Peter-Raymond Kettle Senior scientist
Angela Papa Senior scientist
Stefan Ritt Senior scientist
Alexey Stoykov Senior scientist
Funded open positions:
1 Postdoc
1 Ph.D. candidate
18.2.4 ETH Zürich
Currently working on Mu3e:
Christophorus Grab Professor
Günther Dissertori Professor
Rainer Wallny Professor
Planned positions:
1 Ph.D. candidate
18.2.5 University of Heidelberg
Physikalisches Institut (PI)
Currently working on Mu3e:
André Schöning Professor
Dirk Wiedner Senior scientist
Sebastian Bachmann Senior scientist
Niklaus Berger Junior research group leader
Bernd Windelband Mechanical engineer
Moritz Kiehn Ph.D. candidate
Kevin Stumpf Mechanical engineer
Raphael Philipp Master student
Funded open positions:
1 Postdoc
4 Ph.D. candidates
Planned positions:
1 Postdoc
1 Ph.D. candidate
Kirchhoff Institut für Physik (KIP)
Currently working on Mu3e:
Hans-Christian Schultz-Coulon Professor
Wei Shen Postdoc
Patrick Eckert Ph.D. candidate
Carlo Licciulli Master student
Tobias Hartwig Bachelor student
Planned positions:
1 Postdoc
1 Ph.D. candidate
Zentralinstitut für Technische Informatik
Currently working on Mu3e:
Peter Fischer Professor
Ivan Péric Senior scientist
| Component | Responsible |
|---|---|
| Beam | PSI |
| Magnet | UGS |
| Heidelberg PI | |
| Target | Heidelberg PI |
| PSI | |
| Pixel chip | ZITI Mannheim |
| Heidelberg PI | |
| Heidelberg NB | |
| Pixel detector | Heidelberg PI |
| Mechanics and cooling | Heidelberg PI |
| Pixel on-detector electronics | Heidelberg NB |
| Heidelberg PI | |
| Read-out electronics | Heidelberg NB |
| Fibre detector | Geneva |
| Zürich | |
| ETHZ | |
| PSI | |
| Tile detector | Heidelberg KIP |
| Timing electronics | PSI |
| Heidelberg KIP | |
| Geneva | |
| Zürich | |
| ETHZ | |
| Filter farm | Heidelberg NB |
| Slow control | PSI |
| Infrastructure | PSI |
Chapter 19 Schedule
19.1 Phase I Schedule
Our goal is to take first data in 2015, with a pixel-only detector. Correspondingly, the timing critical items are the central pixel detectors and the magnet. Prototyping on the first is well underway and a first instrumented assembly corresponding to the vertex layers should be operational by late 2013. Magnet design has also started, however the tendering process will consume about half a year; we hope the actual magnet construction will be under way early in 2014.
For a second, longer run in 2016, we plan to integrate the fibre detector as well as the inner recurl stations complete with timing tiles. As the outer recurl stations are identical to the inner ones, we plan to maintain the production capacities and manufacture them during 2016.
Depending on the outcome of the 2016 run and the schedule for the high intensity beam line, 2017 could either be spend for phase II preparations or with an extended run at the existing beamline.
19.2 Phase II Schedule
The phase II schedule is contingent on the schedule for the high intensity beamline. By 2017, we can have all required detector components ready. If the phase I experience shows that major parts of the detector will have to be rebuilt, earliest phase II startup would slip to 2018.
Chapter 20 Cost Estimates
| Item | Estimated cost |
|---|---|
| (KCHF) | |
| Beam line | < 50 |
| Target | < 10 |
| Pixel detector (central) | 400 |
| Pixel detector (2 recurl stations) | 200 |
| Scintillating fibres | 200 |
| Tile detector (2 stations) | 110 |
| Mechanics and cooling | 200 |
| DAQ pixel detector | 50 |
| DAQ fibres | 200 |
| DAQ tiles | 190 |
| Central DAQ | 100 |
| Filter farm | 50 |
| Slow control | 50 |
| Infrastructure | 100 |
| Total | 1910 |
| Item | Estimated cost |
|---|---|
| (KCHF) | |
| Beam line | u.a. |
| Target | < 10 |
| Pixel detector (upgrade central) | 200 |
| Pixel detector (2 recurl stations) | 200 |
| Scintillating fibres | 200 |
| Tile detector (2 stations) | 110 |
| Mechanics and cooling | 100 |
| DAQ pixel detector | 50 |
| DAQ fibres | 200 |
| DAQ tiles | 190 |
| Central DAQ | 100 |
| Filter farm | 50 |
| Slow control | 50 |
| Infrastructure | u.a. |
| Total | 1460 |
Appendix A Appendix
A.1 Mu3e theses
Several theses involving the Mu3e project have been completed:
-
•
M. Kiehn, diploma thesis Track Fitting with Broken Lines for the Mu3e Experiment, Heidelberg University, 2012.
-
•
M. Zimmermann, bachelor thesis Cooling with Gaseous Helium for the Mu3e Experiment, Heidelberg University, 2012.
-
•
H. Augustin, bachelor thesis Charakterisierung von HV-MAPS, Heidelberg University, 2012.
-
•
A.-K. Perrevoort, master thesis Characterisation of High Voltage Monolithic Active Pixel Sensors for the Mu3e Experiment, Heidelberg University, 2012.
These theses are available in portable document format (PDF) from http://www.psi.ch/mu3e/documents. Several more theses are ongoing (thus titles are preliminary):
-
•
R. Gredig, doctoral thesis Fibre Tracker for the Mu3e Experiment, Zürich University, started 2012.
-
•
M. Kiehn, doctoral thesis Track Reconstruction for the Mu3e Experiment, Heidelberg University, started 2012.
-
•
A. Damyanova, master thesis Fibre and SiPM characterization for the Mu3e Experiment, Geneva University, started 2012.
-
•
R. Philipp, master thesis Tests of High Voltage Monolithic Active Pixel Sensors for the Mu3e Experiment, Heidelberg University, started 2012.
A.2 Acknowledgements
N. Berger would like to thank the Deutsche Forschungsgemeinschaft (DFG) for funding his work on the Mu3e experiment through the Emmy Noether program and thus supporting the experiment at a crucial early stage.
M. Kiehn acknowledges support by the International Max Planck Research School for Precision Tests of Fundamental Symmetries.
References
- [1] Y. Fukuda et al., [Super-Kamiokande Collaboration], “Evidence for oscillation of atmospheric neutrinos”, Phys. Rev. Lett., 81 1562–1567, 1998, (arXiv:hep-ex/9807003).
- [2] Q. R. Ahmad et al., [SNO Collaboration], “Measurement of the charged current interactions produced by B-8 solar neutrinos at the Sudbury Neutrino Observatory”, Phys. Rev. Lett., 87 071301, 2001, (arXiv:nucl-ex/0106015).
- [3] K. Eguchi et al., [KamLAND Collaboration], “First results from KamLAND: Evidence for reactor anti- neutrino disappearance”, Phys. Rev. Lett., 90 021802, 2003, (arXiv:hep-ex/0212021).
- [4] J. C. Pati and A. Salam, “Lepton Number as the Fourth Color”, Phys. Rev., D10 275–289, 1974.
- [5] H. Georgi and S. L. Glashow, “Unity of All Elementary Particle Forces”, Phys. Rev. Lett., 32 438–441, 1974.
- [6] P. Langacker, “Grand Unified Theories and Proton Decay”, Phys.Rep., 72 185, 1981.
- [7] H. E. Haber and G. L. Kane, “The Search for Supersymmetry: Probing Physics Beyond the Standard Model”, Phys. Rept., 117 75, 1985.
- [8] R. N. Mohapatra and J. C. Pati, “Left-Right Gauge Symmetry and an Isoconjugate Model of CP Violation”, Phys. Rev., D11 566–571, 1975.
- [9] R. N. Mohapatra and J. C. Pati, “A Natural Left-Right Symmetry”, Phys. Rev., D11 2558, 1975.
- [10] G. Senjanovic and R. N. Mohapatra, “Exact Left-Right Symmetry and Spontaneous Violation of Parity”, Phys. Rev., D12 1502, 1975.
- [11] M. Kakizaki, Y. Ogura and F. Shima, “Lepton flavor violation in the triplet Higgs model”, Phys.Lett., B566 210–216, 2003, (arXiv:hep-ph/0304254).
- [12] C. T. Hill and E. H. Simmons, “Strong dynamics and electroweak symmetry breaking”, Phys. Rept., 381 235–402, 2003, (arXiv:hep-ph/0203079).
- [13] M. L. Brooks et al., [MEGA Collaboration], “New limit for the family-number non-conserving decay ”, Phys. Rev. Lett., 83 1521–1524, 1999, (arXiv:hep-ex/9905013).
- [14] J. Adam et al., [MEG Collaboration], “New limit on the lepton-flavour violating decay mu -> e gamma”, Phys. Rev. Lett., 107 171801, 2011, (arXiv:1107.5547 [hep-ex]).
- [15] U. Bellgardt et al., [SINDRUM Collaboration], “Search for the Decay ”, Nucl.Phys., B299 1, 1988.
- [16] W. Bertl et al., [SINDRUM II Collaboration], “A Search for conversion in muonic gold”, Eur. Phys. J., C47 337–346, 2006.
- [17] L. Calibbi, A. Faccia, A. Masiero and S.K. Vempati, “Lepton flavour violation from SUSY-GUTs: Where do we stand for MEG, PRISM/PRIME and a super flavour factory”, Phys.Rev., D74 116002, 2006, (arXiv:hep-ph/0605139).
- [18] S. Antusch, E. Arganda, M.J. Herrero and A.M. Teixeira, “Impact of theta(13) on lepton flavour violating processes within SUSY seesaw”, JHEP, 0611 090, 2006, (arXiv:hep-ph/0607263).
- [19] F.P. An et al., [Daya Bay Collaboration], “Improved Measurement of Electron Antineutrino Disappearance at Daya Bay”, 2012, (arXiv:1210.6327 [hep-ex]).
- [20] J.K. Ahn et al., [RENO collaboration], “Observation of Reactor Electron Antineutrino Disappearance in the RENO Experiment”, Phys.Rev.Lett., 108 191802, 2012, (arXiv:1204.0626 [hep-ex]).
- [21] Y. Abe et al., [Double Chooz Collaboration], “Reactor electron antineutrino disappearance in the Double Chooz experiment”, Phys.Rev., D86 052008, 2012, (arXiv:1207.6632 [hep-ex]).
- [22] K. Abe et al., [T2K Collaboration], “Indication of Electron Neutrino Appearance from an Accelerator-produced Off-axis Muon Neutrino Beam”, Phys. Rev. Lett., 107 041801, 2011, (arXiv:1106.2822 [hep-ex]).
- [23] D. Nicolo, [MEG Collaboration], “The experiment at PSI”, Nucl.Instrum.Meth., A503 287–289, 2003.
- [24] J. Adam et al., [MEG Collaboration], “A limit for the decay from the MEG experiment”, Nucl.Phys., B834 1–12, 2010, (arXiv:0908.2594 [hep-ex]).
- [25] K. Hayasaka, [Belle Collaboration], “Tau lepton physics at Belle”, Journal of Physics: Conference Series, 335(1) 012029, 2011.
- [26] K. Hayasaka et al., [Belle Collaboration], “New search for and decays at Belle”, Phys.Lett., B666 16–22, 2008, (arXiv:0705.0650 [hep-ex]).
- [27] B. Aubert et al., [BABAR Collaboration], “Searches for Lepton Flavor Violation in the Decays and ”, Phys.Rev.Lett., 104 021802, 2010, (arXiv:0908.2381 [hep-ex]).
- [28] J. P. Lees et al., [BaBar Collaboration], “Limits on tau Lepton-Flavor Violating Decays in three charged leptons”, Phys. Rev., D81 111101, 2010, (arXiv:1002.4550 [hep-ex]).
- [29] B. Aubert et al., [BaBar Collaboration], “Searches for Lepton Flavor Violation in the Decays and ”, Phys. Rev. Lett., 104 021802, 2010, (arXiv:0908.2381 [hep-ex]).
- [30] B. Aubert et al., [BaBar Collaboration], “Improved limits on lepton flavor violating tau decays to , , and ”, Phys. Rev. Lett., 103 021801, 2009, (arXiv:0904.0339 [hep-ex]).
- [31] B. Aubert et al., [BaBar Collaboration], “Search for Lepton Flavour Violating Decays with the BaBar Experiment”, Phys. Rev., D79 012004, 2009, (arXiv:0812.3804 [hep-ex]).
- [32] B. Aubert et al., [BaBar Collaboration], “Search for Lepton Flavor Violating Decays ()”, Phys. Rev. Lett., 100 071802, 2008, (arXiv:0711.0980 [hep-ex]).
- [33] B. Aubert et al., [BaBar Collaboration], “Search for Lepton Flavor Violating Decays ”, Phys. Rev. Lett., 98 061803, 2007, (arXiv:hep-ex/0610067).
- [34] K. Hayasaka et al., [Belle Collaboration], “Search for Lepton Flavor Violating Decays into Three Leptons with 719 Million Produced Pairs”, Phys. Lett., B687 139–143, 2010, (arXiv:1001.3221 [hep-ex]).
- [35] Y. Miyazaki et al., [Belle Collaboration], “Search for Lepton Flavor Violating Decays into and ”, Phys. Lett., B692 4–9, 2010, (arXiv:1003.1183 [hep-ex]).
- [36] Y. Miyazaki et al., [Belle Collaboration], “Search for Lepton Flavor and Lepton Number Violating tau Decays into a Lepton and Two Charged Mesons”, Phys. Lett., B682 355–362, 2010, (arXiv:0908.3156 [hep-ex]).
- [37] Y. Miyazaki et al., [Belle Collaboration], “Search for Lepton-Flavor-Violating tau Decays into Lepton and Meson”, Phys. Lett., B672 317–322, 2009, (arXiv:0810.3519 [hep-ex]).
- [38] Y. Miyazaki et al., [Belle Collaboration], “Search for Lepton Flavor Violating tau Decays into Three Leptons”, Phys. Lett., B660 154–160, 2008, (arXiv:0711.2189 [hep-ex]).
- [39] Y. Nishio et al., [Belle Collaboration], “Search for lepton-flavor-violating decays at Belle”, Phys. Lett., B664 35–40, 2008, (arXiv:0801.2475 [hep-ex]).
- [40] Y. Miyazaki et al., [Belle Collaboration], “Search for lepton flavor violating decays into , and ”, Phys. Lett., B648 341–350, 2007, (arXiv:hep-ex/0703009).
- [41] Y. Miyazaki et al., [Belle Collaboration], “Search for lepton flavor violating tau- decays with a meson”, Phys. Lett., B639 159–164, 2006, (arXiv:hep-ex/0605025).
- [42] T. Aushev, W. Bartel, A. Bondar, J. Brodzicka, T.E. Browder et al., “Physics at Super B Factory”, 2010, (arXiv:1002.5012 [hep-ex]).
- [43] T. Abe, [Belle II Collaboration], “Belle II Technical Design Report”, 2010, (arXiv:1011.0352 [physics.ins-det]).
- [44] M. Aoki, [DeeMe Collaboration], “An experimental search for muon-electron conversion in nuclear field at sensitivity of 10-14 with a pulsed proton beam”, AIP Conf.Proc., 1441 599–601, 2012.
- [45] R. Akhmetshin et al., [COMET Collaboration], “Experimental Proposal for Phase-I of the COMET Experiment at J-PARC”, KEK/J-PARC-PAC 2012-10, 2012.
- [46] L. Bartoszek et al., [Mu2e Collaboration], “Mu2e Conceptual Design Report”, Fermilab-TM-2545, 2012, (arXiv:1211.7019 [physics.ins-det]).
- [47] D.N. Brown, [Mu2e Collaboration], “Mu2e, a coherent mu e conversion experiment at Fermilab”, AIP Conf.Proc., 1441 596–598, 2012.
- [48] L. Randall and R. Sundrum, “A large mass hierarchy from a small extra dimension”, Phys. Rev. Lett., 83 3370, 1999.
- [49] N. Arkani-Hamed and M. Schmaltz, “Hierarchies without symmetries from extra dimensions”, Phys. Rev., D61 33005, 2000.
- [50] Y. Kuno and Y. Okada, “Muon decay and physics beyond the standard model”, Rev. Mod. Phys., 73 151–202, 2001, (arXiv:hep-ph/9909265).
- [51] J. Hisano, T. Moroi, K. Tobe and Masahiro Yamaguchi, “Lepton flavor violation via right-handed neutrino Yukawa couplings in supersymmetric standard model”, Phys.Rev., D53 2442–2459, 1996, (arXiv:hep-ph/9510309).
- [52] A. de Gouvêa, “(Charged) Lepton Flavor Violation”, Nucl. Phys B. (Proc. Suppl.), 188 303–308, 2009.
- [53] F. del Aguila, J.I. Illana and M.D. Jenkins, “Precise limits from lepton flavour violating processes on the Littlest Higgs model with T-parity”, JHEP, 0901 080, 2009, (arXiv:0811.2891 [hep-ph]).
- [54] F. del Aguila, J. I. Illana and M. D. Jenkins, “Lepton flavor violation in the Simplest Little Higgs model”, JHEP, 1103 080, 2011, (arXiv:1101.2936 [hep-ph]).
- [55] E. Arganda and M. J. Herrero, “Testing supersymmetry with lepton flavor violating tau and mu decays”, Phys.Rev., D73 055003, 2006, (arXiv:hep-ph/0510405).
- [56] M. Hirsch, F. Staub and A. Vicente, “Enhancing with the -penguin”, Phys.Rev., D85 113013, 2012, (arXiv:1202.1825 [hep-ph]).
- [57] H.K. Dreiner, K. Nickel, F. Staub and A. Vicente, “New bounds on trilinear R-parity violation from lepton flavor violating observables”, Phys.Rev., D86 015003, 2012, (arXiv:1204.5925 [hep-ph]).
- [58] A. Abada, D. Das, A. Vicente and C. Weiland, “Enhancing lepton flavour violation in the supersymmetric inverse seesaw beyond the dipole contribution”, JHEP, 1209 015, 2012, (arXiv:1206.6497 [hep-ph, reportNumber = LPT-ORSAY-12-36]).
- [59] M. Hirsch, W. Porod, L. Reichert and F. Staub, “Phenomenology of the minimal supersymmetric extension of the standard model”, Phys.Rev., D86 093018, 2012, (arXiv:1206.3516 [hep-ph]).
- [60] G. Aad et al., [ATLAS Collaboration], “Search for pair-produced massive coloured scalars in four-jet final states with the ATLAS detector in proton-proton collisions at sqrt(s) = 7 TeV”, 2012, (arXiv:1210.4826 [hep-ex]).
- [61] G. Aad et al., [ATLAS Collaboration], “Search for pair production of massive particles decaying into three quarks with the ATLAS detector in sqrt(s) = 7 TeV pp collisions at the LHC”, 2012, (arXiv:1210.4813 [hep-ex]).
- [62] G. Aad et al., [ATLAS Collaboration], “Search for R-parity-violating supersymmetry in events with four or more leptons in sqrt(s) = 7 TeV pp collisions with the ATLAS detector”, 2012, (arXiv:1210.4457 [hep-ex]).
- [63] G. Aad et al., [ATLAS Collaboration], “Search for direct chargino production in anomaly-mediated supersymmetry breaking models based on a disappearing-track signature in pp collisions at sqrt(s)=7 TeV with the ATLAS detector”, 2012, (arXiv:1210.2852 [hep-ex]).
- [64] G. Aad et al., [The ATLAS Collaboration], “Search for Supersymmetry in Events with Large Missing Transverse Momentum, Jets, and at Least One Tau Lepton in 7 TeV Proton-Proton Collision Data with the ATLAS Detector”, 2012, (arXiv:1210.1314 [hep-ex]).
- [65] G. Aad et al., [ATLAS Collaboration], “Search for a heavy top-quark partner in final states with two leptons with the ATLAS detector at the LHC”, 2012, (arXiv:1209.4186 [hep-ex]).
- [66] G. Aad et al., [ATLAS Collaboration], “Search for light top squark pair production in final states with leptons and b-jets with the ATLAS detector in sqrt(s) = 7 TeV proton-proton collisions”, 2012, (arXiv:1209.2102 [hep-ex]).
- [67] G. Aad et al., [ATLAS Collaboration], “Search for diphoton events with large missing transverse momentum in 7 TeV proton-proton collision data with the ATLAS detector”, 2012, (arXiv:1209.0753 [hep-ex]).
- [68] G. Aad et al., [ATLAS Collaboration], “Further search for supersymmetry at sqrt(s) = 7 TeV in final states with jets, missing transverse momentum and isolated leptons with the ATLAS detector”, 2012, (arXiv:1208.4688 [hep-ex]).
- [69] G. Aad et al., [ATLAS Collaboration], “Search for light scalar top quark pair production in final states with two leptons with the ATLAS detector in sqrt(s) = 7 TeV proton-proton collisions”, 2012, (arXiv:1208.4305 [hep-ex]).
- [70] G. Aad et al., [ATLAS Collaboration], “Search for direct production of charginos and neutralinos in events with three leptons and missing transverse momentum in sqrt(s) = 7 TeV pp collisions with the ATLAS detector”, 2012, (arXiv:1208.3144 [hep-ex]).
- [71] G. Aad et al., [ATLAS Collaboration], “Search for direct slepton and gaugino production in final states with two leptons and missing transverse momentum with the ATLAS detector in pp collisions at sqrt(s) = 7 TeV”, 2012, (arXiv:1208.2884 [hep-ex]).
- [72] G. Aad et al., [ATLAS Collaboration], “Search for direct top squark pair production in final states with one isolated lepton, jets, and missing transverse momentum in sqrt(s) = 7 TeV pp collisions using 4.7 fb-1 of ATLAS data”, 2012, (arXiv:1208.2590 [hep-ex]).
- [73] G. Aad et al., [ATLAS Collaboration], “Search for squarks and gluinos with the ATLAS detector in final states with jets and missing transverse momentum using 4.7 fb of sqrt(s) = 7 TeV proton-proton collision data”, 2012, (arXiv:1208.0949 [hep-ex]).
- [74] G. Aad et al., [ATLAS Collaboration], “Search for top and bottom squarks from gluino pair production in final states with missing transverse energy and at least three b-jets with the ATLAS detector”, 2012, (arXiv:1207.4686 [hep-ex]).
- [75] G. Aad et al., [ATLAS Collaboration], “Hunt for new phenomena using large jet multiplicities and missing transverse momentum with ATLAS in 4.7 fb of sqrt(s) = 7 TeV proton-proton collisions”, JHEP, 1207 167, 2012, (arXiv:1206.1760 [hep-ex]).
- [76] S. Chatrchyan et al., [CMS Collaboration], “Search for supersymmetry in events with photons and low missing transverse energy in pp collisions at sqrt(s) = 7 TeV”, 2012, (arXiv:1210.2052 [hep-ex]).
- [77] S. Chatrchyan et al., [CMS Collaboration], “Search for electroweak production of charginos and neutralinos using leptonic final states in pp collisions at sqrt(s) = 7 TeV”, 2012, (arXiv:1209.6620 [hep-ex]).
- [78] S. Chatrchyan et al., [CMS Collaboration], “Search for supersymmetry in hadronic final states using MT2 in collisions at TeV”, JHEP, 1210 018, 2012, (arXiv:1207.1798 [hep-ex]).
- [79] S. Chatrchyan et al., [CMS Collaboration], “Search for new physics in the multijet and missing transverse momentum final state in proton-proton collisions at TeV”, 2012, (arXiv:1207.1898 [hep-ex]).
- [80] S. Chatrchyan et al., [CMS Collaboration], “Search for new physics in events with opposite-sign leptons, jets, and missing transverse energy in pp collisions at sqrt(s) = 7 TeV”, 2012, (arXiv:1206.3949 [hep-ex]).
- [81] S. Chatrchyan et al., [CMS Collaboration], “Search for new physics with same-sign isolated dilepton events with jets and missing transverse energy”, Phys.Rev.Lett., 109 071803, 2012, (arXiv:1205.6615 [hep-ex]).
- [82] S. Chatrchyan et al., [CMS Collaboration], “Search for new physics in events with same-sign dileptons and b-tagged jets in pp collisions at sqrt(s) = 7 TeV”, JHEP, 1208 110, 2012, (arXiv:1205.3933 [hep-ex]).
- [83] S. Chatrchyan et al., [CMS Collaboration], “Search for anomalous production of multilepton events in pp collisions at sqrt(s)=7 TeV”, JHEP, 1206 169, 2012, (arXiv:1204.5341 [hep-ex]).
- [84] S. Chatrchyan et al., [CMS Collaboration], “Search for physics beyond the standard model in events with a Z boson, jets, and missing transverse energy in pp collisions at sqrt(s) = 7 TeV”, Phys.Lett., B716 260–284, 2012, (arXiv:1204.3774 [hep-ex]).
- [85] R.N. Mohapatra and J.W.F. Valle, “Neutrino Mass and Baryon Number Nonconservation in Superstring Models”, Phys.Rev., D34 1642, 1986.
- [86] M. Malinsky, J.C. Romao and J.W.F. Valle, “Novel supersymmetric SO(10) seesaw mechanism”, Phys.Rev.Lett., 95 161801, 2005, (arXiv:hep-ph/0506296).
- [87] V. De Romeri, M. Hirsch and M. Malinsky, “Soft masses in SUSY SO(10) GUTs with low intermediate scales”, Phys.Rev., D84 053012, 2011, (arXiv:1107.3412 [hep-ph]).
- [88] M. Blanke, A. J. Buras, B. Duling, A. Poschenrieder and C. Tarantino, “Charged Lepton Flavour Violation and (g-2)(mu) in the Littlest Higgs Model with T-Parity: A Clear Distinction from Supersymmetry”, JHEP, 0705 013, 2007, (arXiv:hep-ph/0702136).
- [89] M. Blanke, A. J. Buras, B. Duling, S. Recksiegel and C Tarantino, “FCNC Processes in the Littlest Higgs Model with T-Parity: a 2009 Look”, Acta Phys. Polon., B41 657–683, 2010, (arXiv:0906.5454 [hep-ph]).
- [90] W.F. Chang and J. N. Ng, “Lepton flavor violation in extra dimension models”, Phys.Rev., D71 053003, 2005, (arXiv:hep-ph/0501161).
- [91] S. Casagrande, F. Goertz, U. Haisch, M. Neubert and T. Pfoh, “Flavor Physics in the Randall-Sundrum Model: I. Theoretical Setup and Electroweak Precision Tests”, JHEP, 10 094, 2008, (arXiv:0807.4937 [hep-ph]).
- [92] M. S. Carena, A. Delgado, E. Ponton, T. M. P. Tait and C. E. M. Wagner, “Precision electroweak data and unification of couplings in warped extra dimensions”, Phys. Rev., D68 035010, 2003, (arXiv:hep-ph/0305188).
- [93] A. Delgado and A. Falkowski, “Electroweak observables in a general 5D background”, JHEP, 05 097, 2007, (arXiv:hep-ph/0702234).
- [94] W. Bertl, SINDRUM I, Presentation at PSI, 2008.
- [95] Y. Amhis et al., [Heavy Flavor Averaging Group], “Averages of b-hadron, c-hadron, and tau-lepton properties as of early 2012”, 2012, (arXiv:1207.1158 [hep-ex]).
- [96] M. Bona et al., [SuperB Collaboration], “SuperB: A High-Luminosity Asymmetric e+ e- Super Flavor Factory. Conceptual Design Report”, 2007, (arXiv:0709.0451 [hep-ex]).
- [97] J. Kaulard et al., [SINDRUM II Collaboration], “Improved limit on the branching ratio of conversion on titanium”, Phys.Lett., B422 334–338, 1998.
- [98] C. Dohmen et al., [SINDRUM II Collaboration], “Test of lepton flavor conservation in conversion on titanium”, Phys. Lett., B317 631–636, 1993.
- [99] R.M. Carey et al., [Mu2e Collaboration], “Proposal to search for with a single event sensitivity below ”, 2008, Spokespersons: J.P. Miller, R.H. Bernstein.
- [100] R. Tschirhart, “The Mu2e experiment at Fermilab”, Nucl.Phys.Proc.Suppl., 210-211 245–248, 2011.
- [101] Y.G. Cui et al., [COMET Collaboration], “Conceptual design report for experimental search for lepton flavor violating mu- - e- conversion at sensitivity of with a slow-extracted bunched proton beam (COMET)”, 2009.
- [102] Y. Kuno, [COMET Collaboration], “Search for muon to electron conversion at J-PARC: COMET”, PoS, ICHEP2010 526, 2010.
- [103] Y. Kuno, “Lepton flavor violation: Muon to electron conversion, COMET and PRISM/PRIME at J-PARC”, PoS, NUFACT08 111, 2008.
- [104] J. Pasternak, L. Jenner, Y. Uchida, R. Barlow, K. Hock et al., “Accelerator and Particle Physics Research for the Next Generation Muon to Electron Conversion Experiment - the PRISM Task Force”, WEPE056, 2010.
- [105] A. Yamamoto, M.Y. Yoshida, T. Ogitsu, Y. Mori, Y. Kuno et al., “MuSIC, the World’s Highest Intensity DC Muon Beam using a Pion Capture System”, Conf.Proc., C110904 820–822, 2011.
- [106] T. Ogitsu, A. Yamamoto, M.Y. Yoshida, Y. Kuno, H. Sakamoto et al., “A New Continuous Muon Beam Line Using a Highly Efficient Pion Capture System at RCNP”, Conf.Proc., C110328 856–858, 2011.
- [107] The LHCb collaboration, Search for the lepton flavour violating decay , In Flavor Physics and CP Violation 2012 (FPCP 2012), 2012, LHCb-CONF-2012-015.
- [108] P. Seyfert, “Searches for Lepton Flavour Violation and Lepton Number Violation in Hadron Decays”, 2012, (arXiv:1209.4939 [hep-ex]).
- [109] R. Akers et al., [OPAL Collaboration], “A Search for lepton flavor violating decays”, Z.Phys., C67 555–564, 1995.
- [110] P. Abreu et al., [DELPHI Collaboration], “Search for lepton flavor number violating decays”, Z.Phys., C73 243–251, 1997.
- [111] O. Adriani et al., [L3 Collaboration], “Search for lepton flavor violation in decays”, Phys.Lett., B316 427–434, 1993.
- [112] D. Decamp et al., [ALEPH Collaboration], “Searches for new particles in decays using the ALEPH detector”, Phys.Rept., 216 253–340, 1992.
- [113] S. Davidson, S. Lacroix and P. Verdier, “LHC sensitivity to lepton flavour violating Z boson decays”, 2012, (arXiv:1207.4894 [hep-ph]).
- [114] G. Aad et al., [ATLAS Collaboration], “Observation of a new particle in the search for the Standard Model Higgs boson with the ATLAS detector at the LHC”, 2012, (arXiv:1207.7214 [hep-ex]).
- [115] S. Chatrchyan et al., [CMS Collaboration], “Observation of a new boson at a mass of 125 GeV with the CMS experiment at the LHC”, Phys.Lett.B, 2012, (arXiv:1207.7235 [hep-ex]).
- [116] R. M. Djilkibaev and R. V. Konoplich, “Rare Muon Decay ”, Phys.Rev., D79 073004, 2009, (arXiv:0812.1355 [hep-ph]).
- [117] K. Nakamura et al., [Particle Data Group], “Review of particle physics”, J. Phys., G37 075021, 2010.
- [118] P.-R. Kettle, PSI-internal, LTP Filzbach Meeting, June 2010.
- [119] A.E. Pifer, T. Bowen and K.R. Kendall, “A High Stopping Density mu+ Beam”, Nucl.Instrum.Meth., 135 39–46, 1976.
- [120] G.S. Bauer, Y. Dai and W. Wagner, “SINQ layout, operation, applications and R&D to high power”, J. Phys. IV France, 12(8) 3–26, 2002.
- [121] J. F. Crawford et al., “Production of low energy pions by 590 MeV protons on nuclei”, Helvetica Physica Acta, 53 497–505, 1980.
- [122] J.F. Crawford et al., “Measurement of cross sections and asymmetry parameters for the production of charged pions from various nuclei by 585-MeV protons”, Phys. Rev. C, 22 1184–1196, 1980.
- [123] J. Brzezniak, R.W. Fast, Kurt J. Krempetz, A. Kristalinski, A. Lee et al., “Conceptual design of a 2-Tesla superconducting solenoid for the Fermilab D0 detector upgrade”, 1994, FERMILAB-TM-1886.
- [124] S. Agostinelli et al., “Geant4–a simulation toolkit”, Nucl. Instr. Meth., A 506(3) 250 – 303, 2003.
- [125] W. Erdmann, W. Bertl, R. Horisberger, H.C. Kastli, D. Kotlinski et al., “Upgrade plans for the CMS pixel barrel detector”, Nucl.Instrum.Meth., A617 534–537, 2010.
- [126] C. Grab, A Search for the Decay , PhD thesis, Universität Zürich, 1985.
- [127] I. Peric, “A novel monolithic pixelated particle detector implemented in high-voltage CMOS technology”, Nucl.Instrum.Meth., A582 876–885, 2007.
- [128] I. Peric and C. Takacs, “Large monolithic particle pixel-detector in high-voltage CMOS technology”, Nucl. Instrum. Meth., A624(2) 504 – 508, 2010, New Developments in Radiation Detectors - ”Proceedings of the 11th European Symposium on Semiconductor Detectors, 11th European Symposium on Semiconductor Detectors”.
- [129] I. Peric, C. Kreidl and P. Fischer, “Particle pixel detectors in high-voltage CMOS technology - New achievements”, Nucl. Instr. Meth., A 650(1) 158 – 162, 2011, International Workshop on Semiconductor Pixel Detectors for Particles and Imaging 2010.
- [130] I. Peric, Private communication, 2010.
- [131] IBM Corporation, IBM CMOS 7 HV, 2012, TGD03019USEN.
- [132] Institute of Electrical and Electronics Engineers, IEEE 1149.1: Standard Test Access Port and Boundary Scan Architecture, 2001.
- [133] A.-K. Perrevoort, Characterisation of HighVoltage MonolithicActive Pixel Sensors for the Mu3e Experiment, Master’s thesis, Heidelberg University, 2012.
- [134] H. Augustin, Charakterisierung von HV-MAPS, Bachelor thesis, Heidelberg University, 2012.
- [135] K. Akiba, M. Artuso, R. Badman, A. Borgia, R. Bates et al., “Charged Particle Tracking with the Timepix ASIC”, Nucl.Instrum.Meth., A661 31–49, 2012, (arXiv:1103.2739 [physics.ins-det]).
- [136] M. Zimmermann, Cooling with Gaseous Helium for the Mu3e Experiment, Bachelor thesis, Heidelberg University, 2012.
- [137] G. Dellacasa et al., [ALICE Collaboration], “ALICE: Technical design report of the time projection chamber”, 2000.
- [138] A. Boyarski, D. Briggs and P. Burchat, “Studies of helium based drift chamber gases for high luminosity low-energy machines”, Nucl.Instrum.Meth., A323 267–272, 1992.
- [139] F. V. Böhmer, M. Ball, S. Dørheim, C. Höppner, B. Ketzer, I. Konorov, S. Neubert, S. Paul, J. Rauch and M. Vandenbroucke, “Space-Charge Effects in an Ungated GEM-based TPC”, ArXiv e-prints, September 2012, (arXiv:1209.0482 [physics.ins-det]).
- [140] S. Margetis, [STAR Collaboration], “Heavy Flavor Tracker (HFT): The new silicon vertex detector for the STAR experiment at RHIC”, Nucl.Phys.Proc.Suppl., 210-211 227–230, 2011.
- [141] I. Valin, C. Hu-Guo, J. Baudot, G. Bertolone, A. Besson et al., “A reticle size CMOS pixel sensor dedicated to the STAR HFT”, JINST, 7 C01102, 2012.
- [142] L. Greiner, A MAPS based pixel vertex detector for the STAR experiment, In VERTEX, 2012.
- [143] C. Kreidl, Belle tracker upgrade, In VERTEX, 2012.
- [144] M. van Beuzekom, VeloPix ASIC development for the LHCb VELO upgrade, In PIXEL, 2012.
- [145] P. Abbon et al., [COMPASS Collaboration], “The COMPASS experiment at CERN”, Nucl.Instrum.Meth., A577 455–518, 2007, (arXiv:hep-ex/0703049).
- [146] B. Beischer et al., “A high-resolution scintillating fiber tracker with silicon photomultiplier array readout”, Nucl.Instrum.Meth., A622 542–554, 2010, (arXiv:1011.0226 [physics.ins-det]).
- [147] B. Beischer et al., “The development of a high-resolution scintillating fiber tracker with silicon photomultiplier readout”, Nucl.Instrum.Meth., A628 403–406, 2011.
- [148] P. Eckert, R. Stamen and H.C. Schultz-Coulon, “Study of the response and photon-counting resolution of silicon photomultipliers using a generic simulation framework”, JINST, 7 P08011, 2012, (arXiv:1206.4154 [physics.ins-det]).
- [149] J.Y. Wu and Z.H. Shi, “The 10-ps wave union TDC: Improving FPGA TDC resolution beyond its cell delay”, 2008.
- [150] P. Pütsch, Transmission Line Evaluation and Prototype Test of the Data Handling Processor Readout Chip for the Belle II DEPFET Pixel Detector, Master thesis, Bonn University, 2011.
- [151] F Vasey, D Hall, T Huffman, S Kwan, A Prosser, C Soos, J Troska, T Weidberg, A Xiang and J Ye, “The Versatile Link common project: feasibility report”, JINST, 7(01) C01075, 2012.
- [152] J. Troska, Technical Specification VERSATILE TRANSCEIVER (a.k.a CERN SFP+, VTRx, VTTx), CMS Document 4802-v2, 2012.
- [153] S. Swientek, Upgrade der Backend-Ausleseelektronik für den LHCb Outer Tracker, In DPG Spring Meeting, 2012.
- [154] G. Haefeli, A. Bay, A. Gong, H. Gong, M. Muecke et al., “The LHCb DAQ interface board TELL1”, Nucl.Instrum.Meth., A560 494–502, 2006.
- [155] Wolfgang Kühn et al., [PANDA Collaboration], “FPGA based compute nodes for high level triggering in PANDA”, J.Phys.Conf.Ser., 119 022027, 2008.
-
[156]
K. Olchanski S. Ritt, P. Amaudruz, Maximum Integration Data Acquisition
System, 2001,
http://midas.psi.ch. - [157] K. Abe et al., [T2K Collaboration], “The T2K Experiment”, Nucl.Instrum.Meth., A659 106–135, 2011, (arXiv:1106.1238 [physics.ins-det]).
- [158] L.M. Brarkov et al., “Search for down to branching ratio”, Research Proposal to PSI, 1999.
-
[159]
R. Schmidt S. Ritt, MSCB (MIDAS Slow Control Bus), 2001,
http://midas.psi.ch/mscb. -
[160]
EPICS (Experimental Physics and Industrial Control System),
http://www.aps.anl.gov/epics. - [161] Xilinx Coropration, VC707 Evaluation Board for the Virtex-7 FPGA - User Guide, 1.1 edition, 2012.
- [162] Altera Coropration, Stratix IV GX FPGA Development Kit - User Guide, 9.1.0 edition, 2010.
- [163] Altera Coropration, Stratix IV GX FPGA Development Board - Refernce Manual, 9.1.0 edition, 2012.
- [164] D. Wiedner et al., Prototype IF14-1 for an Optical 12 input Receiver Card for the LHCb TELL1 Board, 2004, LHCb-2004-072.
- [165] NVIDIA Corporation, NVIDIA GeForce GTX 680, 2012, Whitepaper.
- [166] AMD Corporation, AMD Graphics Cores Next (GCN) Architecture, 2012, Whitepaper.
- [167] J. Allison, K. Amako, J. Apostolakis, H. Araujo, P.A. Dubois et al., “Geant4 developments and applications”, IEEE Trans. Nucl. Sci., 53 270, 2006.
- [168] L. Urbán, A model for multiple scattering in GEANT4. oai:cds.cern.ch:1004190, Technical Report CERN-OPEN-2006-077, CERN, Geneva, Dec 2006.
- [169] F. Scheck, “Muon Physics”, Phys.Rept., 44 187, 1978.
- [170] W.E. Fischer and F. Scheck, “Electron Polarization in Polarized Muon Decay: Radiative Corrections”, Nucl.Phys., B83 25, 1974.
- [171] P. Depommier and A. Vacheret, Radiative muon decay, Technical report, TWIST Technote No 55, 2001.
- [172] C. Fronsdal and H. Uberall, “mu-Meson Decay with Inner Bremsstrahlung”, Phys.Rev., 113 654–657, 1959.
- [173] R. Kleiss, W.J. Stirling and S.D. Ellis, “A new Monte Carlo treatment of multiparticle phase space at high energies”, Comp. Phys. Commun., 40 359 – 373, 1986.
- [174] V. Karimäki, “Effective circle fitting for particle trajectories”, Nucl. Instr. and Meth., A305 187, 1991.
- [175] V. Blobel, C. Kleinwort and F. Meier, “Fast alignment of a complex tracking detector using advanced track models”, Comput.Phys.Commun., 182 1760–1763, 2011, (arXiv:1103.3909 [physics.ins-det]).
- [176] C. Kleinwort, “General Broken Lines as advanced track fitting method”, 2012, (arXiv:1201.4320 [physics.ins-det]).
- [177] A. Schöning, A Fast 3-Dimensional Track Fit with Multiple Scattering, Talk given at the Mu3e Collaboration meeting, Internal note Physikalisches Institut, Ruprecht-Karls-Universität Heidelberg, October 2012.
- [178] M. Kiehn, Track Fitting with Broken Lines for the MU3E Experiment, Diploma thesis, Heidelberg University, 2012.
- [179] M. Kiehn, Track reconstruction for the Mu3e experiment, PhD thesis, Heidelberg University, In preparation.
- [180] A. Schöning, RECOPIX, A Fast Track Reconstrcution based on Multiple Scattering Fits, Talk given at the Mu3e Collaboration meeting, November 2012.