Study of Neutron-Capture Element Abundances in Metal-Poor Stars
Abstract
This work describes a study of elemental abundances for 30 metal-poor stars whose chemical abundances provide excellent information for setting constraints on models of neutron-capture processes. Based on the abundances of main r- and weak r-process stars, the abundance patterns of main r-process and weak r-process are obtained. The two r-process component coefficients are defined to determine the relative contributions from individual neutron-capture process to abundances of metal-poor stars. Based on the component coefficients, we find that metal-poor stars BD+4 2621 and HD 4306 are also weak r-process stars, which means that the abundance pattern produced by weak r-process is stable. All metal-poor star abundances contain the contributions of both main r-process and weak r-process. The elements produced by weak r-process have increased along with Fe over the polluted history. Most of the metal-poor star abundances do not follow the pattern observed in solar system, but there is a small fraction that do. For the low-[Sr/Fe] star BD-18 5550 ([Sr/Fe]), neutron-capture element abundances can be explained by the mixture of two r-process components. Since lighter elements in this star cannot be fitted by the two components, the abundance pattern of P-component is estimated from those abundances.
1 Introduction
There are two distinct neutron-capture processes responsible for the generation of the elements heavier than the Fe peak elements: the slow neutron-capture process (the s-process) and the rapid neutron-capture process (the r-process) (Burbidge et al., 1957). The s-process is further divided into two categories: the weak s-component and the main s-component. Massive stars are sites of the weak component of s-process nucleosynthesis, which is mainly responsible for the production of lighter neutron-capture elements (e.g. Sr, Y, and Zr) (Lamb et al., 1977; Raiteri et al., 1991, 1993; The et al., 2000). The s-process contribution to heavier neutron-capture elements (heavier than Ba) is due only to the main s-component. The low- to intermediate-mass (1.38) stars in the asymptotic giant branch (AGB) are usually considered to be sites in which the main s-process occur (Busso et al., 1999). Arlandini et al. (1999) derived the “residual r-process abundances” for the solar system by subtracting the s-process abundances from the total abundances in the solar system. There is abundant evidence suggesting that Type II supernovae (SNe II) are sites for the synthesis of the r-process nuclei, although this has not yet been fully confirmed (Cowan et al., 1991; Sneden et al., 2008). The observations and analysis on very metal-poor stars imply that the stars with [Fe/H] might form from gas clouds polluted by a few supernovae (SNe) (McWilliam et al., 1995a, b; Ryan et al., 1996). Therefore, the abundances of heavy elements in metal-poor stars have been used to learn about the nature of the nucleosynthetic processes in the early Galaxy.
Because of the large overabundance of heavier neutron-capture elements (Z) relative to iron ([Eu/Fe]), two very metal-poor halo stars CS 22892-052 and CS 31082-001 ([Fe/H]) merit special attention. It is surprising that the abundance patterns of the heavier neutron-capture elements in these two “main r-process stars” match the solar-system r-process pattern very closely (e.g., Cowan et al. (1999); Truran et al. (2002); Wanajo & Ishimaru (2006); Sneden et al. (2008)). However, their lighter neutron-capture elements (, i.e., from Rb to Ag) are too deficient to agree entirely with the solar-system’s residual r-process pattern (e.g., Sneden et al. (2000); Hill et al. (2002)). This implies that the r-process abundances of solar-system for lighter neutron-capture elements, such as Sr, Y and Zr, are not explained entirely by main r-process, but that another process, referred to as the “lighter element primary process” (LEPP) (Travaglio et al., 2004) or “weak r-process” (Ishimaru et al., 2005), is required. By comparison, the abundance pattern of metal-poor stars HD 122563 and HD 88609 is obviously different from the pattern observed in CS 22892-052 and CS 31082-001. The abundances of HD 122563 and HD 88609 show excess of lighter neutron-capture elements and deficiency of heavier neutron-capture elements (Westin et al., 2000; Johnson, 2002; Honda et al., 2007). Recently, the weak r-process (or LEPP) abundances have been further investigated by many authors (e.g., Montes et al. (2007); Izutani et al. (2009)). Based on spherically symmetric supernova simulations, Arcones & Montes (2011) performed nucleosynthesis calculations and found that LEPP (or weak r-process) abundances can be synthesized under realistic conditions during the neutrino-wind phase. Furthermore, heavier r-process elements can not be produced under the conditions.
For the weak r-process stars HD 122563 and HD 88609, the ratios of [Sr/Fe] and [Eu/Fe] mean that weak r-process elements are produced in conjunction with the Fe and light elements rather than with heavier r-process elements. Montes et al. (2007) analyzed the observed abundances of metal-poor stars with different [Sr/Eu] ratios and concluded that the weak r-process produces a uniform and unique abundance pattern of neutron-capture elements. In addition, the analysis of Qian & Wasserburg (2007) show that the main r-process elements are not produced in conjunction with light elements and iron group elements. This means that the light elements and iron group elements in the two main r-process stars (CS 22892-052 and CS 31082-001) should have other astrophysical origins. Obviously, the observed abundances of heavy elements in most metal-poor stars cannot be explained by the abundances produced by a single nucleosynthetic process. The yield ratios of “high” frequency (H) and “low” frequency (L) components have been obtained by Qian & Wasserburg (2007) from the abundances of a main r-process star (CS 22892-052) and weak r-process star (HD 122563), respectively. Qian & Wasserburg (2008) found the two components were not enough to explain the phenomenon of a great shortfall of Sr relative to Fe in many stars with [Fe/H]. They presented a third component related to hypernovae (HNe) from progenitors of 25-50.
A quantitative understanding of the astrophysical contributions of neutron-capture elements to the Galaxy has so far been a challenging problem (Sneden et al., 2008). In order to better understand the origins of neutron-capture elements in the Galaxy, one must separate main r- and weak r-process contributions to the abundances observed in the metal-poor stars. Although various models and methods have been suggested to determine whether or not heavy element abundance patterns in the stars are identical to the distributions in the solar-system material, there is not yet a valid method to determine the relative contributions from the individual process to the lighter neutron-capture elements and heavier neutron-capture elements. Obviously, more detailed studies of metal-poor stars are needed to make progress in our understanding of the contributions from individual neutron-capture process with various metallicities. These reasons motivated us to start abundance study of the metal-poor stars, in which light elements (, i.e., from O to Ca), iron group elements (, i.e., from Sc to Zn), lighter neutron-capture elements (, i.e., from Sr to Ag) and heavier neutron-capture elements (, i.e., heavier than Ba) are observed.
In this article, we fit observed abundances of 30 metal-poor stars to derive the relative contributions from the individual r-process to their elemental abundances. An abundance decomposition approach of the stars is described in Section 2. The calculated results and their physical meanings are presented in Section 3. Our conclusions are given in Section 4.
2 Abundance Distribution Approach of The Stars
One of our major goals is to calculate the relative contribution of the individual neutron-capture process to the elemental abundances of metal-poor stars. We will start by exploring the origin of the neutron-capture elements in the stars by comparing the observed abundances with the predicted main r- and weak r-process contributions. For this purpose, we propose that the abundance for the th element in a star can be calculated by the equation:
| (1) |
where and are the abundances of the th element produced by the main r-process and weak r-process, respectively, which are normalized to [Fe/H]=0. and are the corresponding component coefficients. Using component coefficients, we can determine the relative contributions of each process to the elemental abundances and then compare them with the corresponding component coefficients of the solar system (or [Fe/H]=0), in which .
2.1 Two r-process Components
It is usually assumed that the weak r-process and main r-process occur in explosive environments such as some regions inside core-collapse SNe. There are two possible routes leading to a core-collapse SN: one is collapse of an Fe core produced by progenitors of , in which both light elements and iron group elements are produced; the other is collapse of an O-Ne-Mg core produced by progenitors of , in which the light elements and iron group elements are not produced. The abundances in the weak r-process stars HD 122563 and HD 88609 are important to constrain the weak r-process, since they have the smallest contribution from the main r-process ([Eu/Fe]) and excess of the lighter neutron-capture elements Sr, Y, Zr. The abundances of both lighter neutron-capture and light elements in weak r-process stars should reveal the composition of the cloud polluted mainly by the weak r-process event. For normal metal-poor stars, the mean value of [Eu/Fe] (Fields et al., 2002) has been identified, which means that the abundance of Eu is moderately enhanced in the interstellar medium (ISM). In a cloud polluted by the weak r-process event, the ratio of [Eu/Fe] for weak r-process stars means that the ratio of [Eu/Fe] had changed from 0.3 to -0.5 due to pollution by weak r-process events, which implies that the production of iron group and other light elements is decoupled from that of heavier r-process elements, such as Eu. However, [Sr/Fe] observed in the weak r-process stars implies that, although Fe and light elements (synthesized in progenitor of SN II) are not produced by weak r-process nucleosynthesis, they are ejected with the weak r-process elements produced in the SN II. This also implies that, although light and iron group elements are not produced by weak r-process nucleosynthesis, both iron group elements and the weak r-process elements in the weak r-process stars mainly come from a single polluted event. So, the light elements, iron group elements and weak r-process elements can be combined as one component. Because the main r-process elements are not produced in conjunction with light elements and iron group elements (Qian & Wasserburg, 2007), the abundances of main r-process stars (CS 22892-052 and CS 31082-001) could be explained by stellar formation in a molecular cloud that had first been polluted with weak r-process material, and then polluted by main r-process material.
We take the average abundances in metal-poor stars HD 122563 and HD 88609 as a representative of the abundance distribution produced mainly by the weak r-process. For the abundance distribution dominated by the main r-process, we take the average abundances of neutron-capture elements in metal-poor stars CS 22892-052 and CS 31082-001. In order to derive the pure weak r- and main r-components, firstly, we can obtain the first order approximation of the weak r-process abundance pattern by subtracting the average abundances of CS 22892-052 and CS 31082-001 from the average abundance of HD 122563 and HD 88609. To remove the effect of metallicity and gas mixing during the star formation, the abundance patterns are scaled by the average Eu abundance of HD 122563 and HD 88609. Then, we derive the first order approximation of the main r-process abundance pattern by subtracting the first order approximation of the weak r-process abundance pattern from the average abundance of CS 22892-052 and CS 31082-001, normalized to Fe. Repeating above steps, we can derive the pure weak r- and pure main r-components until the difference between the th-order approximation and the th-order approximation are smaller than the observational errors. This method has been simply described in Li et al. (2012). Note that, the weak r-process abundance pattern includes light elements and iron group elements. Although they are not produced by weak r-process nucleosynthesis, the inclusion of the abundances of light and iron group elements in the weak r-component means that the light and iron group elements (synthesized in progenitor of SN II as primary-like yields) are ejected with the weak r-process elements (produced in the SN II).
To compare main r-process and weak r-process abundance patterns derived from the metal-poor stars with the r-process abundances of solar-system, we use the main r-process and weak r-process abundance patterns to fit solar-system r-process abundances. We adopt solar-system r-process abundances from Arlandini et al. (1999) and Travaglio et al. (2004)(for Sr-Nb). We find that the abundance of Ag cannot be fitted. The solar r-process abundance of Ag (Arlandini et al., 1999) is about three times the sum of and . Since Ag is mainly an r-process element (about 80%), one possible explanation is the uncertainty of non-local thermodynamic equilibrium (NLTE) effects in the abundance analysis of the metal-poor giant stars (Hansen et al., 2012). The mixture of two r-process abundances matches well the abundances of solar r-process (with the minimum =0.56), except for Ag. In this case, the main and weak r-process abundances have been normalized to solar-system r-process abundances and the normalized abundances of and in equation (1) have been obtained. The abundances of and are listed in Table 1. It is noteworthy that there are some discrepancies between the solar r-process abundances and the sum of and . For example, the solar r-process abundance of Sr is about a factor of 0.83 smaller than the sum of and , but still within 1 of the error bar. To determine the main r-process abundances and weak r-process abundances, the observational abundances of metal-poor stars are used. So, the observational uncertainties (0.10.3dex) are contained in the derived two r-process abundances. Furthermore, the determination of the solar r-process abundances suffers from the uncertainties in predicting the s-process contributions and the abundance uncertainties of the solar system. Considering the uncertainties mentioned above, the discrepancies between the sum of the two r-process abundances and solar r-process abundances would be explained.
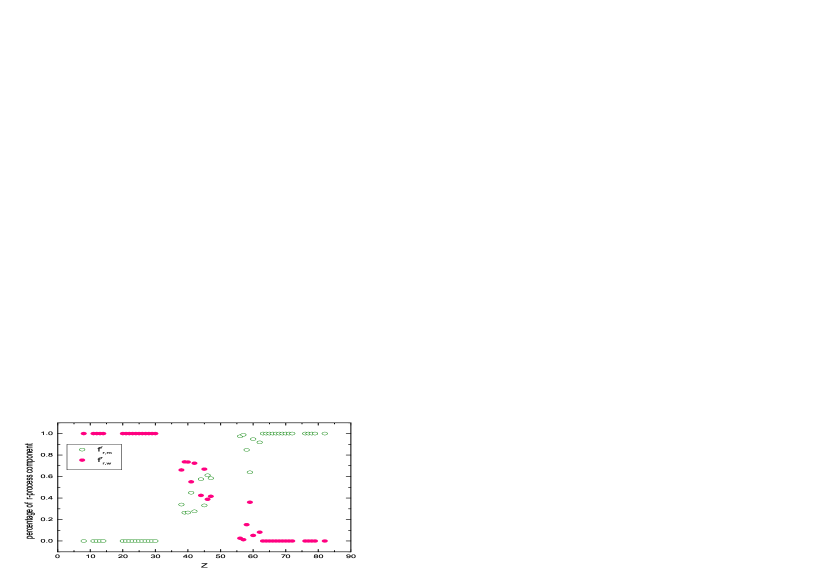
Because the solar r-process abundances can be matched by the sum of and , we can estimate the relative contributions from the main and weak r-process components to the abundances of neutron-capture elements in the solar system. We use the “percentage of weak r-process component” (i.e., ) and the “percentage of main r-process component” (i.e., ) to estimate the relative contributions to r-process abundances of solar system. In Fig. 1, we plot and as functions of atomic number Z. We find that there is a decreasing trend in and an increasing trend in as atomic number increase from Z=30 to Z=63, which are close to linearity. The fractions of contribution to solar system from primary-like yields (or “weak r-component”) (=) are listed in the fifth column of Table 1. The fraction of contribution from primary-like yields to Fe is about 25%. The abundances of solar system is given by Anders & Grevesse (1989). Recently, Lodders et al. (2009) updated the abundances of solar system, the new values should not change our results and conclusions.
2.2 Abundance Fit Approach
Nearly all chemical evolution and nucleosynthetic information is in the form of elemental abundances in stars with various metallicities. In order to investigate the relative contributions from the individual neutron-capture process, the abundances in the metal-poor halo stars are particularly useful. In this work we analyze the direct observational constraints provided by the photospheric composition of the metal-poor stars. Our goal is to find the parameters that characterize the observed data. The standard definitions of elemental abundances and ratios are used throughout the paper. For element X, the abundance is defined as the logarithm of the number of atoms of element X per hydrogen atoms, loglog+12.0. The abundance ratio relative to the solar ratio of element X and element Y is defined as [X/Y]log-log. The reduced is defined as
| (2) |
where is the observed abundance of the th element, is the observational error, is the calculated abundance from equation (1), is the number of elements applied in the fit and is the number of free parameters. We use the parametric approach to investigate what the possible relative contributions might be to reproduce the observed abundance patterns found in metal-poor stars. Based on equation (1), we carry out the calculation, including the contributions of the main r-process and weak r-process to fit the abundances observed in the stars, in order to look for the minimum in the two-parameter space formed by and . For a good fit, the reduced should be of order unity.
3 Results and Discussions
3.1 Fitted Results
It is noted that the weak r-process component in equation (1) include light elements (from O to Ca), iron group elements (from Sc to Zn), lighter neutron-capture elements (such as Sr, Y and Zr) and heavier neutron-capture elements (such as Ba), so the observed data of investigated sample stars should contain abundances of these four groups of elements. In order to obtain better constraint on main r-process component coefficient, these observed data must contain the abundances of Eu and the number of observed neutron-capture elements should be more than four. We select 30 metal-poor stars ([Fe/H]) with [Ba/Fe], which means that the s-enhanced stars are not included. The parameters can be obtained using the observed data in 30 sample stars collected by Suda et al. (2008) and from literatures (Westin et al., 2000; Cowan et al., 2002; Hill et al., 2002; Johnson, 2002; Johnson & Bolte, 2002; Sneden et al., 2003; Honda et al., 2004, 2006, 2007; Barklem et al., 2005; Ivans et al., 2006; Christlieb et al., 2008; Hayek et al., 2009; Mashonkina et al., 2010; Roederer et al., 2010). The results of the component coefficients, and () are listed in Table 2.
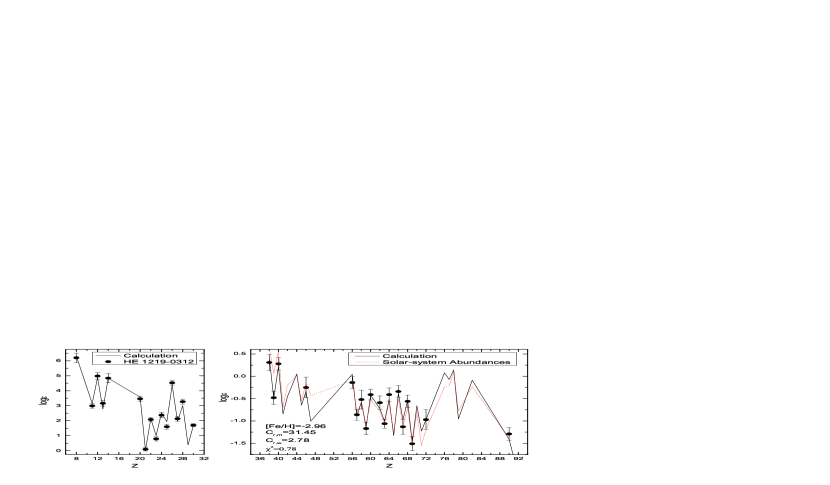
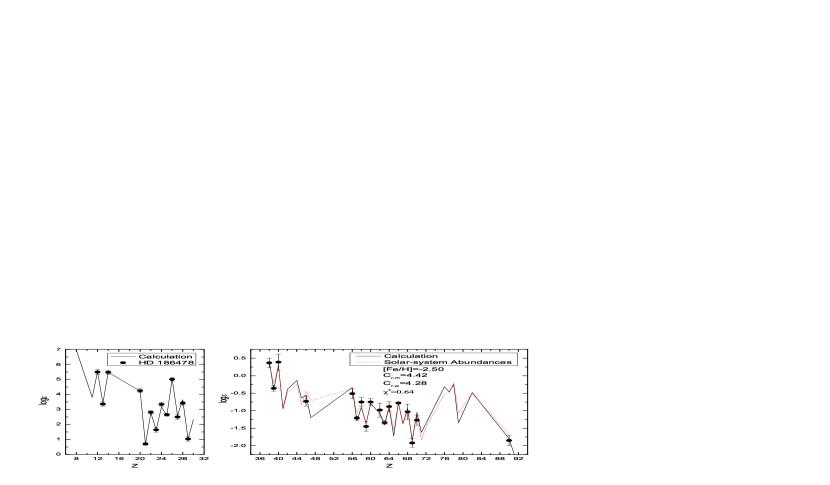
Two examples are provided in Figs. 2 and 3, which shows our calculated results for two sample stars, HE 1319-0312 and HD 186478. In order to provide a convenient comparison, the observed elemental abundances are marked by filled circles. The dotted line represents the solar-system r-process abundances given by Arlandini et al. (1999) (from Sr to Nb, the abundances are updated by Travaglio et al. (2004) and the abundances of Pb and Th come from Sneden et al. (2008)), which is normalized to Eu. The predictions are most within the observational error for elements from O to Pb. In the top panel of Fig. 4, we show individual relative offsets () for the sample stars, except for BD-18 5550, between the predictions with the observed abundances. Typical observational uncertainties in presented by dotted lines are dex. The rms offsets of these elements in are mostly smaller than 0.20 dex, which are shown in the bottom panel. These values are within the uncertainties of abundance determinations. From Fig. 4 we can see that the predictions are in agreement with the observed abundances for most sample stars, not only for light elements and iron group elements but also for the lighter neutron-capture elements and the heavier neutron-capture elements. The good agreement supports the idea that there exist two robust processes.
3.2 The Trends of Component Coefficients and The Logarithmic Component Ratios
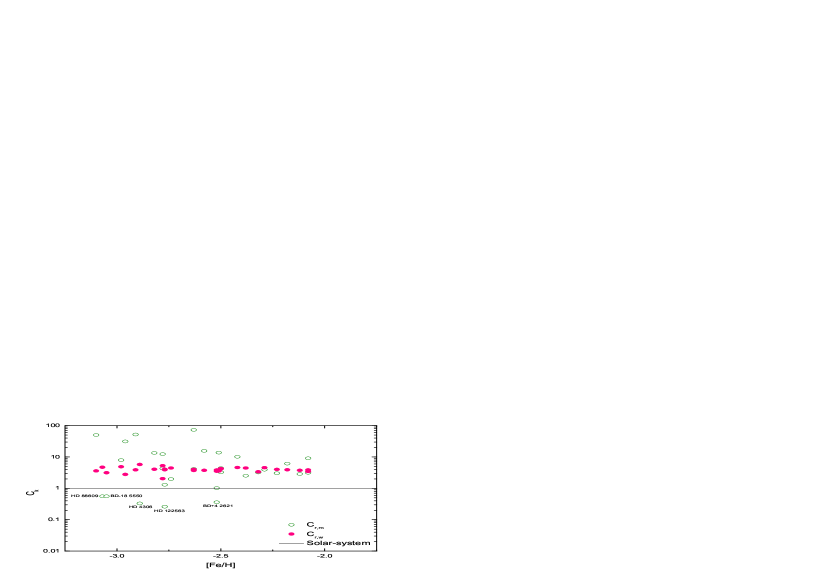
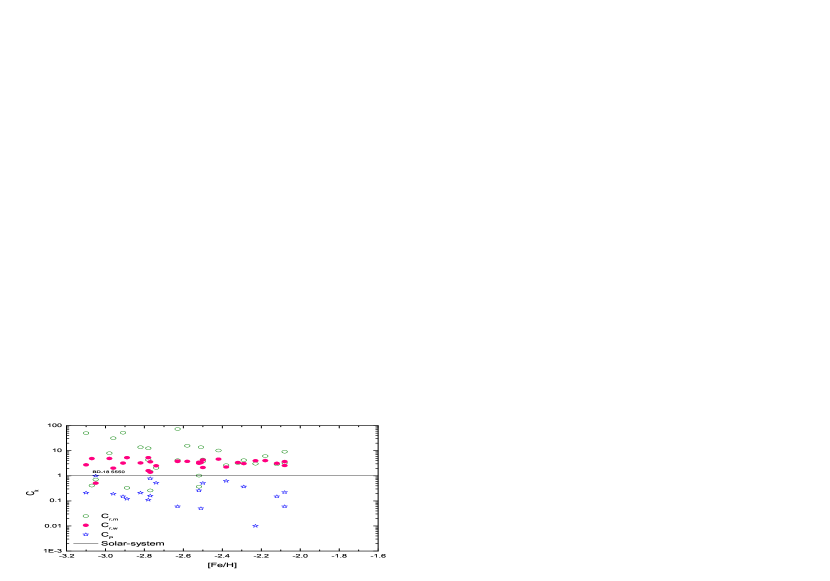
We can obtain some information from the component coefficients. (or , or ) means that, except for the effect of metallicity, the contribution from the corresponding process to the neutron-capture-element abundances in the sample star is larger (or less) than that in the solar system. If two coefficients are not equal to each other, the relative contributions from the various components to the neutron-capture-element abundances are not in proportion to that of the solar-system. The component coefficients as a function of metallicity, illustrated in Fig. 5, contain some important information. For the metal-poor stars, since they are thought to exhibit an abundance pattern produced by a few r-process events in the early Galaxy, the very large scatter of from star to star samples a largely unmixed early Galaxy. This unmixed behavior had been studied by many authors (Travaglio et al., 2001; Fields et al., 2002; Johnson & Bolte, 2002; Cowan et al., 2005; Cescutti, 2008). We note that for most metal-poor stars, both and are larger than 1. This means that the contributions from the weak r- and main r-processes to the neutron-capture-element abundances in these stars, except for the effects of metallicity, are larger than those in the solar system. This result can be naturally explained by the shorter lifetimes of massive stars: massive stars evolve quickly, ending as SNe II producing r-process elements. As the metallicity increases, a very large scatter of main r-process component coefficients is obtained for metal-poor stars for the range of [Fe/H], then the scatter begin to decrease.
In order to study Galactic evolution of neutron-capture elements, the variation of the logarithmic ratio [element/Fe] with metallicity is particularly useful (Travaglio et al., 1999). For the th element, the logarithmic component ratio of the individual neutron-capture process relative to solar ratio [element/Fe]k () is defined as:
| (3) |
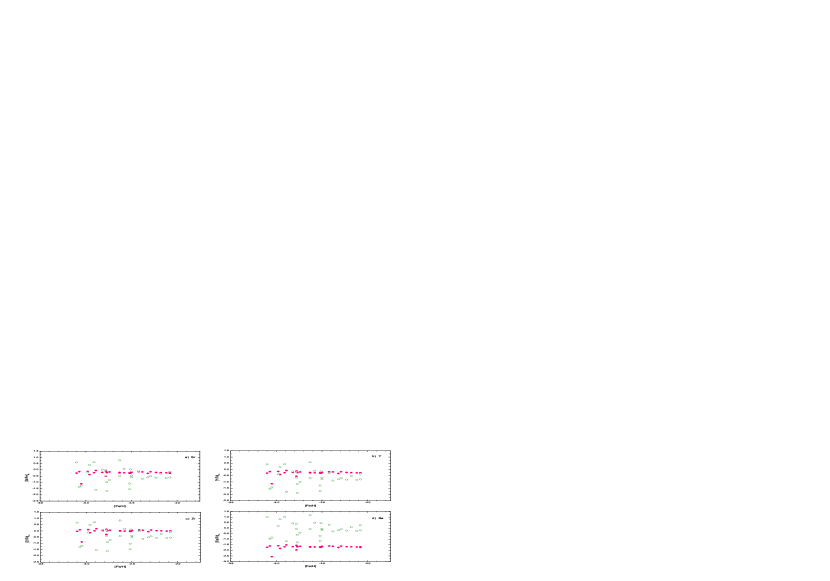
where is the abundances of the th element produced by the individual neutron-capture process and is abundance of the element in the solar system. The derived component ratios are shown in Fig. 6, in which Sr, Y, Zr and Ba are taken as examples. The trend of ratios [element/Fe]r,w is almost constant for the normal metal-poor stars, which is clearly different from those of [element/Fe]r,m. We find that the ratios [Sr/Fe]r,w are nearly -0.3 except for BD-18 5550.
3.3 The Application of Approach: The Finding of Specific Objects
Using the component coefficients, we can select those stars with special neutron-capture-element abundance distributions. If one component coefficient is much larger than others, this star might have been formed in a Galactic region that was not well-mixed chemically and the corresponding process may be dominantly responsible for the neutron-capture elements in this star. For example, the r-process component coefficients of metal-poor star CS 29497-004 are =73.16 and =3.73. This implies that CS 29497-004 is also a main r-process star.
There are a number of studies that have been done to explore the origin of neutron-capture elements over many years. Therefore, the observed abundances of metal-poor stars provide the best opportunity to investigate the abundance patterns produced by individual neutron-capture processes (Sneden et al., 2008). The detailed abundance studies for main r-process stars have revealed that the abundance pattern of heavier neutron-capture elements () is close to the r-process pattern of solar system. However, their lighter neutron-capture elements are deficient to the solar r-process pattern (e.g., Sneden et al. (2000); Hill et al. (2002)), which implies that another component, such as weak r-process component, is required. The metal-poor stars HD 122563 and HD 88609 have extreme excesses of lighter neutron-capture elements and are considered as weak r-process stars. Clearly, it is very important to find more weak r-process stars to investigate the robustness of weak r-process pattern.
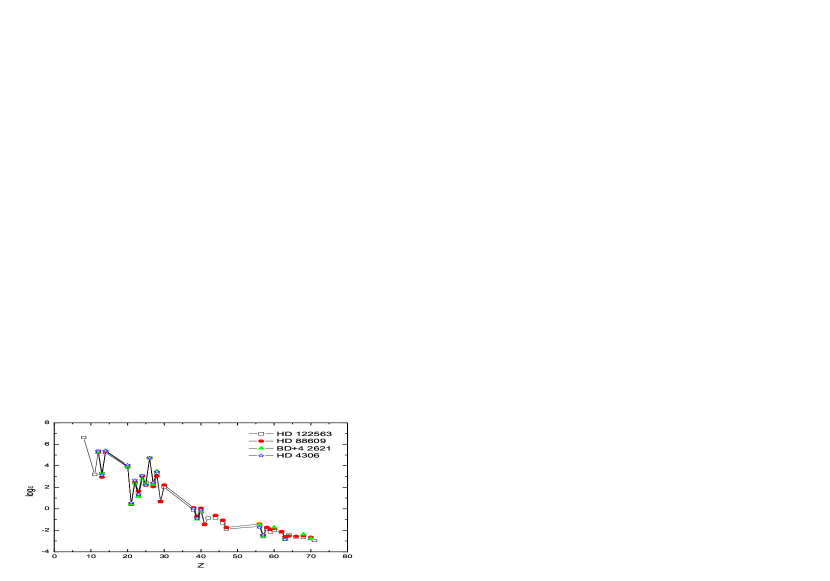
Based on our results shown in Fig. 5 and Table 2, we can find that the metal-poor stars, BD+4 2621 with =0.36, =3.85 and HD 4306 with =0.33, =5.79, could be two weak r-process stars. In order to test this finding, Fig. 7 shows the abundance comparisons on the logarithmic scale among BD+4 2621, HD 4306 and HD 122563 as a function of atomic number, which have been normalized to Fe abundance of HD 122563. As a comparison, the abundances of HD 88609 are also reported. Fig. 7 reveals that the abundance patterns of the two stars (BD+4 2621 and HD 4306) are quite similar to the abundance pattern of HD 122563, although the differences do not seem significant. Our conclusion here is that BD+4 2621 and HD 4306 are another two examples of weak r-process stars. Please note that BD-18 5550 is not a weak r-process star, we will discuss it in Section 3.4. The metallicity of BD+4 2621 ([Fe/H]=-2.52) is even higher than that of HD 122563. This means that the weak r-process stars, HD 122563 and HD 88609, are not peculiar objects and the abundance pattern produced by weak r-process is remarkably stable from star to star, at least in the range of metallicity between -2.52 and -3.1.
One could recall that the abundance patterns of the heavier elements for two main r-process stars match the solar-system r-process pattern very closely and their lighter neutron-capture elements (, i.e., from Rb to Ag) are too deficient to agree entirely with the solar-system’s residual r-process pattern. This phenomenon is also shown in right panel of Fig. 2 for r-rich star HE 1219-0312. From the component coefficients listed in Table 2, we find the main r-process coefficient is close to the weak r-component for some sample stars (e.g., HD 6268, HD 186478 and HD 165195). For example, the main r-process coefficient and the weak r-component coefficient of metal-poor star HD 186478 are 4.42 and 4.28, respectively. As shown in right panel of Fig. 3, the abundances of the neutron-capture elements are well matched by the scaled solar r-process pattern. Obviously, the abundances of HD 186478 also seem to be a better match to the scaled r-process abundances in solar system for lighter neutron-capture elements Sr, Y and Zr. The similar values of two r-process coefficients imply that the relative contributions from two components to the neutron-capture-element abundances are in proportion to that of the solar system.
3.4 Investigation of The Prompt Component
Based on observations, there are some metal-poor stars with [Sr/Fe] (see Fig. 4 in Travaglio et al. (2004)). In our sample stars, there is only one star, BD-18 5550, with [Sr/Fe]. From Table 2, we can see that its is larger than 15. Obviously, the observed abundances of metal-poor stars with [Sr/Fe] can not be fitted by weak r-process and main r-process components. So there should be another component which mainly produces iron group elements and light elements, and barely produces neutron-capture elements in the early Galaxy. This component was called as the initial or prompt (P) component by Qian & Wasserburg (2001). The P component may arise from the first generations of very massive stars. These stars produce the initial abundance of Fe and associated elements corresponding to [Fe/H], and the observed abundance of metal-poor stars with [Sr/Fe] should be the representative of P component. The low ratios of [Sr/Fe] (the lowest observed values of [Sr/Fe] are about -2.0 for metal-poor stars) imply that P component mainly produces iron group elements and light elements, and barely produce neutron-capture elements.
The abundances of BD-18 5550 ([Fe/H]=-3.05 and [Sr/Fe]=-1.2) have been observed by Johnson (2002) and Johnson & Bolte (2002). We adopt the main r-process and weak r-process abundance patterns to fit the abundances of neutron-capture elements in BD-18 5550. The fitted result is shown in Fig. 8 by solid line. The components coefficients and deduced for this star are =0.71, =0.51 and . Although the star is the low-[Sr/Fe] star, its abundances of neutron-capture elements can be fitted by two r-process components. From Fig. 8 we can see that, for the light elements and iron group elements, the observed abundances are higher than calculated result, because the contribution of the P component is not included. We can estimate the P component by subtracting calculated values from observed abundances for light elements and iron group elements; the abundance pattern of P component is listed in Table 3. Note that, once the SNe II in which neutron-capture elements are produced began to contribute their production to ISM, the effect of P component to the stellar abundances become smaller (Qian & Wasserburg, 2001).
As a test, we have used three components (main r-, weak r- and P-components) to fit the abundances of sample stars. In this case, the abundance for the th element in a star can be calculated as:
| (4) |
where [Fe/H]185550=-3.05, is the abundance of the th element produced by the P-component (listed in Table 3) and is the P-component coefficient. The component coefficients for main r-, weak r- and P-components are listed in Table 4 and their trends are shown in Fig. 9. From Fig. 9 we can see that the coefficients of P-component decrease with increasing metallicities. Since the abundances of the metal-poor halo stars can be used as a probe of the conditions that existed in the history of the Galaxy, it is important to determine the relative contributions from the individual process to the elemental abundances in the stars. Based on equation (4), we can isolate the contributions corresponding to the primary-like yields (or weak r-component) and P-component to light elements and iron group elements. The component fractions can be calculated as:
| (5) |
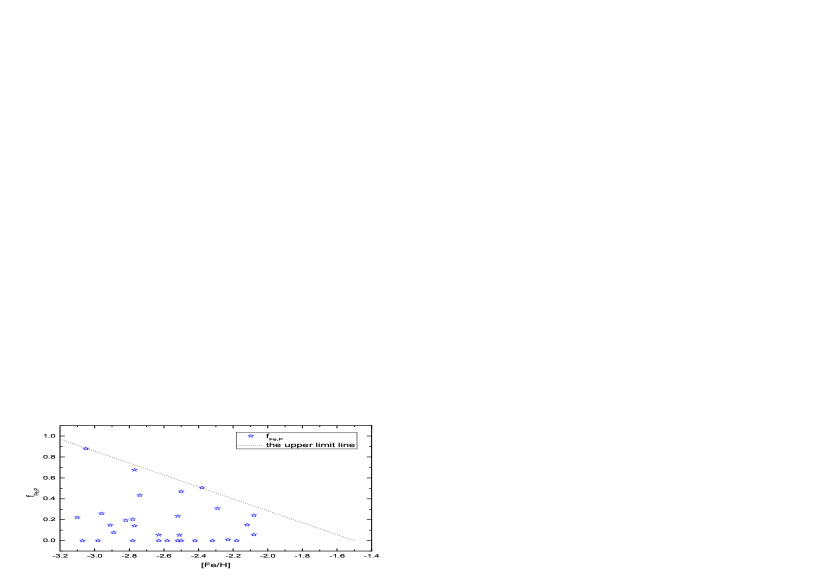
where is calculated from equation (4). In Fig. 10, the component fractions for element Fe as function of [Fe/H] are given. In our sample stars, BD-18 5550 has the lowest ratio of [Sr/Fe] ([Sr/Fe]=-1.2) and the largest component fractions (=0.88). Except for BD-18 5550, the abundances of star BD-17 6036 with [Sr/Fe]=-0.61 also apparently contains the contribution from P-component. There is an upper limit of component fractions at a given [Fe/H]. We can see that the upper limit of decrease linearly with increasing metallicities. At metallicity [Fe/H], the contributions from P-component are smaller than about 25%. This means that the contribution of P-component would be invisible for higher metallicities ([Fe/H]).
4 Conclusions
In this work, we present an approach to fit the abundances of metal-poor stars and determine the relative contributions from individual neutron-capture process. Our results can be summarized as follows:
1. The abundances of neutron-capture elements in all metal-poor stars, including main r-process stars and weak r-process stars, contain the contributions of two r-processes. For weak r-process stars, ; for main r-process stars, .
2. The weak r-process coefficients are close to constant for normal metal-poor stars, including r-rich stars. The component ratio [Sr,Y,Zr/Fe]r;w is also nearly constant for most metal-poor stars. Our conclusion is that the elements produced by weak r-process have increased along with Fe over the polluted history.
3. For most sample stars, the relative contribution from the individual neutron-capture process to the heavy element abundances was not usually found to be in the solar proportion, especially for main r-process stars and weak r-process stars. However, we find some stars whose main r-process coefficients are close to their weak r-process coefficients. The abundance pattern of the neutron-capture elements in these stars is close to the solar r-process pattern.
4. In addition to the well-known weak r-process stars HD 122563 ([Fe/H]=-2.77) and HD 88609 ([Fe/H]=-3.07), based on the component coefficients, we find that the metal-poor stars BD+4 2621 and HD 4306 are also weak r-process stars. The metallicity of BD+4 2621 is [Fe/H]=-2.52, which means that abundance pattern produced by weak r-process is stable from star to star, at least in the range of metallicity between -2.52 and -3.1.
5. In our sample stars, there is only one star, BD-18 5550, having [Sr/Fe]. Although the star is the low-[Sr/Fe] star, its abundances of neutron-capture elements can also be fitted by two r-process components. However, the observed abundances for the light elements and iron group elements are higher than estimated values, because the contribution of the P-component is not included. The abundance pattern of P component is estimated from BD-18 5550. There is an upper limit of fractions of P-component at a given [Fe/H]. We find that the upper limit of the fraction decrease linearly with increasing metallicities. This means that the contribution of P-component would be invisible for higher metallicities ([Fe/H]).
6. It is very important to note that the solar-system r-process abundances can be best-fitted by main r-process and weak r-process abundance patterns derived from the very metal-poor stars, which implies that both r-process abundance patterns are weakly dependent on metallicity. This also means that solar r-process abundances have been quantitatively decomposed into two components. In solar system, the trend of percentage of weak r-process component linearly decrease with atomic number from Zn to Eu; that of main r-process component is contrary. The fraction of contribution from primary-like yields to Fe in solar system is estimated about 25%.
Our results could give the constraints on models of the r- and s-processes that yield lighter and heavier neutron-capture elements in the Galaxy. Our hope is that the results here will provide useful information to explore the origins of neutron-capture elements in the Galaxy. Obviously, more detailed abundances of neutron-capture elements and light elements in more stars are needed.
References
- Anders & Grevesse (1989) Anders, E., & Grevesse, N. 1989, Geochim. Cosmochim. Acta, 53, 197
- Arcones & Montes (2011) Arcones, A., & Montes, F. 2011, ApJ, 731, 5A
- Arlandini et al. (1999) Arlandini, C., Kppeler, F., Wisshak, K., Gallino, R., Lugaro, M., Busso, M., & Straniero, O. 1999, ApJ, 525, 886
- Barklem et al. (2005) Barklem, P. S., et al. 2005, A&A, 439, 129
- Burbidge et al. (1957) Burbidge, E. M., Burbidge, G. R., Fowler, W. A., & Hoyle, F. 1957, Rev. Mod. Phys, 29, 547
- Busso et al. (1999) Busso, M., Gallino, R., & Wasserburg G. J. 1999, ARA&A, 37, 239
- Cescutti (2008) Cescutti, G. 2008, A&A, 481, 691
- Christlieb et al. (2008) Christlieb, N., Schörck, T., Frebel, A., Beers, T. C., Wisotzki, L., Reimers D. 2008, A&A, 484, 721
- Cowan et al. (1991) Cowan, J. J., Thielemann, F.-K., & Truran, J. W. 1991, Phys. Rep., 208, 267
- Cowan et al. (1999) Cowan, J. J., Pfeiffer, B., Kratz, K.-L., Thielemann, F.-K., Sneden, C., Burles, S., Tytler, D., & Beers, T. C. 1999, ApJ, 521, 194
- Cowan et al. (2002) Cowan, J. J., et al. 2002, ApJ, 572, 861
- Cowan et al. (2005) Cowan, J. J., et al. 2005, ApJ, 627, 238
- Fields et al. (2002) Fields, B. D., Truran, J. W., Cowan, J. J. 2002, ApJ, 575, 845
- Hansen et al. (2012) Hansen, C. J., et al. 2012, A&A, 545, DOI: 10.1051/0004-6361/201118643, arXiv:1205.4744
- Hayek et al. (2009) Hayek, W., et al. 2009, A&A, 504, 511
- Hill et al. (2002) Hill, V., et al. 2002, A&A, 387, 560
- Honda et al. (2004) Honda, S., Aoki, W., Kajino, T., Ando, H., Beers, T. C., Izumiura, H., Sadakane, K., Takada-Hidai, M. 2004, ApJ, 607, 474
- Honda et al. (2006) Honda, S., Aoki, W., Ishimaru, Y., Wanajo, S., Ryan, S. G. 2006, ApJ, 643, 1180
- Honda et al. (2007) Honda, S., Aoki, W., Ishimaru, Y., Wanajo, S. 2007, ApJ, 666, 1189
- Ishimaru et al. (2005) Ishimaru, Y., Wanajo, S., Aoki, W., Ryan, S. G. and Prantzos, N. 2005, Nucl. Phys. A, 758, 603
- Ivans et al. (2006) Ivans I., Simmerer J., Sneden C., Lawler J. E., Cowan J. J., Gallino R., Bisterzo S. 2006, ApJ, 645, 613
- Izutani et al. (2009) Izutani, N., Umeda, H., Tominaga, N. 2009, ApJ, 692, 1517
- Johnson (2002) Johnson, J. 2002, ApJS, 139, 219
- Johnson & Bolte (2002) Johnson, J., & Bolte, M. 2002, ApJ, 579, 616
- Lamb et al. (1977) Lamb, S., Howard, W. M., Truran, J. W., & Iben, I., Jr. 1977, ApJ, 217, 213
- Li et al. (2012) Li, H. J., Liang, S., Cui, W. Y., & Zhang, B. 2012, PASA, in press, doi: pas.2012.15, arXiv: 1209.5505
- Lodders et al. (2009) Lodders, K. Palme, H., & Gail, H.-P. 2009, Landolt-Bönstein - Group VI Astronomy and Astrophysics Numerical Data and Functional Relationships in Science and Technology Volume, arXiv: 0901.1149
- Mashonkina et al. (2010) Mashonkina, L., Christlieb, N., Barklem, P. S., Hill, V., Beers, T. C., Velichko, A. 2010, A&A, 516, 46
- McWilliam et al. (1995a) McWilliam, A., Preston, G. W., Sneden, C., & Shectma, S. 1995a, AJ, 109, 2736
- McWilliam et al. (1995b) McWilliam, A., Preston, G. W., Sneden, C., & Searle, L. 1995b, AJ, 109, 2757
- Montes et al. (2007) Montes, F., et al. 2007, ApJ, 671, 1685
- Qian & Wasserburg (2001) Qian Y.-Z., & Wasserburg G. J., 2001, ApJ, 559, 925
- Qian & Wasserburg (2007) Qian Y.-Z., & Wasserburg G. J., 2007, Phys. Rep., 442, 237
- Qian & Wasserburg (2008) Qian Y.-Z., & Wasserburg G. J., 2008, ApJ, 687, 272
- Raiteri et al. (1991) Raiteri, C. M., Busso, M., Gallino, R., Picchio, G., & Pulone, L. 1991, ApJ, 371, 665
- Raiteri et al. (1993) Raiteri, C. M., Gallino, R., Busso, M., Neuberger, D., & Kappeler, F. 1993, ApJ, 419, 207
- Roederer et al. (2010) Roederer, I. U., Sneden, C., Lawler, J., Cowan, J. J. 2010, ApJ, 714, L123
- Ryan et al. (1996) Ryan, S. G., Norris, J. E., & Beers, T. C. 1996, ApJ, 471, 254
- Sneden et al. (2000) Sneden, C., Cowan, J. J., Ivans, I. I., Fuller, G. M., Burles, S.,Beers, T. C., Lawer, J. E. 2000, ApJ, 533, L139
- Sneden et al. (2003) Sneden, C., et al. 2003, ApJ, 591, 936
- Sneden et al. (2008) Sneden, C., Cowan, J. J., & Gallino, R. 2008, ARA&A, 46, 241
- Suda et al. (2008) Suda, T., Katsuta, Y., Yamada, S. et al. 2008, PASJ, 60, 1159
- Travaglio et al. (1999) Travaglio, C., Galli, D., Gallino, R., Busso, M., Ferrini, F., & Straniero, O. 1999, ApJ, 521, 691
- Travaglio et al. (2001) Travaglio, C., Galli, D., Burkert, A. 2001, ApJ, 547, 217
- Travaglio et al. (2004) Travaglio, C., Gallino, R., Arnone, E., Cowan, J., Jordan, F., & Sneden, C. 2004, ApJ, 601, 864
- The et al. (2000) The, L.-S., El EiD, M. F., & Meyer, B. S. 2000, ApJ, 533, 998
- Truran et al. (2002) Truran, J. W., Cowan, J. J., Pilachowski, C. A., Sneden, C. 2002, PASP, 114, 1293
- Wanajo & Ishimaru (2006) Wanajo S., & Ishimaru, Y. 2006, Nucl. Phys. A, 777, 676
- Westin et al. (2000) Westin, J., Sneden, C., Gustafsson, B., Cowan, J. J. 2000, ApJ, 530, 783
| Element | Z | |||
|---|---|---|---|---|
| O | 8 | 0.00E+00 | 1.97E+07 | 0.83 |
| Na | 11 | 0.00E+00 | 1.33E+04 | 0.23 |
| Mg | 12 | 0.00E+00 | 7.09E+05 | 0.66 |
| Al | 13 | 0.00E+00 | 5.56E+03 | 0.07 |
| Si | 14 | 0.00E+00 | 6.49E+05 | 0.65 |
| Ca | 20 | 0.00E+00 | 3.57E+04 | 0.58 |
| Sc | 21 | 0.00E+00 | 1.01E+01 | 0.30 |
| Ti | 22 | 0.00E+00 | 1.28E+03 | 0.53 |
| V | 23 | 0.00E+00 | 9.37E+01 | 0.32 |
| Cr | 24 | 0.00E+00 | 3.13E+03 | 0.23 |
| Mn | 25 | 0.00E+00 | 8.19E+02 | 0.09 |
| Fe | 26 | 0.00E+00 | 2.26E+05 | 0.25 |
| Co | 27 | 0.00E+00 | 8.65E+02 | 0.38 |
| Ni | 28 | 0.00E+00 | 9.57E+03 | 0.19 |
| Cu | 29 | 0.00E+00 | 2.28E+01 | 0.04 |
| Zn | 30 | 0.00E+00 | 4.57E+02 | 0.36 |
| Sr | 38 | 1.92E+00 | 3.74E+00 | 0.16 |
| Y | 39 | 2.18E-01 | 6.10E-01 | 0.13 |
| Zr | 40 | 1.11E+00 | 3.06E+00 | 0.27 |
| Nb | 41 | 1.09E-01 | 1.33E-01 | 0.19 |
| Mo | 42 | 2.42E-01 | 6.35E-01 | 0.25 |
| Ru | 44 | 8.85E-01 | 6.53E-01 | 0.35 |
| Rh | 45 | 1.60E-01 | 3.23E-01 | 0.94 |
| Pd | 46 | 3.63E-01 | 2.30E-01 | 0.17 |
| Ag | 47 | 7.75E-02 | 5.52E-02 | 0.11 |
Table 1 continued. Element Z Ba 56 9.26E-01 2.46E-02 0.01 La 57 1.05E-01 1.32E-03 0.00 Ce 58 2.19E-01 3.93E-02 0.03 Pr 59 5.71E-02 3.23E-02 0.19 Nd 60 3.16E-01 1.73E-02 0.02 Sm 62 1.56E-01 1.39E-02 0.05 Eu 63 8.24E-02 0.00E+00 0.00 Gd 64 2.56E-01 0.00E+00 0.00 Tb 65 3.91E-02 0.00E+00 0.00 Dy 66 3.50E-01 0.00E+00 0.00 Ho 67 8.83E-02 0.00E+00 0.00 Er 68 2.41E-01 0.00E+00 0.00 Tm 69 2.81E-02 0.00E+00 0.00 Yb 70 1.84E-01 0.00E+00 0.00 Lu 71 4.97E-02 0.00E+00 0.00 Hf 72 8.96E-02 0.00E+00 0.00 Os 76 1.00E+00 0.00E+00 0.00 Ir 77 7.10E-01 0.00E+00 0.00 Pt 78 1.16E+00 0.00E+00 0.00 Au 79 9.25E-02 0.00E+00 0.00 Pb 82 6.85E-01 0.00E+00 0.00 Th 90 3.25E-02 0.00E+00 0.00 U 92 5.20E-03 0.00E+00 0.00
| Star | [Fe/H] | ||||
|---|---|---|---|---|---|
| HD 221170 | -2.18 | 6.14 | 3.91 | 1.23 | 41 |
| HE 1219-0312 | -2.96 | 31.45 | 2.78 | 0.78 | 31 |
| CS 31082-001 | -2.91 | 52.04 | 3.89 | 0.64 | 37 |
| CS 29497-004 | -2.63 | 73.16 | 3.73 | 0.97 | 15 |
| CS 29491-069 | -2.51 | 13.80 | 3.57 | 1.10 | 26 |
| HD 115444 | -2.98 | 7.98 | 4.90 | 1.70 | 36 |
| BD +17o03248 | -2.08 | 9.10 | 3.87 | 0.70 | 42 |
| CS 22892-052 | -3.10 | 50.31 | 3.61 | 0.92 | 44 |
| HD 6268 | -2.63 | 4.16 | 4.02 | 0.96 | 28 |
| HD 122563 | -2.77 | 0.26 | 4.07 | 1.08 | 34 |
| HD 88609 | -3.07 | 0.56 | 4.73 | 1.93 | 30 |
| HE 2224+0143 | -2.58 | 15.69 | 3.77 | 0.39 | 16 |
| HE 2252-4225 | -2.82 | 13.47 | 4.07 | 0.69 | 19 |
| HE 2327-5642 | -2.78 | 12.39 | 2.04 | 1.29 | 35 |
| HD 108577 | -2.38 | 2.52 | 4.46 | 1.07 | 25 |
| HD 165195 | -2.32 | 3.22 | 3.39 | 1.30 | 20 |
| HD 216143 | -2.23 | 3.04 | 4.02 | 0.56 | 21 |
| BD-18 5550 | -3.05 | 0.56 | 3.15 | 15.07 | 20 |
| BD-17 6036 | -2.77 | 1.30 | 3.92 | 3.24 | 21 |
| BD-11 145 | -2.50 | 3.27 | 4.18 | 1.13 | 18 |
| BD+4 2621 | -2.52 | 0.36 | 3.85 | 0.73 | 18 |
| BD+5 3098 | -2.74 | 1.98 | 4.45 | 1.42 | 20 |
| BD+8 2856 | -2.12 | 2.87 | 3.76 | 1.36 | 27 |
| BD+9 3223 | -2.29 | 3.93 | 4.58 | 1.33 | 18 |
| BD+10 2495 | -2.08 | 3.14 | 3.47 | 0.55 | 19 |
Table 2 continued. Star [Fe/H] HD 4306 -2.89 0.33 5.79 1.40 16 HD 110184 -2.52 1.02 3.52 2.18 27 HD 126587 -2.78 4.30 5.29 1.36 22 HD 186478 -2.50 4.42 4.28 0.64 28 CS 30306-132 -2.42 10.17 4.63 1.22 26
| Element | Z | Element | |||
|---|---|---|---|---|---|
| Na | 11 | 7.91E+01 | V | 23 | 1.76E-01 |
| Mg | 12 | 3.94E+03 | Cr | 24 | 6.34E+00 |
| Al | 13 | 2.26E+01 | Mn | 25 | 2.72E+00 |
| Si | 14 | 2.66E+03 | Fe | 26 | 7.48E+02 |
| Ca | 20 | 1.39E+02 | Co | 27 | 3.41E+00 |
| Sc | 21 | 2.42E-02 | Ni | 28 | 4.94E+01 |
| Ti | 22 | 2.65E+00 | Zn | 30 | 2.30E+00 |
| Star | [Fe/H] | |||||
|---|---|---|---|---|---|---|
| HD 221170 | -2.18 | 6.12 | 4.05 | 0.00 | 1.11 | 38 |
| HE 1219-0312 | -2.96 | 31.72 | 2.02 | 0.19 | 0.79 | 29 |
| CS 31082-001 | -2.91 | 52.32 | 3.23 | 0.15 | 0.66 | 35 |
| CS 29497-004 | -2.63 | 73.16 | 3.73 | 0.00 | 1.04 | 14 |
| CS 29491-069 | -2.51 | 13.85 | 3.36 | 0.05 | 1.14 | 25 |
| HD 115444 | -2.98 | 7.98 | 4.91 | 0.00 | 1.83 | 33 |
| BD +1703248 | -2.08 | 9.14 | 3.69 | 0.06 | 0.74 | 39 |
| CS 22892-052 | -3.1 | 50.44 | 2.74 | 0.21 | 0.87 | 41 |
| HD 6268 | -2.63 | 4.17 | 3.86 | 0.06 | 1.00 | 27 |
| HD 122563 | -2.77 | 0.26 | 3.63 | 0.16 | 1.08 | 31 |
| HD 88609 | -3.07 | 0.41 | 4.89 | 0.00 | 1.47 | 28 |
| HE 2224+0143 | -2.58 | 15.69 | 3.77 | 0.00 | 0.42 | 15 |
| HE 2252-4225 | -2.82 | 13.82 | 3.26 | 0.21 | 0.71 | 18 |
| HE 2327-5642 | -2.78 | 12.51 | 1.6 | 0.11 | 1.30 | 34 |
| HD 108577 | -2.38 | 2.66 | 2.24 | 0.62 | 0.44 | 24 |
| HD 165195 | -2.32 | 3.22 | 3.39 | 0.00 | 1.37 | 19 |
| HD 216143 | -2.23 | 3.04 | 3.98 | 0.01 | 0.59 | 20 |
| BD-18 5550 | -3.05 | 0.71 | 0.51 | 1.00 | 0.42 | 20 |
| BD-17 6036 | -2.77 | 1.46 | 1.39 | 0.78 | 1.31 | 20 |
| BD-11 145 | -2.5 | 3.77 | 2.14 | 0.51 | 0.57 | 17 |
| BD+4 2621 | -2.52 | 0.37 | 3.16 | 0.26 | 0.63 | 17 |
| BD+5 3098 | -2.74 | 2.06 | 2.52 | 0.52 | 1.03 | 19 |
| BD+8 2856 | -2.12 | 2.9 | 3.14 | 0.15 | 1.37 | 26 |
| BD+9 3223 | -2.29 | 4.21 | 3.08 | 0.37 | 1.16 | 17 |
| BD+10 2495 | -2.08 | 3.28 | 2.57 | 0.22 | 0.47 | 18 |
Table 4 continued. Star [Fe/H] HD 4306 -2.89 0.33 5.31 0.12 1.45 15 HD 110184 -2.52 1.02 3.48 0.00 2.33 25 HD 126587 -2.78 4.3 5.29 0.00 1.43 21 HD 186478 -2.5 4.42 4.28 0.00 0.69 26 CS 30306-132 -2.42 10.17 4.63 0.00 1.27 25