Search for Associations Containing Young stars (SACY): Chemical tagging IC 2391 & the Argus association††thanks: Based on observations obtained at the European Southern Observatory, Paranal, Chile (ESO program 082.C-0218 and on observations made under the ON-ESO agreement for the joint operation of the 1.52 m ESO telescope and at the Observatório do Pico dos Dias operated by MCT/Laboratório Nacional de Astrofísica (LNA/MCT), Brazil.
Abstract
We explore the possible connection between the open cluster IC 2391 and the unbound Argus association identified by the SACY survey. In addition to common kinematics and ages between these two systems, here we explore their chemical abundance patterns to confirm if the two substructures shared a common origin. We carry out a homogenous high-resolution elemental abundance study of eight confirmed members of IC 2391 as well as six members of the Argus association using UVES spectra. We derive spectroscopic stellar parameters and abundances for Fe, Na, Mg, Al, Si, Ca, Ti, Cr, Ni and Ba.
All stars in the open cluster and Argus association were found to share similar abundances with the scatter well within the uncertainties, where [Fe/H] = 0.04 0.03 for cluster stars and [Fe/H] = 0.06 0.05 for Argus stars. Effects of over-ionisation/excitation were seen for stars cooler than roughly 5200 K as previously noted in the literature. Also, enhanced Ba abundances of around 0.6 dex were observed in both systems. The common ages, kinematics and chemical abundances strongly support that the Argus association stars originated from the open cluster IC 2391. Simple modeling of this system find this dissolution to be consistent with two-body interactions.
keywords:
(Galaxy): open clusters and associations: general – (Galaxy): open clusters and associations: individual: IC 2391 and Argus association – stars: abundances1 Introduction
The vast majority of stars that we observe in any given galaxy are field
stars, a complex mixture of stellar populations of different ages
and metallicities. The present view is that star formation taking place
in molecular clouds gives rise to groups of stars - stellar associations and open clusters.
These groups of stars must dissolve with time to connect star formation with the field population.
Based on near-infrared studies of embedded clusters, Lada & Lada (2003) suggest that less than about 10% of the clusters formed in molecular clouds survive longer than 10 Myr. They propose that this “infant mortality” of clusters is due to feedback of massive stars that expels the gas from the star forming region leaving the stars behind with super-virial velocities. For compact systems of a few hundred stars the dynamical time-scale is only a few Myrs. This means that cluster expansion and star loss by two-body relaxation is also a relevant process at these ages for such systems (Moeckel et al., 2012; Gieles et al., 2012). On longer time-scales (few 100 Myrs) various processes such as the Galactic tidal field and interactions with Giant Molecular Clouds (GMCs) become important. The paucity of open clusters in the solar neighbourhood with ages between 0.5 and a few Gyrs was already noted in the late 50 s (Oort, 1958). Spitzer (1958) analytically derived the cluster disruption times due to encounters with GMCs, showing that such phenomena would account for the scarcity of Galactic clusters older than years. A more detailed treatment of the problem taking into account other disruptive agents has been carried out in the literature (e.g. Lamers & Gieles, 2006).
Torres et al. (2006) reported the results of a high-resolution optical spectroscopic survey to search for associations
containing young stars (SACY) among optical counterparts
of ROSAT All-Sky X-ray sources in the southern hemisphere.
Using the method described in Torres et al. (2006), Torres et al. (2008) identified nine new young associations,
namely, Chamaleontis (ChA), TWHydrae (TWA), Pictoris,
Octants (OctA), Tucana-Horologium (THA), Columba (ColA),
Carina (CarA), Argus (ArgA), and AB Doradus (ABDA). The age span derived based on the
isochrone fitting and the Li abundance analysis ranges from 6-70 Myr (da Silva et al., 2009).
Of relevance to the context of cluster disruption discussed above, are
two young associations identified in the SACY survey which appear to be associated with known open clusters.
These are the Argus association and the open cluster IC 2391 and the Cha Association and the
Cha cluster (Mamajek et al., 2000; Torres et al., 2008).
In this paper we investigate in detail the possible connection between the Argus Association and the young open cluster IC 2391.
In particular, we can test for a common origin of the association and cluster by examining the stellar elemental abundances.
If the abundance analysis reveals high chemical homogeneity among the association stars comparable to the open cluster abundance patterns,
it supports a common origin scenario where the Argus association stars were once bound members of open cluster IC 2391.
This assumes that the proto-cluster gas cloud was sufficiently mixed hence all stars born from the same site should share
the same elemental abundance pattern.
This concept of elemental abundance matching is often referred to as chemical tagging (Freeman & Bland-Hawthorn, 2002).
Conversely if the abundances of the Argus association stars are found to be either heterogeneous,
matching the general disk stellar population (e.g. the Hercules stream, see Bensby et al. (2007)) or they do
not match the abundance patterns of IC 2391, then it is more likely that these are two separate systems even if they share the same kinematics.
Given that disk dynamics make the kinematical information somewhat unreliable to explore the history of these stellar structures,
for the first time we carry out a high resolution elemental abundance analysis of the Argus association in a homogeneous manner
with stars in IC 2391 in order to carry out chemical tagging.
This will also be the first attempt at chemical tagging a young stellar system.
All published examples of chemical tagging in the disk are for stellar systems older than the Hyades (Bubar & King, 2010; De Silva et al., 2007b).
In Section 2, we briefly describe the SACY survey and present space velocities and spatial locations of the stars in the two systems. In Section 3 we present a detailed elemental abundance study of stars in both the Argus association and open cluster IC 2391. In Section 4 we discuss our results in terms of chemical tagging the two stellar systems. We conclude with a discussion of possible disruption mechanisms given the evidence gathered in the previous sections.
|
2 Identifying the Argus association in the SACY survey
2.1 The convergence method
Usually we think about an association as being a group of stars appearing concentrated in a small
volume in space sharing some common properties such as age, chemical composition, distance and kinematics.
However, if such a group is close enough to the Sun, its
members will appear to cover a large extent in the sky (as an example,
Orion at 50 pc would cover almost the whole sky). Thus, to find a
group, projected spatial concentrations (i.e., in terms of right
ascension and declination only) and proper motions may not be enough.
A better criterion is to look for objects sharing similar heliocentric
space motions (UVW) all around the sky (where we use U positive towards the
Galactic center, V positive in the direction of Galactic rotation, and W positive in the direction of the North Galactic Pole).
Torres et al. (2006) describe in some detail the convergence method developed
to search for members of an association.
This method examines the stars in the hexa-dimensional space,
UVWXYZ, as defined by the space motions relative to the Sun and the physical space coordinates centered
on the Sun (XYZ, in the same directions as UVW). We represent with mv, Mv and Mv,iso the apparent visual magnitude,
the resultant absolute magnitude with the distance obtained from the convergence
method, and the absolute magnitude given by the adopted isochrone for the stellar color;
and , and Vr are the proper motions and the radial velocity.
In brief, if there is no reliable trigonometric distance available111We consider the trigonometric
parallaxes as unreliable if they have errors larger than 2 mas.,
the convergence method finds the distance (d) for each star in the sample
that minimizes the F value of Equation 1. The first term is a photometric distance modulus and
the second is a kinematical one. The method needs, as input, an assumed age and initial velocity values
for the proposed association, and a cutoff value for F above which stars should be considered spurious.
This cutoff value varies for each association but usually we begin with 3.5
(this approximately means 0.7 magnitudes for the distance modulus and 3 km s-1 for the velocity modulus).
The method is iterative, and for each iteration a list of stars with new is obtained. The process ends when the list of stars and the velocities do not change significantly.
| (1) | |||||
where is a constant weighting the importance of the evolutionary
distance with respect to the kinematic distance.
Usually, if there are several stars with trigonometric
parallaxes among the candidates, we use =0. But if there are no stars with reliable parallaxes,
as is the case for the IC 2391, the method may not converge, so we used =20 for this case.
We also define a membership probability to verify the compactness of the association in 7 dimensions, namely UVWXYZ and . Normalized values of these variables are computed by subtracting their mean values and dividing by their dispersions. A quantity K is obtained as the quadratic sum of these dimensionless variables and the probability is computed as
| (2) | |||||
where is the error function.
Finally, we also take into account the Li content of the candidate stars to see if it is compatible with the Li depletion for its age (Neuhäuser, 1997).
| Name | Vsini | Pphot | V-IC | SpT | ELi | Prob | notes | |||||||||||||
|---|---|---|---|---|---|---|---|---|---|---|---|---|---|---|---|---|---|---|---|---|
| 2000 | 2000 | mas yr-1 | km s-1 | days | mÅ | mas | km s-1 | pc | ||||||||||||
| (*)CD-29 2360 | 05 34 59.2 | -29 54 04 | 17.1 | 33.1 | 26.0 | 3.519 | 10.53 | 1.11 | K3Ve | 180 | 14.8 | -22.7 | -16.6 | -5.2 | -34.9 | -47.9 | -32.4 | 0.72 | K | |
| (*)AP Col | 06 04 52.2 | -34 33 36 | 27.3 | 340.9 | 22.4 | 11 | 12.96 | 3.36 | M4Ve | 280 | 119.2 | -22.0 | -13.6 | -4.4 | -3.7 | -6.7 | -3.4 | 0.90 | 1 | |
| CD-56 1438 | 06 11 53.0 | -56 19 05 | -2.5 | 38.3 | 14 | 130 | 0.418848 | 11.32 | 0.93 | K0V | 230 | 8.7 | -21.9 | -11.2 | -5.1 | -9.1 | -101.3 | -53.3 | 0.68 | K |
| CD-28 3434 | 06 49 45.4 | -28 59 17 | -11.3 | 20.8 | 26.8 | 6.4 | 3.823 | 10.62 | 0.85 | G7V | 230 | 9.8 | -23.1 | -16.3 | -7.0 | -51.2 | -85.3 | -23.1 | 0.45 | K |
| CD-42 2906 | 07 01 53.4 | -42 27 56 | -13.8 | 35.5 | 23.6 | 10.8 | 3.96 | 10.64 | 1.02 | K1V | 275 | 10.7 | -22.8 | -16.8 | -6.3 | -26.5 | -85.8 | -26.0 | 0.75 | K |
| CD-48 2972 | 07 28 22.0 | -49 08 38 | -26.7 | 44.4 | 21.1 | 52.0 | 1.0373 | 9.85 | 0.86 | G8V | 250 | 12.6 | -22.3 | -16.6 | -7.3 | -11.9 | -76.0 | -20.0 | 0.88 | K |
| (*)HD 61005 | 07 35 47.5 | -32 12 14 | -55.7 | 74.6 | 22.5 | 8.2 | 5.04 | 8.22 | 0.80 | G8V | 171 | 28.3 | -23.0 | -14.1 | -4.4 | -14.1 | -32.2 | -3.5 | 0.73 | H,2 |
| CD-48 3199 | 07 47 26.0 | -49 02 51 | -22.4 | 36.1 | 18.5 | 24.7 | 2.192 | 10.56 | 0.86 | G7V | 230 | 10.0 | -22.2 | -15.1 | -5.0 | -12.9 | -96.7 | -20.2 | 1.00 | K |
| CD-43 3604 | 07 48 49.8 | -43 27 06 | -26.8 | 39.6 | 21.4 | 40.4 | 0.4706 | 11.13 | 1.40 | K4Ve | 320 | 12.2 | -22.6 | -16.4 | -4.8 | -17.5 | -79.1 | -12.6 | 0.82 | K |
| TYC 8561-0970-1 | 07 53 55.5 | -57 10 07 | -18.3 | 26.9 | 15.8 | 5.0 | 11.50 | K0V | 210 | 7.0 | -21.9 | -14.7 | -6.5 | 0.6 | -139.0 | -36.4 | 0.98 | T | ||
| HD 67945 | 08 09 38.6 | -20 13 50 | -37.8 | 20.4 | 22 | 120 | 8.08 | F0V | 0 | 14.3 | -22.1 | -13.4 | -4.2 | -34.7 | -60.0 | 8.5 | 0.84 | T,SB2? | ||
| CD-58 2194 | 08 39 11.6 | -58 34 28 | -32.7 | 35.4 | 15.6 | 85.0 | 1.240 | 10.18 | 0.83 | G5V | 270 | 9.8 | -21.9 | -16.7 | -5.4 | 8.3 | -100.3 | -18.3 | 0.98 | K |
| CD-57 2315 | 08 50 08.1 | -57 45 59 | -34.1 | 31.0 | 11.7 | 52.0 | 10.21 | K2Ve | 308 | 9.3 | -22.1 | -13.0 | -5.5 | 9.2 | -105.8 | -16.2 | 0.90 | T | ||
| TYC 8594-0058-1 | 09 02 03.9 | -58 08 50 | -24.2 | 26.2 | 12.1 | 34.1 | 11.30 | 0.83 | G8V | 300 | 7.2 | -22.2 | -14.4 | -2.4 | 15.2 | -137.7 | -18.7 | 0.95 | ||
| CD-62 1197 | 09 13 30.3 | -62 59 09 | -34.1 | 27.4 | 12.7 | 84.0 | 0.54841 | 10.46 | 0.93 | K0V(e) | 280 | 8.4 | -21.7 | -16.3 | -5.8 | 22.1 | -114.9 | -20.4 | 0.91 | K |
| TYC 7695-0335-1 | 09 28 54.1 | -41 01 19 | -28.7 | 13.6 | 14 | 120 | 0.3917 | 11.65 | 1.10 | K3V | 300 | 6.7 | -22.0 | -13.6 | -5.3 | -7.9 | -147.3 | 18.8 | 0.87 | K |
| (*)BD-20 2977 | 09 39 51.4 | -21 34 17 | -50.0 | 7.8 | 18.3 | 10.1 | 10.22 | G9V | 260 | 11.3 | -22.3 | -16.5 | -4.7 | -21.9 | -79.0 | 34.4 | 0.58 | T | ||
| TYC 9217-0641-1 | 09 42 47.4 | -72 39 50 | -30.1 | 18.9 | 6.7 | 23.4 | 2.3026 | 12.30 | 1.11 | K1V | 240 | 6.5 | -22.1 | -13.6 | -6.2 | 50.4 | -139.6 | -39.1 | 0.88 | K |
| CD-39 5833 | 09 47 19.9 | -40 03 10 | -40.6 | 16.3 | 15.0 | 10.5 | 10.89 | K0V | 260 | 9.0 | -22.2 | -15.7 | -4.6 | -2.1 | -109.5 | 20.0 | 0.92 | T | ||
| HD 85151A | 09 48 43.2 | -44 54 08 | -68.4 | 33.5 | 14.3 | 9.61 | G7V | 220 | 15.3 | -22.3 | -15.8 | -3.9 | 2.5 | -64.8 | 7.7 | 0.92 | T | |||
| HD 85151B | 09 48 43.4 | -44 54 09 | -68.4 | 33.5 | 13.4 | 10.21 | G9V | 250 | 15.3 | -22.3 | -14.9 | -4.0 | 2.5 | -64.8 | 7.7 | 0.84 | T | |||
| CD-65 817 | 09 49 09.0 | -65 40 21 | -32.3 | 19.9 | 7.3 | 19.2 | 2.7388 | 10.17 | 0.75 | G5V | 200 | 7.1 | -22.4 | -13.1 | -4.8 | 37.5 | -134.5 | -22.5 | 0.97 | T,K,D2.0” |
| HD 309851 | 09 55 58.3 | -67 21 22 | -42.4 | 25.7 | 6.6 | 19.8 | 1.8164 | 9.90 | 0.68 | G1V | 170 | 9.2 | -22.5 | -13.2 | -4.5 | 31.8 | -102.6 | -19.0 | 0.98 | K |
| HD 310316 | 10 49 56.1 | -69 51 22 | -43.5 | 13.5 | 4.7 | 16.3 | 3.625 | 10.07 | 0.78 | G8V | 224 | 8.2 | -22.4 | -13.6 | -5.2 | 46.5 | -110.7 | -19.9 | 0.97 | K,D0.6” |
| CP-69 1432 | 10 53 51.5 | -70 02 16 | -32.6 | 12.2 | 3.6 | 55.0 | 1.0305 | 10.66 | 0.71 | G2V | 195 | 6.3 | -22.8 | -13.1 | -3.3 | 61.8 | -144.6 | -26.1 | 0.64 | K |
| (*)CD-42 7422 | 12 06 32.9 | -42 47 51 | -50.3 | -2.5 | 3.3 | 28.3 | 1.984 | 10.66 | 0.92 | K0V | 260 | 8.9 | -21.6 | -15.4 | -4.8 | 43.4 | -96.5 | 37.1 | 0.50 | K |
| CD-74 673 | 12 20 34.4 | -75 39 29 | -109.4 | 4.2 | 2.7 | 7.3 | 3.477 | 10.72 | 1.17 | K3Ve | 230 | 19.5 | -21.7 | -15.5 | -2.8 | 25.8 | -42.9 | -11.5 | 0.75 | K,3,4 |
| CD-75 652 | 13 49 12.9 | -75 49 48 | -62.2 | -31.5 | -0.9 | 20.1 | 2.2743 | 9.67 | 0.76 | G1V | 200 | 12.3 | -22.3 | -13.6 | -6.0 | 47.0 | -63.4 | -18.8 | 0.93 | K |
| HD 129496 | 14 46 21.4 | -67 46 16 | -47.6 | -39.7 | -4.8 | 88.0 | 8.78 | 0.60 | F7V | 150 | 11.1 | -22.5 | -13.6 | -5.9 | 61.6 | -64.9 | -11.5 | 0.79 | ||
| NY Aps | 15 12 23.4 | -75 15 16 | -73.9 | -73.1 | 3.4 | 10.8 | 4.084 | 9.42 | 0.86 | G9V | 182 | 19.9 | -21.2 | -12.6 | -4.3 | 32.3 | -36.3 | -12.9 | 0.62 | K,H |
| (*)HD 145689 | 16 17 05.4 | -67 56 29 | -50.0 | -84.0 | -9 | 106.4 | 5.95 | 0.18 | A6V | 19.2 | -22.7 | -11.7 | -3.7 | 39.2 | -32.4 | -11.2 | 0.68 | H,5,6,7 | ||
| CD-52 9381 | 20 07 23.8 | -51 47 27 | 85.9 | -143.9 | -13.3 | 42.0 | 0.8368 | 10.59 | 1.52 | K6Ve | 60 | 33.6 | -22.4 | -14.8 | -4.2 | 24.4 | -5.7 | -16.0 | 0.80 | K |
1Data in italics are from the literature as follows: H = data from Hipparcos; T = data from TYCHO; K = data from Kiraga (2012); (1) Riedel et al. (2011); (2) Desidera et al. (2011a); (3) SB1, Porb=613.9d Guenther et al. (2007); (4) Covino et al. (1997); (5) Brown dwarf at 6.7” Huélamo et al. (2010); (6) Zuckerman et al. (2011); (7) Díaz et al. (2011).
Entries marked (*) are new inclusions previously not listed by Torres et al. (2008).
| Name | Vsini | Pphot | B-V or | SpT | ELi | Prob | notes | |||||||||||||
|---|---|---|---|---|---|---|---|---|---|---|---|---|---|---|---|---|---|---|---|---|
| 2000 | 2000 | mas yr-1 | km s-1 | days | mÅ | mas | km s-1 | pc | ||||||||||||
| (*)PMM 5314 | 08 28 34.6 | -52 37 04 | -24.1 | 22.7 | 13.4 | 63.0 | 10.40 | 0.45 | 7.1 | -21.7 | -12.2 | -6.3 | -2.5 | -138.5 | -19.6 | 0.92 | ||||
| PMM 7422 | 08 28 45.6 | -52 05 27 | -22.6 | 24.6 | 14.8 | 33.0 | 1.515 | 10.49 | 0.69 | G6 | 233 | 7.2 | -22.1 | -13.7 | -4.8 | -3.5 | -137.1 | -18.6 | 1.00 | K |
| PMM 7956 | 08 29 51.9 | -51 40 40 | -23.0 | 18.8 | 15.3 | 13.8 | 10.62 | 0.98 | e | 289 | 6.5 | -21.3 | -13.8 | -7.7 | -4.6 | -152.7 | -19.7 | 0.71 | ||
| PMM 6974 | 08 34 18.1 | -52 15 58 | -22.6 | 23.0 | 15.2 | 5.2 | 7.80 | 12.26 | 1.04 | 74 | 6.9 | -22.1 | -14.4 | -5.1 | -2.1 | -143.5 | -18.0 | 1.00 | 1 | |
| PMM 4280 | 08 34 20.5 | -52 50 05 | -21.0 | 22.5 | 12.3 | 16.0 | 10.34 | 0.67 | G5 | 151 | 6.6 | -22.1 | -11.7 | -4.3 | -0.9 | -151.0 | -19.8 | 0.90 | ||
| PMM 6978 | 08 35 01.2 | -52 14 01 | -23.3 | 22.3 | 15.2 | 7.1 | 5.1 | 12.07 | 1.02 | 179 | 6.9 | -22.0 | -14.3 | -5.7 | -2.0 | -143.6 | -17.7 | 1.00 | 1 | |
| PMM 2456 | 08 35 43.7 | -53 21 20 | -23.6 | 24.3 | 14.8 | 48.0 | 12.20 | 0.92 | K3e | 301 | 7.2 | -22.1 | -14.3 | -5.0 | 0.5 | -138.0 | -18.4 | 1.00 | ||
| PMM 351 | 08 36 24.2 | -54 01 06 | -24.4 | 20.7 | 15.4 | 90.0 | 1.923 | 10.18 | 0.57 | G0 | 90 | 6.8 | -21.6 | -14.8 | -7.3 | 2.0 | -146.2 | -20.3 | 0.92 | 1 |
| PMM 3359 | 08 36 55.0 | -53 08 34 | -23.1 | 23.6 | 14.7 | 8.2 | 3.840 | 11.51 | 0.76 | 226 | 7.0 | -22.1 | -14.2 | -4.9 | 0.3 | -141.6 | -18.2 | 1.00 | 1 | |
| PMM 5376 | 08 37 02.3 | -52 46 59 | -20.8 | 20.9 | 15.6 | 9.8 | 14.30 | 1.37 | e | 0 | 6.3 | -22.1 | -15.0 | -5.1 | -0.4 | -158.2 | -19.7 | 1.00 | ||
| PMM 4324 | 08 37 47.0 | -52 52 12 | -22.4 | 22.0 | 14.3 | 41.0 | 9.66 | 0.53 | F5V | 97 | 6.7 | -22.1 | -13.8 | -5.2 | 0.0 | -148.9 | -18.5 | 0.97 | ||
| PMM 665 | 08 37 51.6 | -53 45 46 | -21.1 | 22.7 | 14.5 | 7.9 | 4.510 | 11.35 | 0.75 | G8e | 189 | 6.5 | -22.2 | -14.3 | -4.4 | 1.9 | -151.7 | -20.2 | 1.00 | 1 |
| PMM 4336 | 08 37 55.6 | -52 57 11 | -23.0 | 24.9 | 15.6 | 8.0 | 0.371 | 11.55 | 0.98 | G9 | 7.2 | -22.2 | -15.2 | -4.3 | 0.1 | -137.9 | -17.2 | 1.00 | 1,2 | |
| PMM 4362 | 08 38 22.9 | -52 56 48 | -23.5 | 22.4 | 15.4 | 9.0 | 3.93 | 10.95 | 0.74 | 191 | 6.9 | -22.0 | -14.7 | -5.6 | 0.2 | -144.1 | -17.8 | 1.00 | 1,2 | |
| PMM 4413 | 08 38 55.7 | -52 57 52 | -22.3 | 21.6 | 14.4 | 8.6 | 5.05 | 10.31 | 0.74 | 62 | 163 | 6.6 | -22.1 | -13.9 | -5.2 | 0.4 | -150.9 | -18.5 | 1.00 | 1,2,3 |
| PMM 686 | 08 39 22.6 | -53 55 06 | -21.3 | 21.7 | 15.2 | 12.7 | 4.41 | 12.63 | 1.04 | e | 215 | 6.4 | -22.1 | -15.1 | -4.9 | 2.6 | -155.1 | -20.4 | 1.00 | 1 |
| PMM 4467 | 08 39 53.0 | -52 57 57 | -21.1 | 19.3 | 15.2 | 12.6 | 3.85 | 11.86 | 0.91 | K0(e) | 190 | 6.1 | -21.9 | -14.7 | -5.9 | 0.7 | -164.0 | -19.8 | 1.00 | 1,2,4 |
| PMM 1083 | 08 40 06.2 | -53 38 07 | -20.0 | 23.4 | 12.2 | 67.9 | 1.333 | 10.45 | 0.69 | G0 | 162 | 6.5 | -22.2 | -12.2 | -2.9 | 2.1 | -152.6 | -19.4 | 0.92 | 1,2,4 |
| PMM 8415 | 08 40 16.3 | -53 56 29 | -25.7 | 24.9 | 15.7 | 20.7 | 11.84 | 0.94 | G9(e) | 302 | 7.6 | -22.1 | -15.3 | -5.2 | 0.6 | -131.2 | -15.7 | 1.00 | 2,4 | |
| PMM 1759 | 08 40 18.3 | -53 30 29 | -26.2 | 21.2 | 13.5 | 3.8 | 13.54 | 1.53 | K4e | 55 | 7.1 | -21.6 | -13.0 | -7.0 | 1.8 | -139.1 | -17.4 | 0.94 | 2,4 | |
| PMM 1142 | 08 40 49.1 | -53 37 45 | -18.4 | 23.6 | 14.0 | 7.3 | 11.08 | 0.80 | G1 | 6.3 | -22.1 | -14.2 | -2.0 | 2.4 | -156.4 | -19.6 | 0.91 | 2 | ||
| PMM 1174 | 08 41 22.7 | -53 38 09 | -23.6 | 22.7 | 13.5 | 60.0 | 9.54 | 0.43 | F3V | 79 | 6.9 | -22.1 | -13.3 | -5.1 | 2.3 | -144.2 | -18.0 | 1.00 | ||
| PMM 4636 | 08 41 57.8 | -52 52 14 | -24.0 | 23.9 | 13.6 | 4.9 | 5.80 | 13.57 | 1.55 | K7e | 100 | 7.2 | -22.2 | -13.3 | -4.5 | 0.9 | -138.8 | -16.0 | 1.00 | 1,2,4 |
| PMM 756 | 08 43 00.4 | -53 54 08 | -23.5 | 20.4 | 15.9 | 16.5 | 3.14 | 11.16 | 0.68 | G9 | 217 | 6.5 | -21.8 | -15.7 | -6.4 | 3.4 | -152.1 | -18.9 | 0.98 | 1 |
| PMM 5811 | 08 43 17.9 | -52 36 11 | -21.3 | 21.6 | 14.3 | 59.0 | 9.16 | 0.37 | F2V | 107 | 6.4 | -22.2 | -14.0 | -4.2 | 0.7 | -155.0 | -17.0 | 0.97 | ||
| PMM 2888 | 08 43 52.3 | -53 14 00 | -25.3 | 20.2 | 15.0 | 66.5 | 9.76 | 0.56 | F5 | 6.9 | -21.6 | -14.6 | -7.0 | 2.1 | -144.7 | -16.6 | 0.96 | 2 | ||
| PPM 2012 | 08 43 59.0 | -53 33 44 | -24.7 | 25.1 | 13.9 | 17.4 | 2.210 | 11.67 | 0.90 | K0(e) | 251 | 7.4 | -22.2 | -13.9 | -4.3 | 2.6 | -134.5 | -15.9 | 1.00 | 1,2,4 |
| PMM 4809 | 08 44 05.2 | -52 53 17 | -21.3 | 19.7 | 13.8 | 17.5 | 2.600 | 10.85 | 0.75 | G3(e) | 175 | 6.1 | -22.1 | -13.5 | -5.2 | 1.6 | -162.6 | -18.0 | 1.00 | 1,2 |
| PMM 1373 | 08 44 10.2 | -53 43 34 | -23.3 | 24.4 | 14.6 | 7.0 | 5.38 | 12.25 | 0.96 | 156 | 7.1 | -22.2 | -14.7 | -4.0 | 3.1 | -140.5 | -16.8 | 1.00 | 1 | |
| PMM 5884 | 08 44 26.2 | -52 42 32 | -21.4 | 17.5 | 14.5 | 13.9 | 3.03 | 11.46 | 0.84 | G9(e) | 225 | 5.8 | -21.8 | -14.1 | -6.5 | 1.4 | -170.2 | -18.4 | 0.98 | 1,2,4 |
| PMM 4902 | 08 45 26.9 | -52 52 02 | -25.2 | 23.4 | 14.7 | 7.7 | 4.820 | 12.76 | 1.24 | K3e | 204 | 7.2 | -22.1 | -14.5 | -5.1 | 1.6 | -137.5 | -14.8 | 1.00 | 1,2,4 |
| PMM 6811 | 08 45 39.1 | -52 26 00 | -24.4 | 24.8 | 17.4 | 90.0 | 0.653 | 9.91 | 0.60 | F8 ) | 137 | 7.3 | -22.2 | -17.2 | -4.2 | 0.9 | -135.4 | -13.9 | 0.96 | 2 |
| PMM 2182 | 08 45 48.0 | -53 25 51 | -22.4 | 22.2 | 14.7 | 78.0 | 1.437 | 10.22 | 0.57 | 187 | 6.6 | -22.2 | -14.7 | -4.4 | 3.1 | -150.4 | -17.0 | 1.00 | 1 | |
1Data mainly from Platais et al. (2007); those in italics are from other literature sources as indicated (for proper motions, data in italics are from Platais et al. (2007), otherwise from UCAC4; for color indices, data in italics represent V-IC.):
K = data from Kiraga (2012); (1) Desidera et al. (2011b); (2) Patten & Simon (1996); (3) SB2, Porb=90.617d Platais et al. (2007)
(4) Randich et al. (2001).
The entry marked (*) is a new inclusion previously not listed by Torres et al. (2008).
2.2 Kinematics and ages of IC 2391 and the Argus Association
The Argus association was easily discovered in the SACY survey due to its
special U velocity of km s-1 as illustrated in Figure 2 of Torres et al. (2008).
The evidences presented in Torres et al. (2008) strongly suggested that the Argus association and IC 2391 have a common origin.
We have updated the SACY catalog in order to be able to test if members proposed by Desidera et al. (2011a),
Zuckerman et al. (2011), and Riedel et al. (2011) could be converged in to the IC2391 and Argus association member list.
Newly obtained data presented in this paper were also used.
The convergence was done using the new reduction of Hipparcos (van Leeuwen, 2007), the new proper motion catalog UCAC4 (Zacharias et al., 2012)
and the ASAS photometric survey (Kiraga, 2012), for V and V-I colors, for stars not observed by us.
We did not change the published proper motions for stars in the Hipparcos catalogue, and for double stars in UCAC4 with separations between about 1″ to 10″ because the image de-blending process in UCAC4 seems unreliable.
As we did in (Torres et al., 2008), we correct the photometric values for duplicity where possible. Note for the pair HD 85151A/B, there are no individual proper motions in Tycho-2. Therefore we used the primary proper motions for both stars. Our spectroscopic observations and the visual binary measurements from the Washington Double Star catalogue suggest they must be a physical pair.
The data for IC 2391 members are mainly from Platais et al. (2007) but using UCAC4 proper motions, except for double stars where we use Platais et al. (2007) and Torres et al. (2008) proper motions due to image de-blending issues with UCAC4 as explained above. There are 41 cluster stars with all kinematical data. Except for PMM 4413 whose systemic
velocity is known, all other 20 known spectroscopic binaries were excluded from the study.
In Table 1 and Table 2 we list the high probability members proposed for the Argus
association stars and the open cluster IC 2391 respectively, obtained by applying the convergence method for both association and cluster stars together.
We present a total of 65 high probability members which comprise of 32 Argus association stars and 33 IC 2391 members. We accept probabilities
down to about 50 percent as the stellar system is formed by the concentrated IC 2391 cluster and the
widely scattered association stars around it, thus forming a spatial distribution that is far from gaussian. When we apply the convergence criteria on the association stars alone (without including IC 2391 members), then the probabilities of the association members increase significantly with the lowest membership probability being about 70 percent.)
In order to test the true kinematical connection between IC 2391 and the Argus association stars,
we also applied our convergence test to the two groups independently.
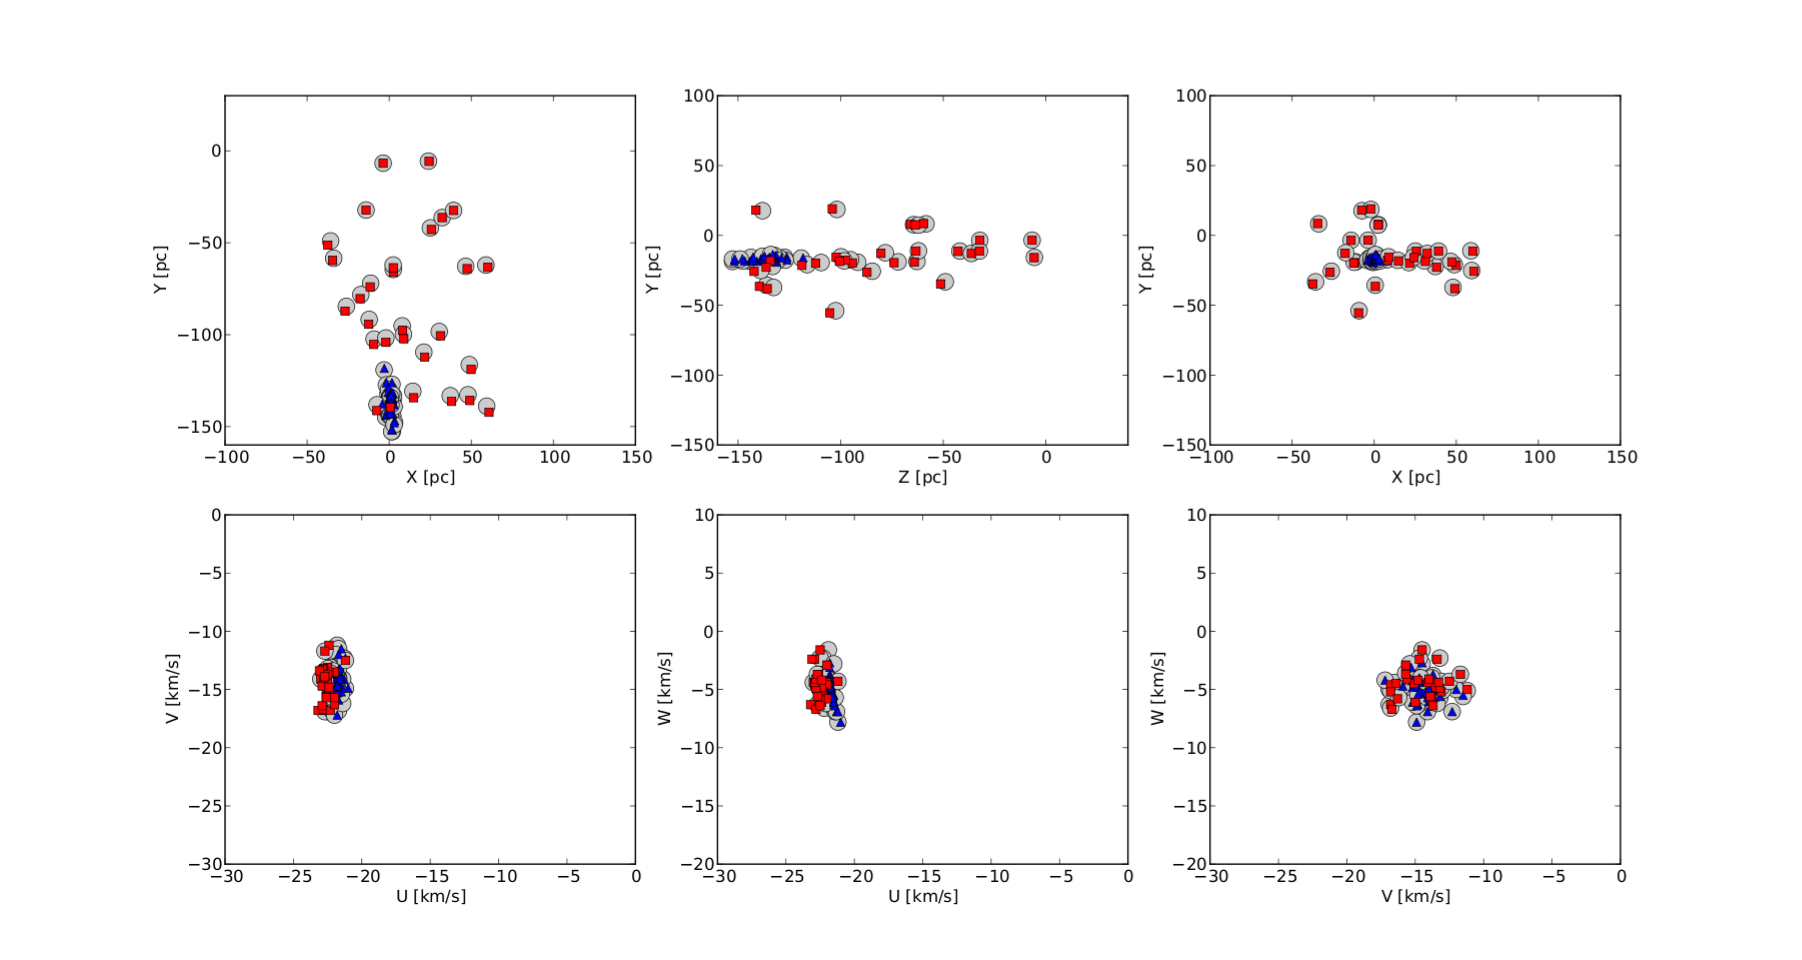
The results are presented in Table 3 and in Figure 1. 1
The convergence method resulted in a near perfect match between the kinematics of IC 2391 stars and those of the Argus association stars from Torres et al. (2003). The velocities of the two samples agree well within the errors.
To give a better idea of the variations in the final values when
the Argus association stars are considered together with the IC 2391 members, we have over-plotted the results obtained
for the Argus field stars only (red squares), and the
IC 2391 members only (blue triangles), with those obtained when the two groups are considered as one single association (gray circles).
No significant difference is found.
| Sample | Distance [mas] | U [km/s] | V [km/s] | W [km/s] | N. members | Age [Myr] |
|---|---|---|---|---|---|---|
| Argus only (field) | 15.5 19.9 | -22.6 0.4 | -14.6 1.5 | -5.0 1.2 | 32 | 26 |
| IC 2391 | 6.9 0.4 | -21.7 0.6 | -14.2 1.0 | -5.1 1.2 | 33 | 26 |
| Argus & IC 2391 | 11.2 14.5 | -22.1 0.4 | -14.4 1.3 | -5.0 1.2 | 65 | 26 |
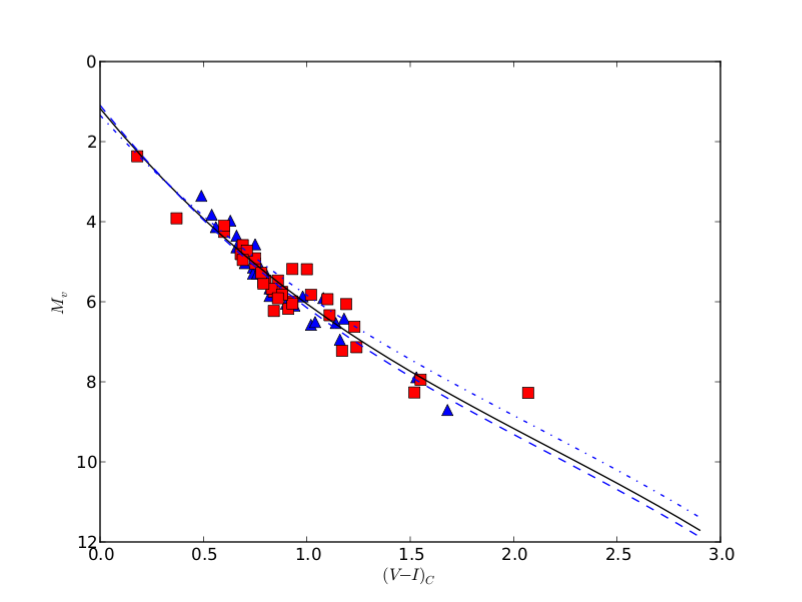
Also as shown in Table 3 no significant difference is found in the ages of the two groups. Figure 2 shows that the position of the Argus association in the HR diagram is consistent with a unique isochrone of 30 Myr 10 Myr, which is comparable to our obtained age of about 26 Myr. Our ages are from third degree polynomial isochorne curves (Torres et al., 2008) based on some well observed star groups and compared partially with Siess et al. (2000). As they are not strictly calibrated, we must take these heuristic ages with caution, but of course the relative ages are more reliable. These results imply that both samples have the same age. Additionally, da Silva et al. (2009) computed Li abundances for all SACY associations and showed that the Lithium Depletion Pattern for the Argus association (defined by fitting the Li abundance as a function of effective temperature), fits well in a time sequence of the SACY associations with no difference between the Argus association stars and the IC 2391 members.
2.3 Comments on excluded stars
Table 1 and Table 2 are not the same as those presented in Torres et al. (2008),
as we used updated data and applied a new statistical model. Below we comment on the excluded stars.
For the Argus association sample, 3 stars were excluded from the list of Torres et al. (2008). Star BW Phe was eliminated on kinematical grounds, star CD-49 1902 was eliminated for having too large value in Z and star HD 84075 has a U velocity well outside of the Argus association range.
For the IC 2391 sample, 3 stars were excluded from the list of Torres et al. (2008). PMM 1560 and PMM 1820 were eliminated due to low membership probabilities based on kinematics. For PMM 3695 the proper motions are significantly distinct between Platais et al. (2007) and UCAC4, for unclear reasons.
3 Elemental Abundances
3.1 High resolution observations
In order to further explore the connection between the open cluster IC 2391 and the Argus association, we examine their elemental abundances. High resolution and high signal-to-noise spectra of members of the Argus association and IC 2391 were observed using
VLT-UVES in the framework of program ID 082.C-0218 (PI Melo). Observations were undertaken in service
mode using the UVES DIC#1 (390+580nm) standard setting with a 0.8arcsec slit to achieve a spectral resolving power of R=60,000.
The typical S/N ratio was 100 per pixel at 600 nm. The data were reduced with the latest UVES ESO-MIDAS pipeline.
The resulting spectra were normalised using the task
in the IRAF222IRAF is distributed by the National Optical Astronomy Observatory, which is operated
by the Association of Universities for Research in Astronomy, Inc., under cooperative agreement with the National Science Foundation. package.
We carry out a detailed elemental abundance analysis of six Argus association stars and eight IC 2391 stars with vsini 10 . The other stars showed broadened spectral lines which meant there was greater blending between the lines, making individual line analysis more uncertain. Table 4 lists the sample of stars analysed in this study together with their measured properties.
3.2 Abundance analysis
The elemental abundances were derived based on equivalent width (EW) measurements and spectral synthesis,
making use of the latest version of the MOOG code (Sneden, 1973).
The EWs were measured using the automated ARES code (Sousa et al., 2007) with frequent manual checking of the EWs.
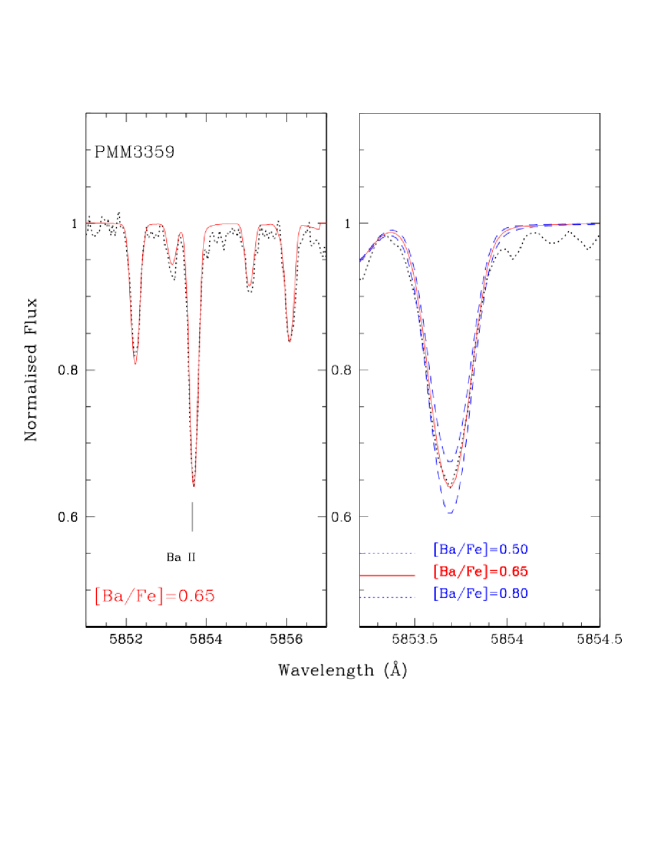
Ba abundances were derived from the 5853 Å line (which is known to be strong, isolated, un-blended and not affected by NLTE effects,
e.g., Mashonkina et al. (2007)) using the driver synth in MOOG.
We retrieved hyperfine structure data from McWilliam et al. (1995), adopting an isotopic solar mixture of
81% (134Ba +136Ba +138Ba) and 19% (135Ba +137Ba).
An example of the synthesis of the Ba ii line at 5853 Å is provided in Figure 3 for one of our sample stars (PMM 3359).
Interpolated Kurucz model atmospheres based on the ATLAS9 code (Castelli et al., 1997) with no convective overshooting were used throughout this study.
We carried out the abundance analysis relative to the solar spectrum, taken with the same instrument and the same resolution of our sample stars.
The full lines list, atomic data adopted and measured equivalent widths of a sample star (PMM 3359) can be found in Appendix A.
We derive the stellar parameters based on spectroscopy. Abundances for all Fe i and ii lines were computed from the measured EWs.
Effective temperature () was derived by requiring excitation equilibrium of the Fe i lines.
Microturbulence was derived from the condition that abundances from Fe i lines show no trend with EW.
Surface gravity (log ) was derived via ionisation equilibrium, i.e. requiring the abundances from Fe i lines to equal those from Fe ii lines.
For stars cooler than 5500 K, we adopted a log value of 4.5, which is consistent with the cluster age.
We did not attempt to optimize log via ionisation equilibrium for the cool stars because of the known over-ionisation
effects (e.g., Schuler et al. (2010), see Section 3.4 for further discussion).
The final adopted stellar parameters and the elemental abundances are given in Table 4.
3.3 Error budget
Chemical abundances are mainly affected by two kinds of uncertainties, namely errors due to the EW measurements
or to the best-fit determination (in the case of spectral syntheses), and errors due to the stellar parameters (Teff, log, and ).
The impact of the uncertainties on the atomic parameters, i.e. log , should be instead almost negligible since our analysis is
strictly differential with respect to the Sun (see Section 3.2).
Concerning the EW analysis, random errors in the [Fe/H] ratios due to EW measurements are well represented by the standard deviation (rms)
from the mean abundance based on the whole set of lines,
while the ones for the [X/Fe] ratios were computed by quadratically adding the rms for [Fe/H] and rms for [X/H].
Errors due to stellar parameters were estimated by varying one parameter at a time, and checking the corresponding variation
in the resulting abundance.
We adopted variations of 50 K in Teff and 0.15 kms-1 in , because larger changes in those quantities
would have introduced a significant trend of (Fe) the excitation potentials and the line strength, respectively.
For stars for which we could optimise the surface gravities,
the uncertainties in were estimated by varying this quantity until the difference between (Fei)
and (Feii) is larger than 0.1 dex, i.e.
the ionisation equilibrium condition is no longer satisfied.
The typical error in log was from 0.1 to 0.15.
The final errors are then obtained by quadratically summing errors due to the EW measurements and the ones due to stellar parameters
(see Table 4).
Focusing on abundances derived from spectral syntheses, we have errors due to the best-fit determination of typically 0.1 dex, reflecting uncertainties due to the continuum placement and to the strong nature of the Ba features; similarly, since we are dealing with a very strong transition line, the errors due to stellar parameters are dominated by the microturbulence values ([Ba/Fe]=0.05-0.07 dex for changes of 0.15 ), while the effective temperatures and gravities have a minor impact, i.e. within 0.03 dex.
3.4 Abundance results
Final abundances are reported in Table 4, where stellar parameters (Teff, log, )
and [X/Fe] ratios along with the corresponding errors are provided for all our sample stars.
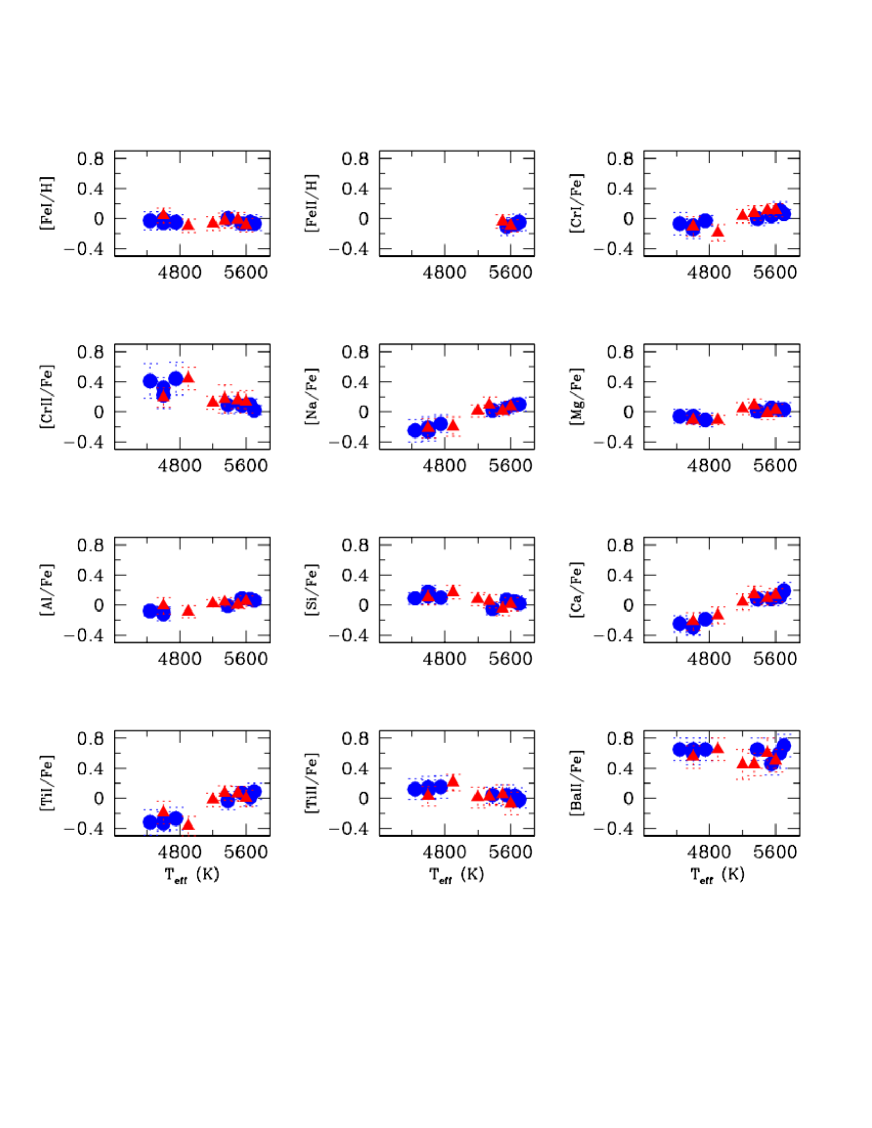
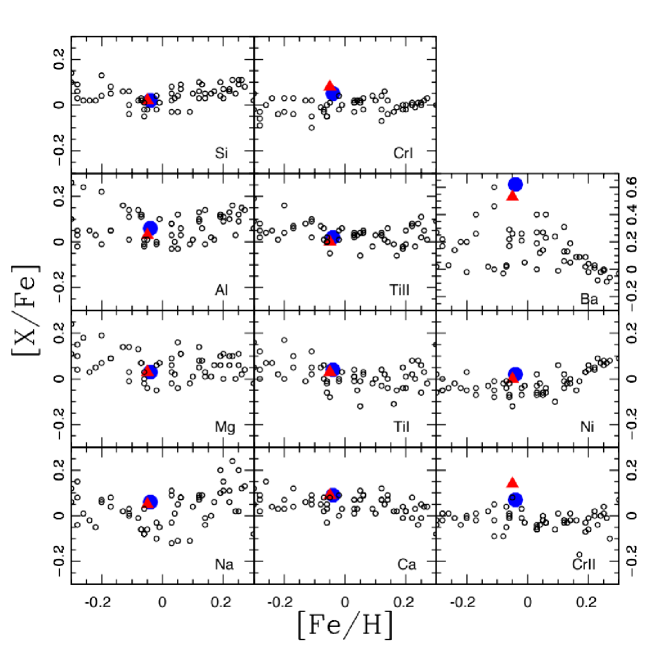
In Figure 4 we show the [X/Fe] ratios as a function of the effective temperatures
for both IC 2391 (filled circles) and the Argus association (triangles).
The first evidence coming out from these plots is that
we confirm previous findings by Schuler et al. (2003, 2004); Shen et al. (2005); D’Orazi & Randich (2009); Schuler et al. (2010); Biazzo et al. (2011):
over-ionisation/excitation effects are at work
for stars cooler than Teff5200 K.
The photospheric abundances of Ca, Na, and Ti (from the Ti i lines)
show the most dramatic effect of this phenomenon, being
about 0.20.3 dex lower in the cooler stars; similarly, Al and Cr (from the Cr i lines)
seem to show the same effect, although to a lesser extent.
Because we could also measure abundances for Cr and Ti from their first-ionisation stage transitions,
we can confirm that we are observing an over-ionisation phenomenon: as can be seen in Table 4,
abundances from Ti ii and Cr ii lines result in larger values for the cooler stars, where the [X/Fe] ratios
are enhanced up to 0.4 dex (see the [Cr ii/Fe] in the most extreme cases, e.g., PMM 4902 in IC 2391 or TYC 8561-0907-1 in Argus association).
This fact reflects a pumping of the electrons
to the ionised stage because of the strong UV flux coming from the hot chromospheres
(we refer the reader to Schuler et al. (2003, 2010); D’Orazi & Randich (2009) for a more
detailed discussion on this topic).
Si deserves special attention since we found an over-excitation effect
(all the employed lines have high excitation potentials, i.e. 4.92 5.98 eV) acting on the cooler stars,
that was also previously detected by Schuler et al. (2003) in M34, but not by D’Orazi & Randich (2009).
Over-ionisation/excitation effects are also observed in the cool field stars (see e.g., Allende Prieto et al. (2008)). Note that no temperature effects were observed for the Ni abundances in either the IC 2391 or the Argus association stars. Therefore the Ni abundance is not plotted in Figure 4.
Due to the over-ionisation effects, the mean abundances and the associated rms error were computed considering all the stars for
Fe i, Mg, Ni, and Ba, while we considered only the warmer stars ( 5200K) when averaging [X/Fe] ratios for Na, Al, Si, Ca, Ti and Cr (see Table 4). We found average metallicity of [Fe/H]=0.040.03 and [Fe/H]=0.050.04 for IC 2391 and Argus association,
respectively: the cluster and the association exhibit a solar metallicity, with no evidence of internal scatter
(the rms is significantly smaller than the observational uncertainties).
Moreover, all the other (Mg, Si, Ca, and Ti), odd- (Na, Al), and iron-peak elements show solar ratios,
pointing out that the cluster and the association are indistinguishable concerning their chemical composition
(see Section 4 for a discussion on the scientific implication of our results).
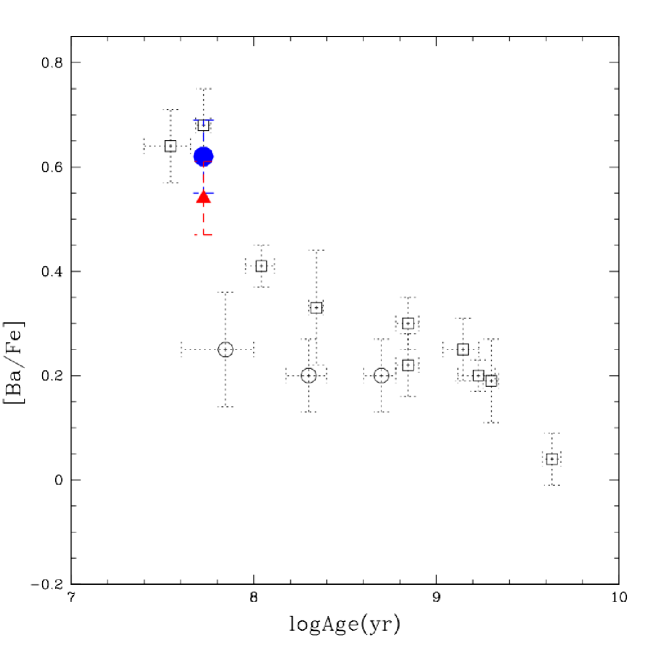
Ba is notably over-abundant, with a mean of [Ba/Fe]=0.620.07 (IC 2391) and [Ba/Fe]=0.530.08 (Argus association). The slightly higher variation across the two stellar aggregates mainly reflect the larger uncertainties affecting Ba abundances. The Ba line feature is close to the saturation regime in the curve of growth, and as a consequence it is highly sensitive to the adopted microturbulence values. The extremely high Ba content that we obtained for our sample stars is not surprising and confirms previous measurements (see Section 4). We stress, in passing, that over-ionisation effects can be ruled out as a possible explanation given that, at the effective temperatures of our sample stars, Ba is almost totally ionised. Further the possibility of NLTE effects is minimal as the 5853 line used in this study is not known to be affected by NLTE effects (Mashonkina et al. (2007)).
| star | RV | vsini | Teff | logg | [Fe i/H] | [Fe ii/H] | [Na/Fe] | [Mg/Fe] | [Al/Fe] | [Si/Fe] | [Ca/Fe] | [Ti i/Fe] | [Ti ii/Fe] | [Cr i/Fe] | [Cr ii/Fe] | [Ni/Fe] | [Ba ii/Fe] | |
|---|---|---|---|---|---|---|---|---|---|---|---|---|---|---|---|---|---|---|
| (K) | kms-1 | |||||||||||||||||
| IC 2391 | ||||||||||||||||||
| PMM 4902 | 14.7 | 7.10 | 4440 | 4.5 | 1.3 | 0.030.12 | ……. | 0.250.15 | 0.060.09 | 0.080.06 | 0.090.08 | 0.250.11 | 0.320.17 | 0.120.14 | 0.070.15 | 0.410.23 | 0.030.09 | 0.650.15 |
| PMM 6974 | 15.1 | 4.99 | 4600 | 4.5 | 1.2 | 0.060.08 | ……. | 0.210.14 | 0.060.09 | 0.090.04 | 0.170.09 | 0.290.10 | 0.330.09 | 0.140.15 | 0.140.13 | 0.320.14 | 0.030.10 | 0.600.15 |
| PMM 6978 | 15.4 | 6.77 | 4600 | 4.5 | 1.1 | 0.010.10 | ……. | 0.260.13 | 0.070.05 | 0.120.09 | 0.120.10 | 0.290.11 | 0.310.13 | 0.110.13 | 0.100.09 | 0.220.18 | 0.030.09 | 0.650.15 |
| PMM 1373 | 13.9 | 6.68 | 4750 | 4.5 | 1.2 | 0.050.10 | ……. | 0.160.12 | 0.110.09 | ……. | 0.100.09 | 0.190.09 | 0.270.15 | 0.150.15 | 0.030.07 | 0.440.22 | 0.020.10 | 0.650.15 |
| PMM 3359 | 14.7 | 7.88 | 5380 | 4.5 | 1.2 | 0.000.10 | ……. | 0.020.08 | 0.010.07 | 0.010.07 | 0.050.08 | 0.080.10 | 0.030.12 | 0.040.11 | 0.000.09 | 0.090.12 | 0.030.11 | 0.650.15 |
| PMM 665 | 14.6 | 7.47 | 5550 | 4.5 | 1.6 | 0.070.08 | 0.110.12 | 0.050.08 | 0.050.09 | 0.090.04 | 0.070.07 | 0.080.09 | 0.070.09 | 0.040.14 | 0.030.09 | 0.080.09 | 0.030.09 | 0.460.15 |
| PMM 4362 | 15.1 | 8.61 | 5650 | 4.3 | 1.4 | 0.050.10 | 0.080.09 | 0.090.07 | 0.030.08 | 0.080.04 | 0.050.07 | 0.110.09 | 0.010.11 | 0.030.11 | 0.110.11 | 0.100.07 | 0.020.11 | 0.600.20 |
| PMM 1142 | 14.0 | 6.71 | 5700 | 4.3 | 1.5 | 0.070.09 | 0.050.11 | 0.100.09 | 0.030.09 | 0.060.04 | 0.020.06 | 0.080.09 | 0.090.11 | 0.020.11 | 0.060.06 | 0.020.06 | 0.010.10 | 0.700.15 |
| AVERAGE rms | 0.040.03 | 0.080.03 | 0.060.04 | 0.030.02 | 0.060.05 | 0.020.05 | 0.090.02 | 0.040.06 | 0.020.03 | 0.050.05 | 0.070.04 | 0.020.03 | 0.620.07 | |||||
| ARGUS | ||||||||||||||||||
| CD74 673 | 4.8 | 7.28 | 4600 | 4.5 | 1.3 | 0.040.10 | ……. | 0.220.13 | 0.110.06 | 0.010.11 | 0.100.10 | 0.220.12 | 0.190.15 | 0.030.13 | 0.110.13 | 0.190.13 | 0.010.11 | 0.550.15 |
| TYC 8561-0907-1 | 15.6 | 4.41 | 4900 | 4.5 | 1.2 | 0.100.09 | ……. | 0.200.13 | 0.110.06 | 0.090.08 | 0.170.09 | 0.140.11 | 0.370.13 | 0.210.11 | 0.190.11 | 0.440.15 | 0.010.09 | 0.650.15 |
| CD42 2906 | 23.5 | 10.35 | 5200 | 4.5 | 1.6 | 0.070.09 | ……. | 0.010.08 | 0.040.08 | 0.020.05 | 0.080.09 | 0.040.11 | 0.020.09 | 0.010.14 | 0.030.09 | 0.120.09 | 0.020.06 | 0.450.20 |
| NY Aps | -3.2 | 10.95 | 5340 | 4.5 | 1.5 | 0.030.10 | ……. | 0.090.11 | 0.080.09 | 0.040.06 | 0.050.09 | 0.140.11 | 0.070.10 | 0.020.11 | 0.070.10 | 0.170.19 | 0.030.07 | 0.450.15 |
| CD39 5833 | 14.9 | 10.17 | 5500 | 4.6 | 1.6 | 0.020.10 | 0.040.09 | 0.010.06 | 0.020.08 | 0.000.05 | 0.050.09 | 0.090.09 | 0.060.10 | 0.050.13 | 0.110.06 | 0.150.11 | 0.000.07 | 0.600.20 |
| CD28 3434 | 26.8 | 6.36 | 5600 | 4.3 | 1.5 | 0.090.09 | 0.100.08 | 0.070.07 | 0.020.08 | 0.050.07 | 0.010.09 | 0.130.09 | 0.000.11 | 0.070.15 | 0.110.09 | 0.130.15 | 0.000.06 | 0.500.15 |
| AVERAGE rms | 0.050.05 | 0.070.04 | 0.050.04 | 0.030.04 | 0.030.02 | 0.020.06 | 0.090.05 | 0.030.04 | 0.000.05 | 0.080.04 | 0.140.02 | 0.000.02 | 0.530.08 |
3.5 Comparison with previous abundance studies
The chemical composition of IC 2391 has been previously determined by two different studies,
namely Platais et al. 2007 (P07) and D’Orazi & Randich (2009).
In P07, the authors presented iron abundances for a sample of four G-type members, obtaining an average metallicity
of [Fe/H]=0.050.05, which is in very good agreement with our estimate.
Three out of four P07 stars are in common with our study, i.e., PMM 3359, PMM 665, and PMM 4362;
the differences in effective temperatures are Teff(ourp07)=100 K, 99 K, and 34 K, respectively,
while gravities agree within 0.05 dex. Microturbulence values agree very well for the star PMM 3359 (=0.03 km s-1)
and PMM 4362 (=0.1 km s-1), while P07 derived a slightly lower value for the star PMM 665,
i.e., 1.25 km s-1 to be compared with our estimate of 1.60 km s-1.
D’Orazi & Randich (2009) presented abundances of Na, (Si, Ca, and Ti), and iron-peak elements
(Fe, and Ni) for a sample of seven IC 2391 G/K-type members.
They found the following average values: [Fe/H]=0.010.02, [Na/Fe]=0.020.03, [Si/Fe]=0.010.02,
[Ca/Fe]=0.020.01, [Ti i/Fe]=0.000.02, [Ti ii/Fe]=0.140.13, and [Ni/Fe]=0.000.02.
Comparing their results with our mean abundances (see Table 4) we can conclude
that the two studies are in excellent agreement; the only exception
is the Ti abundances derived from the Ti ii lines, for which they obtained a 0.12 dex higher value.
Note that their [Ti ii/Fe] average was based on all sample stars, including those with over-ionisation effects.
Should we include all sample stars when determining the average, then our abundance estimates would agree well.
Two of our sample stars, PMM 4902 (VXR 76a) and PMM 4362 (VXR 3), were already analysed by D’Orazi & Randich (2009).
In Table 5 we compare our results with the ones by D’Orazi & Randich (2009):
the two determinations agree within their respective uncertainties for all stellar parameters and final abundances. We note that
the higher discrepancy for the Ti abundance from the Ti ii lines is still within the uncertainties,
which are significantly larger in this case (a different set of line list could partially explain such a difference).
The barium abundance for IC 2391 is presented in D’Orazi et al. (2009), where they derived a mean abundance
of [Ba/Fe]=0.680.07, which is in excellent agreement with our value ([Ba/Fe]=0.620.07).
The chemical content of the Argus association was previously determined by Viana Almeida et al. (2009), who gathered Fe, Si and Ni abundances
for a sample of seven members.
They also conclude that the association shows a solar abundance pattern, finding
[Fe/H]=0.030.05333We quote their uncorrected value, and refer the reader to that paper
for details on the trends with effective temperatures among their sample stars., [Si/Fe]=0.030.03, and [Ni/Fe]=0.020.04.
We have four stars in common with the work by Viana Almeida et al. (2009), namely CD-28 3434, CD-42 2906, TYC 8561-0970-1, and CD-38 583.
Differences in Teff are within 100K for all the stars with the exception of TYC 8561-0970-1 for which we derived a Teff=4900 K,
while their final estimate is Teff=5348 K.
However, our final value agrees better with the spectral type K0 found by Torres et al. (2006)
(see Table 1) compared to that by Viana Almeida et al. (2009).
Moreover, while gravity values agree well (with an average difference of 0.125), larger discrepancies are seen for the microturbulence values.
Viana Almeida et al. (2009) derived systematically higher microturbulences (on average about 0.15 kms-1 higher,
which is still in fair agreement within the uncertainties) and noted that their higher values are probably due to
a different set of spectral lines, which might be particularly
sensitive to the strong magnetic field characterising these stars, resulting in larger values.
Whether young pre-main sequence stars exhibit higher microturbulence values is still under discussion
and there is no general consensus on this topic (Steenbock & Holweger (1981); James et al. (2006)).
Finally, [Fe/H], [Si/Fe] and [Ni/Fe] agree well among the two studies, with differences always smaller than 0.1 dex.
| star | Teff | logg | [Fe/H] | [Na/Fe] | [Si/Fe] | [Ca/Fe] | [TiI/Fe] | [TiII/Fe] | [Ni/Fe] | |
|---|---|---|---|---|---|---|---|---|---|---|
| (K) | (kms-1) | |||||||||
| PMM4362 | 565050 | 4.300.10 | 1.400.15 | 0.050.10 | 0.090.07 | 0.050.07 | 0.110.09 | 0.010.11 | 0.030.11 | 0.020.11 |
| PMM4362DR09 | 559060 | 4.450.10 | 1.150.15 | 0.000.08 | 0.020.07 | 0.020.07 | 0.010.05 | 0.000.07 | 0.030.10 | 0.020.07 |
| PMM4902 | 444050 | 4.500.15 | 1.300.15 | 0.030.12 | 0.250.15 | 0.090.08 | 0.250.11 | 0.320.17 | 0.120.14 | 0.030.09 |
| PMM4902DR09 | 434360 | 4.500.10 | 1.200.15 | 0.000.09 | 0.340.11 | 0.060.12 | 0.380.14 | 0.350.17 | 0.370.14 | 0.020.12 |
4 Discussion
4.1 Chemical tagging
Stars born within a single star-forming aggregate share its chemical signature with all stars in the cluster,
where the elemental abundance pattern represents the conditions of the proto-cluster gas cloud.
High resolution studies targeting a large range of chemical elements have confirmed this to be true among several Galactic open clusters (e.g De Silva et al., 2006, 2007a; Pancino et al., 2010).
Indeed the results presented in Table 4 show that the open cluster IC 2391 is also highly chemically homogeneous,
with any abundance scatter being well within the measurement uncertainty.
The technique of chemical tagging proposes to use the elemental abundance patterns of stars to identify dispersed field stars
with their original formation site (Freeman & Bland-Hawthorn, 2002).
Several recent examples show the concept of chemical tagging at work; the HR 1614 moving group (De Silva et al., 2007b),
the Hercules stream (Bensby et al., 2007), the Wolf 630 moving group (Bubar & King, 2010), and the Hyades Supercluster (De Silva et al., 2011; Pompéia et al., 2011).
In all these examples the dispersed stellar system was identified via kinematical information and its reality as a disrupting cluster
was confirmed (or disproved in the case of the Hercules stream) via chemical abundances.
Similarly, the presence of the Argus association was identified by the stellar kinematics in the SACY survey
and has been kinematically associated with the open cluster IC 2391, see Figure 1.
Probing the chemical information of their stars, we show in Table 4, the average elemental abundances
between the open cluster stars and the dispersed members of the Argus association, are almost identical within the uncertainties.
This similarity holds for all studied elements,
which include those formed via the -process, Fe-peak elements formed via nuclear fusion and -process elements
formed via neutron capture.
This seems to support the case that the stars in the Argus association originally formed together with the open cluster IC 2391.
Note that unlike the previous cases of
chemically tagged stellar structures, IC 2391 and the Argus association are young stellar systems, with an age of 30 Myr as presented in Table 3).
We now compare the cluster and association abundances against the solar neighborhood abundances published by Bensby et al. (2005).
As seen in Figure 5, most of the abundances of the studied structures sit well within the solar neighborhood values.
Therefore this lessens the strength of the chemical tagging argument discussed above,
as other field stars may also share a similar chemical abundance pattern as that of the IC 2391.
Applying the method of chemical tagging we consider the number of stars in the Bensby et al. (2005) sample which share
the same abundance pattern as those of IC 2391, with the exception of Ba. Keeping a margin of 0.1 dex
we find that 10 stars out of the 102 in the Bensby et al. (2005) sample could be classed as sharing the same abundance patterns (except Ba).
If we include Ba abundances in the chemical tagging process, then only 1 star in the Bensby et al. (2005) sample share a common chemistry as IC 2391.
Should we adopt a more strict criteria with an abundance margin of 0.05 dex, which is the level of homogeneity seen within bound clusters,
then none of the Bensby et al. (2005) stars share the open cluster abundance pattern, even without considering Ba.
Clearly abundance matching of this form is plagued by systematic effects between different studies.
We await the availability of data from large surveys such as the GALAH survey 444www.aao.gov.au/HERMES/GALAH planned with the HERMES instrument (Barden et al., 2010),
which would be homogeneously observed and analysed, to further expand this field of research.
4.2 Ba abundances
The abundance of Ba, the only analysed -process element in our study, is clearly over-abundant with respect to the field as noted in the discussion above. Similar enhancement in Ba is seen in other young clusters,
including the Hyades cluster and supercluster (De Silva et al. (2006, 2011)). D’Orazi et al. (2009)
detected, in a sample of 20 open clusters, an anti-correlation between the [Ba/Fe] ratios and the cluster age.
While OCs with ages 4 Gyr are characterised by solar Ba abundances, the OCs with ages 100-200 Myr
exhibit an enhancement up to 0.2-0.3 dex.
This increasing trend can be reproduced only if the contribution from low-mass AGBs (1.0M/M⊙1.5)
to the Galactic chemical enrichment is higher than what was previously thought (see D’Orazi et al. (2009); Maiorca et al. (2011) for further details).
Most intriguingly, the younger clusters of their sample (70 Myr) show an even higher Ba content
([Ba/Fe] up to 0.5-0.6 dex), which cannot be explained by this scenario.
It is quite unlikely that an enrichment in the Ba content took place in the last 100 Myr of Galactic evolution,
unless mechanisms of local enrichment are invoked. Similarly,
Desidera et al. (2011a), analysing the star HD 61005 and its possible link to the Argus association,
confirm the same abundance pattern, i.e. the [Ba/Fe] is more than a factor of four above the solar value.
In Figure 6 we report the run of [Ba/Fe] with age for clusters presented
in D’Orazi et al. (2009)555Due to a systematic offset between dwarfs and giants in the D’Orazi et al. (2009) sample,
here we consider, for homogeneity, only clusters whose
abundances come from un-evolved members., for the three young moving groups by D’Orazi et al. (2012),
along with our measurements for IC 2391 and Argus field stars (this study).
As one can see, our values fit the Ba-age relationship very well, confirming that very young open clusters seem to share
an extremely high Ba abundance.
Moreover, the peculiar nature of Ba stands out from the other -process elements: when available,
abundances of Y, Zr (first-peak -process element), and La,Ce
(second-peak -process element) show solar ratios (see
De Silva et al. (2006); Carrera & Pancino (2011) for the Hyades; D’Orazi et al. (2012) for three moving groups AB Doradus, Carina-Near and Ursa-Major).
Since none of the current available models can reproduce such a trend (accounting for an over-production of Ba without a similar
trend in La and/or Ce) we are probably dealing with
several spurious, conspiring effects which mimic a super-solar Ba content.
A wide discussion of this topic is out of the purpose of the present paper
(we refer the reader to D’Orazi et al. (2012)), here we just recall that the presence of hot chromospheres in these young stars might play,
directly or indirectly, a certain role in the
strength of the Ba ii line(s).
4.3 The dissolution of IC 2391
With all present evidence pointing to a common origin of IC 2391 and the Argus association stars, we now explore the likely dissolution mechanism of the original open cluster. Lamers & Gieles (2006) have shown that most of the energy necessary to dissolve a cluster comes from collisions with giant molecular clouds. Depending on the impact parameter and the energy involved in the collision, a halo of stars is left around a central spheric or more oblate core. Qualitatively speaking this is what we see in Figure 1 with the IC 2391 being the core and the Argus association stars as part of the halo (Gieles et al., 2006). The lack of symmetry around the cluster (blue triangles), however, is partially due to the fact that the IC 2391 is on the limit of the SACY survey (Torres et al., 2008) of 150 pc. The second half of the halo being beyond 150 pc.
For a small-N system like IC 2391 a halo of unbound stars can also be the result of ejections of stars from the cluster core due to two-body encounters. Even when the tidal field is weak, clusters lose stars because of close encounters of stars in the cluster.
This process is important for clusters whose age exceeds the half-mass relaxation time .
Based on an estimated half-mass radius of about pc (Dias et al., 2002),
a mass of about 500 (Boudreault & Bailer-Jones, 2009) we use the standard expression for the half-mass relaxation time-scale
of Spitzer & Hart (1971) and find Myr.
Here we assumed the mean mass of the stars to be (i.e. ) and we use as the argument of the Coulomb logarithm.
Although this value for is uncertain to within a factor of two or three, the similarity between
and the age of IC 2391(about 3010 Myr) suggests that it is possible that IC 2391 is dynamically evolved
and has ejected a fraction of its stars. These unbound stars we now observe as the Argus association around the cluster.
It implies that the cluster was smaller and denser in the past (Hénon, 1965; Gieles et al., 2010).
In fact, we can speculatively estimate the initial size and velocity dispersion of the cluster.
The radius of the Argus associations is about 150 pc.
Combined with an age of 30 Myr for IC 2391 this means that the most distant stars must have escaped with a velocity of about 5 .
The typical velocity with which stars escape from an isolated cluster is few , where is the root-mean square velocity of cluster.
So the most distant stars escaped when the cluster had 1-2 .
Combined with the mass this corresponds to a half-mass radius of about 0.2-0.4 pc.
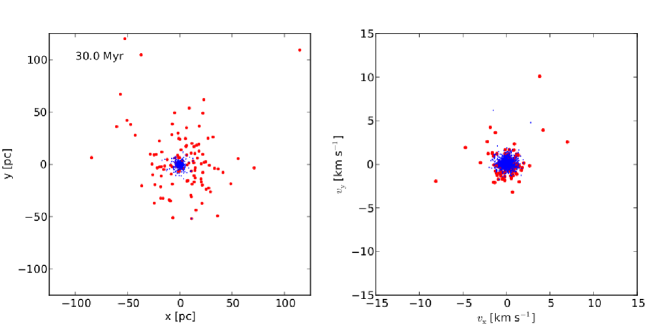
In Fig. 7 we illustrate this idea with the result of an -body simulation of an isolated cluster with an initial =0.25 pc.
After 30 Myr there are unbound stars out to 100 pc away from the cluster, which have velocities of a several .
The current pc and 897 stars are still bound to the cluster, comparable to IC 2391.
This implies that the initial density of IC 2391 was several orders of magnitude higher than the present day density and the initial relaxation time a factor of a few shorter. This could be the explanation for the observed mass segregation in the cluster (Boudreault & Bailer-Jones, 2009). These are of course very rough estimates, because we have ignored the presence of the Galactic tidal field and external factors such as giant molecular clouds.
5 Summary and conclusions
In this paper, we presented the members of the Argus association as identified via the SACY survey and find the age of the system
to be about 3010 Myr.
Based on high resolution UVES spectra we determined the abundances for Fe, Na, Mg, Al, Si, Ca, Ti, Cr, Ni and Ba
in both the open cluster IC 2391 and the Argus association.
All stars in the open cluster and Argus association were found to share similar abundances with the scatter well within the uncertainties,
where [Fe/H] = 0.04 0.03 for cluster stars and
[Fe/H] = 0.06 0.05 for Argus stars. All other elements were in their solar proportions
with the exception of Ba which we observed to be enhanced to around 0.6 dex. We also discussed the effects of
over-ionisation/excitation observed in our sample for stars cooler than about 5200 K, as has been previously noted in the literature.
In summary we present strong kinematic, evolutionary and chemical evidence to support a
common origin for the Argus association and the open cluster IC 2391. In particular
the chemical tagging of the stars presented in this paper provides a necessary condition
to prove the link between the Argus association and IC 2391. However, as discussed in the text,
many elemental abundances of the studied stars are indistinguishable from the solar neighborhood,
with the exception of Ba which is an important piece of evidence in favor of a common origin of
the two stellar systems. For reasons which are not yet completely understood, barium abundances have been recently
found to correlate with age. The abundances found for both stellar systems are similar. Moreover, they fit the Ba-age correlation very well.
Given all evidence in hand, we conclude that we are witnessing the on-going dissolution of IC 2391, where the stellar members of the Argus association stars were originally born in the same proto-cluster cloud as IC 2391. Simple modeling of this system finds the dissolution of this timescale to be consistent with two-body interactions. A more detailed modeling of the disruption mechanisms, predicting spatial distribution and possibly the velocity dispersion of both groups would strengthen the proposed scenario. From an observational point of view, the second half of the stellar halo will be easily found by GAIA settling the question.
Acknowledgments
C. Melo would like to thank the AAO Distinguished Visitor Program and the ESO DGDF for funding his visit to AAO/Australia.
C. Torres and C. Melo are grateful to the ESO DGDF and Visitor Program for continuous support for to the SACY project
in the form of DGDF, science-leaves and visitorships. MG thanks the Royal Society for financial support. We thank the anonymous referee for helpful suggestions and Simon O’Toole for proof reading the manuscript.
We thank the Centre de Données Astronomiques de Strasbourg (CDS), the U. S. Naval Observatory and NASA for the use of their electronic facilities, especially SIMBAD, UCAC4, the Washington Double Star Catalog (WDS) and ADS.
References
- Aarseth (2003) Aarseth S. J., 2003, Gravitational N-Body Simulations. Cambridge University Press, November 2003.
- Allende Prieto et al. (2008) Allende Prieto C. et al., 2008, AJ, 136, 2070
- Barden et al. (2010) Barden S. C. et al., 2010, in Society of Photo-Optical Instrumentation Engineers (SPIE) Conference Series, Vol. 7735, Society of Photo-Optical Instrumentation Engineers (SPIE) Conference Series
- Bensby et al. (2005) Bensby T., Feltzing S., Lundström I., Ilyin I., 2005, A&A, 433, 185
- Bensby et al. (2007) Bensby T., Oey M. S., Feltzing S., Gustafsson B., 2007, ApJ, 655, L89
- Biazzo et al. (2011) Biazzo K., Randich S., Palla F., Briceño C., 2011, A&A, 530, A19
- Boudreault & Bailer-Jones (2009) Boudreault S., Bailer-Jones C. A. L., 2009, ApJ, 706, 1484
- Bubar & King (2010) Bubar E. J., King J. R., 2010, AJ, 140, 293
- Carrera & Pancino (2011) Carrera R., Pancino E., 2011, A&A, 535, A30
- Castelli et al. (1997) Castelli F., Gratton R. G., Kurucz R. L., 1997, A&A, 318, 841
- Covino et al. (1997) Covino E., Alcala J. M., Allain S., et al. 1997, A&A, 328, 187
- da Silva et al. (2009) da Silva L., Torres C. A. O., de La Reza R., Quast G. R., Melo C. H. F., Sterzik M. F., 2009, A&A, 508, 833
- De Silva et al. (2007a) De Silva G. M., Freeman K. C., Asplund M., Bland-Hawthorn J., Bessell M. S., Collet R., 2007a, AJ, 133, 1161
- De Silva et al. (2007b) De Silva G. M., Freeman K. C., Bland-Hawthorn J., Asplund M., Bessell M. S., 2007b, AJ, 133, 694
- De Silva et al. (2011) De Silva G. M., Freeman K. C., Bland-Hawthorn J., Asplund M., Williams M., Holmberg J., 2011, MNRAS, 415, 563
- De Silva et al. (2006) De Silva G. M., Sneden C., Paulson D. B., Asplund M., Bland-Hawthorn J., Bessell M. S., Freeman K. C., 2006, AJ, 131, 455
- Desidera et al. (2011a) Desidera S. et al., 2011a, A&A, 529, A54
- Desidera et al. (2011b) Desidera S. et al., 2011b, A&A, 529, A54
- Dias et al. (2002) Dias W. S., Alessi B. S., Moitinho A., Lépine J. R. D., 2002, A&A, 389, 871
- Díaz et al. (2011) Díaz C. G., González J. F., Levato H., Grosso M., 2011, A&A, 531, A143
- D’Orazi et al. (2012) D’Orazi V., Biazzo K., Desidera S., Covino E., Andrievsky S. M., Gratton R. G., 2012, MNRAS, 423, 2789
- D’Orazi et al. (2009) D’Orazi V., Magrini L., Randich S., Galli D., Busso M., Sestito P., 2009, ApJ, 693, L31
- D’Orazi & Randich (2009) D’Orazi V., Randich S., 2009, A&A, 501, 553
- Freeman & Bland-Hawthorn (2002) Freeman K., Bland-Hawthorn J., 2002, ARA&A, 40, 487
- Gieles et al. (2012) Gieles M., Moeckel, N., Clarke, C. J., 2012, MNRAS, 426, L11
- Gieles et al. (2010) Gieles M., Baumgardt H., Heggie D. C., Lamers H. J. G. L. M., 2010, MNRAS, 408, L16
- Gieles et al. (2006) Gieles M., Portegies Zwart S. F., Baumgardt H., Athanassoula E., Lamers H. J. G. L. M., Sipior M., Leenaarts J., 2006, MNRAS, 371, 793
- Guenther et al. (2007) Guenther E. W., Esposito M., Mundt R., Covino E., Alcalá J. M., Cusano F., Stecklum B., 2007, A&A, 467, 1147
- Hénon (1965) Hénon M., 1965, Annales d’Astrophysique, 28, 62
- Huélamo et al. (2010) Huélamo N. et al., 2010, A&A, 521, L54
- James et al. (2006) James D. J., Melo C., Santos N. C., Bouvier J., 2006, A&A, 446, 971
- Kiraga (2012) Kiraga M., 2012, ACTA Astronomica, 62, 67
- Kroupa (2001) Kroupa P., 2001, MNRAS, 322, 231
- Lada & Lada (2003) Lada C. J., Lada E. A., 2003, ARA&A, 41, 57
- Lamers & Gieles (2006) Lamers H. J. G. L. M., Gieles M., 2006, A&A, 455, L17
- Lamers et al. (2005) Lamers H. J. G. L. M., Gieles M., Portegies Zwart S. F., 2005, A&A, 429, 173
- Maiorca et al. (2011) Maiorca E., Randich S., Busso M., Magrini L., Palmerini S., 2011, ApJ, 736, 120
- Mamajek et al. (2000) Mamajek E. E., Lawson W. A., Feigelson E. D., 2000, ApJ, 544, 356
- Mashonkina et al. (2007) Mashonkina L. I., Vinogradova A. B., Ptitsyn D. A., Khokhlova V. S., Chernetsova T. A., 2007, Astronomy Reports, 51, 903
- McWilliam et al. (1995) McWilliam A., Preston G. W., Sneden C., Shectman S., 1995, AJ, 109, 2736
- Moeckel et al. (2012) Moeckel, N., Holland, C., Clarke, C. J., 2012, MNRAS, 425, 450
- Neuhäuser (1997) Neuhäuser R., 1997, Science, 276, 1363
- Oort (1958) Oort J. H., 1958, Ricerche Astronomiche, 5, 507
- Pancino et al. (2010) Pancino E., Carrera R., Rossetti E., Gallart C., 2010, A&A, 511, A56
- Patten & Simon (1996) Patten B. M., & Simon T., 1996, ApJS, 106, 489
- Platais et al. (2007) Platais I., Melo C., Mermilliod J.-C., Kozhurina-Platais V., Fulbright J. P., Méndez R. A., Altmann M., Sperauskas J., 2007, A&A, 461, 509
- Plummer (1911) Plummer H. C., 1911, MNRAS, 71, 460
- Pompéia et al. (2011) Pompéia L. et al., 2011, MNRAS, 415, 1138
- Randich et al. (2001) Randich S., Pallavicini R., Meola G., Stauffer J. R., Balachandran S. C., 2001, A&A, 372, 862
- Riedel et al. (2011) Riedel A. R., Murphy S. J., Henry T. J., Melis C., Jao W.-C., Subasavage J. P., 2011, AJ, 142, 104
- Schuler et al. (2003) Schuler S. C., King J. R., Fischer D. A., Soderblom D. R., Jones B. F., 2003, AJ, 125, 2085
- Schuler et al. (2004) Schuler S. C., King J. R., Hobbs L. M., Pinsonneault M. H., 2004, ApJ, 602, L117
- Schuler et al. (2010) Schuler S. C., Plunkett A. L., King J. R., Pinsonneault M. H., 2010, PASP, 122, 766
- Shen et al. (2005) Shen Z.-X., Jones B., Lin D. N. C., Liu X.-W., Li S.-L., 2005, ApJ, 635, 608
- Siess et al. (2000) Siess L., Dufour E., Forestini M., 2000, A&A, 358, 593
- Sneden (1973) Sneden C. A., 1973, PhD thesis, THE UNIVERSITY OF TEXAS AT AUSTIN.
- Sousa et al. (2007) Sousa S. G., Santos N. C., Israelian G., Mayor M., Monteiro M. J. P. F. G., 2007, A&A, 469, 783
- Spitzer (1958) Spitzer, Jr. L., 1958, ApJ, 127, 17
- Spitzer & Hart (1971) Spitzer L. J., Hart M. H., 1971, ApJ, 164, 399
- Steenbock & Holweger (1981) Steenbock W., Holweger H., 1981, A&A, 99, 192
- Torres et al. (2003) Torres C. A. O., Quast G., de la Reza R., da Silva L., Melo C. H. F., Sterzik M., 2003, in Open Issues in Local Star Formation, Eds. Jacques Lépine & Jane Gregorio-Hetem, Vol. 299, Kluwer Academic Publishers, pp. 83–90
- Torres et al. (2006) Torres C. A. O., Quast G. R., da Silva L., de La Reza R., Melo C. H. F., Sterzik M., 2006, A&A, 460, 695
- Torres et al. (2008) Torres C. A. O., Quast G. R., Melo C. H. F., Sterzik M. F., 2008, Young Nearby Loose Associations, Reipurth, B., ed., p. 757
- van Leeuwen (2007) van Leeuwen F., 2007, A&A, 474, 653
- Viana Almeida et al. (2009) Viana Almeida P., Santos N. C., Melo C., Ammler-von Eiff M., Torres C. A. O., Quast G. R., Gameiro J. F., Sterzik M., 2009, A&A, 501, 965
- Zacharias et al. (2012) Zacharias N., Finch C. T., Girard T. M., et al. 2012, VizieR Online Data Catalog, 1322, 0
- Zuckerman et al. (2011) Zuckerman B., Rhee J. H., Song I., Bessell M. S., 2011, ApJ, 732, 61
Appendix A Atomic line list
| Element | Wavelength (Å) | LEP (eV) | log | EW PMM3359 (mÅ) |
|---|---|---|---|---|
| Na i | 5682.63 | 2.1 | -0.71 | 123.2 |
| Na i | 5688.21 | 2.1 | -0.40 | 144.7 |
| Na i | 6154.23 | 2.1 | -1.57 | 56.0 |
| Mg i | 5711.09 | 4.35 | -1.71 | 126.5 |
| – | – | – | – | – |
| – | – | – | – | – |
| – | – | – | – | – |