Proceedings of CKM 2012, the 7th International Workshop on the CKM Unitarity Triangle,
University of Cincinnati, USA,
28 September - 2 October 2012
Direct violation in charmless decays at BABAR
Eugenia Maria Teresa Puccio111Speaker on behalf of the BABAR Collaboration
Department of Physics
Stanford University
Stanford, CA, USA.
We present asymmetry measurements using the full BABAR dataset of million pairs for the charmless decays: , , , and for the Dalitz plots of , and .
1 Introduction
Charmless decays are useful probes of the dynamics of weak and strong interactions. The interference between tree level and penguin contributions to the same final state can give rise to direct violation. The relative weak phase between tree and penguin amplitudes probes the Unitarity Triangle angle . In addition to this, enhancement in asymmetries with respect to the Standard Model expectations can signify beyond-the-Standard-Model particle contributions at loop level.
In this paper, we present the results of analyses conducted by the BABAR collaboration for the following charmless decay modes: , , , , and . These analyses make use of the full BABAR dataset. This consists of million pairs collected by the BABAR detector at the PEP-II factory, which collides asymmetric-energy beams at the resonance [1]. The meson candidates are characterised by using two kinematic variables. We take advantage of the precise kinematic information from the beams to form the variables and , where is the meson four-momentum in the centre-of-mass frame and is the centre-of-mass energy. Signal events are expected to peak around the mass for and around zero for . There are two main types of backgrounds: the very abundant background, where is either a , , or quark, and the background arising from decays to other final states. To distinguish meson candidates from the continuum background, variables describing the topology of the event are combined in a multivariate analyser (MVA), such as a neural network or a Fisher discriminant, in order to maximise their discriminating power. The variables , and the output of the MVA can either have selection requirements placed upon them or be supplied as inputs to a maximum likelihood fit. backgrounds are reduced by vetoing events containing a candidate consistent with a charm particle, and identifying remaining events by adding a category in the maximum-likelihood fit.
2 Direct violation in , and
The measurement of direct violation in can be used to extract the CKM angle from penguin contributions [2]. However asymmetries in these decay modes have not been previously well measured due to limited statistical sensitivity and predictions for these decays are not robust. BABAR published measurements of direct violation in and based on approximately half the BABAR dataset. asymmetries were found to be consistent with no direct violation. However this analysis revealed only evidence for the decay , and found no statistically significant rate for [3].
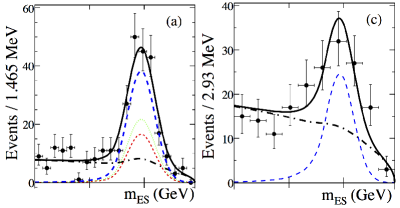
Neutral candidates are reconstructed from their decays to or candidate decaying to , or as a candidate decaying to . These are combined with a or candidates reconstructed as decays to or , respectively. The signal region is defined in terms of , and a range in the invariant mass around the mass. To account for resolution effects due to the meson, the signal region for the decay is defined to be asymmetric around zero, namely . In addition to a Fisher discriminant formed from four event-shape variables, continuum background is also suppressed by applying a selection on the angle between the thrust axis of the candidate and that of the rest of the event. A main source of backgrounds for the decays comes from . To identify the contribution in data, a maximum-likelihood fit using , , the Fisher discriminant and invariant mass is performed. [4] are used to obtain the invariant mass for the signal events. A fit to the distribution gives a total of events in the signal region.
The final maximum-likelihood fit includes seven observables: , , the Fisher discriminant, and invariant masses, and two helicity angles. Figure 1 shows the results of the fit to data. This is the first observation of and with significance greater than . Results for asymmetries are listed in Table 1. Systematic uncertainties on asymmetries include a potential bias due to the difference in the interactions of the and with the detector material (). No significant direct violation is observed in any of the three decay modes [5].
| Decay mode | |
|---|---|
3 Dalitz plot analyses of , and
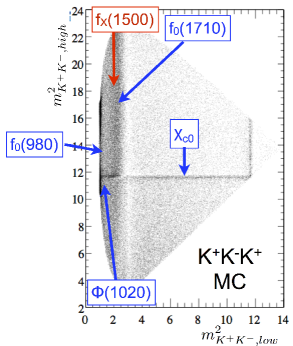
The decays , and are all penguin-dominated decay modes. The inclusive direct asymmetries for these decays are predicted to be small, and in the range – [6, 7]. Any enhancement of the asymmetry values would be an indicator of new physics. Previous analyses of these decay modes have revealed complex Dalitz plot structures that include a very broad nonresonant contribution, and a poorly understood scalar resonance, dubbed the [8, 9, 10, 11]. An example Dalitz plot Monte-Carlo simulation model for , which includes an scalar resonance, is shown in Figure 2. To create a correct Dalitz plot model, it is necessary to understand these structures.
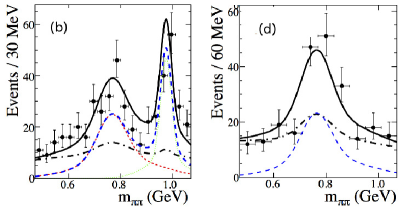
Events are reconstructed as three charged-particle tracks consistent with the kaon hypothesis for , two charged-particle tracks and a or candidate for , or one charged-particle track and two candidates for . This analysis uses Legendre polynomial moments to test the Dalitz plot model of each decay mode. Two different models are studied: model A includes a spin-zero component and model B replaces the with and components. The data are fitted by varying the mass and width of the and using an exponential S-wave term for the nonresonant component for model A, and a polynomial nonresonant model with S-wave and P-wave terms for model B. The Legendre polynomial moments are defined in terms of mass intervals as:
| (1) |
where is the helicity angle, and is the number of events in the mass interval. The for signal moments are then plotted as a function of invariant mass, one example of which is shown in Figure 3, with the distributions for model A and B overlaid. For all three decay modes, it was found that a model including the does not describe the data distribution well. However a significant improvement in log likelihood is achieved when using model B.
| Decay mode | |
|---|---|
| (NR) | |
| Other |
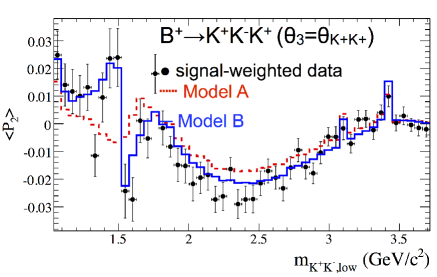
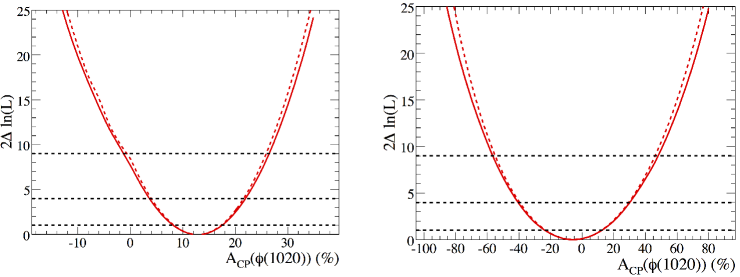
Table 2 gives the asymmetry results for and . In the three-charged-kaon decay mode, the asymmetry for differs from zero by about standard deviations. Experimental precision for the asymmetries in is however not as good as for . Log likelihood plots for the asymmetries for and are shown in Figure 4. The maximum-likelihood fit for gives 15 different solutions all within of the global minimum. The amplitudes for resonances in this Dalitz plot are poorly constrained by the current dataset and therefore only an overall direct asymmetry is quoted, which is consistent with no direct violation [12].
4 Conclusion
BABAR is still actively producing new physics results for charmless hadronic decay modes. Most of the direct violation results presented here are consistent with the Standard Model expectations. However BABAR measures the asymmetry of to be higher than the Standard Model expectation by . This is not yet evidence of new physics, and more data are required to confirm this measurement. Both LHCb and Belle 2 will be able to study the Dalitz plot structures of and with much larger data samples.
ACKNOWLEDGEMENTS
I would like to thank Prof. Patricia Burchat, Dr. Bill Dunwoodie, Prof. David Brown, Dr. Thomas Latham, Prof. Brian Meadows and the BABAR charmless conveners for the help and suggestions given to me in the preparation of this talk.
References
- [1] B. Aubert et al. (BABAR Collaboration), Nucl. Instrum. Meth. A 479, 1 (2002).
- [2] D. Atwood and A. Soni, Phys. Rev. D 65, 073018 (2002).
- [3] B. Aubert et al. (BABAR Collaboration), Phys. Rev. Lett. 97, 201801 (2006).
- [4] M. Pivk and F. R. Le Diberder, Nucl. Instrum. Meth. A 555, 356 (2005).
- [5] J. P. Lees et al. (BABAR Collaboration), Phys. Rev. D 85, 072005 (2012).
- [6] H. -n. Li and S. Mishima, Phys. Rev. D 74, 094020 (2006) [hep-ph/0608277].
- [7] M. Beneke and M. Neubert, Nucl. Phys. B 675, 333 (2003) [hep-ph/0308039].
- [8] B. Aubert et al. (BABAR Collaboration), Phys. Rev. D 74, 032003 (2006).
- [9] A. Garmash et al. (BELLE Collaboration), Phys. Rev. D 71, 092003 (2005).
- [10] Y. Nakahama et al. (BELLE Collaboration), Phys. Rev. D 82, 073011 (2010).
- [11] B. Aubert et al. (BABAR Collaboration), Phys. Rev. Lett. 99, 161802 (2007).
- [12] J. P. Lees et al. (BABAR Collaboration), Phys. Rev. D 85, 112010 (2012).