Spatially resolved star formation histories of nearby galaxies: evidence for episodic star formation in discs
Abstract
Using long-slit spectroscopy from Moran et al. (2012) we constrain the radial dependence of the recent star formation histories of nearby galaxies with stellar masses greater than . By fitting stellar population models to the combination of SSFR, D4000 and H, we show that the star formation histories of many disk galaxies cannot be accurately represented if their star formation rates declined exponentially with time. Many galaxies have Balmer absorption line equivalent widths that require recent short-lived episodes or bursts of star formation.
The fraction of galaxies that have experienced episodic rather than continuous star formation is highest for “late-type” galaxies with low stellar masses, low surface densities, and low concentrations. In these systems, bursts occur both in the inner and in the outer regions of the galaxy. The fraction of stars formed in a single burst episode is typically around 15% of the total stellar mass in the inner regions of the galaxy and around 5% of the mass in the outer regions. When we average over the population, we find that such bursts contribute around a half of the total mass in stars formed in the last 2 Gyr. In massive galaxies, bursts occur predominantly in the outer disk. Around a third of all massive, bulge-dominated galaxies have experienced recent star formation episodes that are fully confined to their outer () regions. The fraction of stars formed in bursts is only % of the underlying stellar mass, but when we average over the population, we find that such bursts contribute nearly all the stellar mass formed in the last 2 Gyr.
Recent star formation in outer disks is strongly correlated with the global atomic gas fraction of the galaxy, but not its global molecular gas fraction. We suggest that outer episodic star formation is triggered by gas accretion “events”. Episodic star formation in the inner regions is suppressed in galaxies with large bulge-to-disk ratio. This supports the idea that inner bursts are linked to instability-driven gas inflows.
keywords:
galaxy formation – optical: galaxy.1 Introduction
It is now well-established that galaxies in the nearby Universe separate rather cleanly into two classes: those with disky morphologies, plentiful gas and ongoing star formation and those that are bulge-dominated, with little gas and star formation, and where star formation has largely ceased (e.g. Strateva et al. 2001; Kauffmann et al. 2003b; Baldry et al. 2004). Most of the baryons in the Universe are not locked up in stars, but reside in the circum-galactic medium associated with virialized dark matter halos or in a more diffuse phase in the intergalactic medium (Fukugita, Hogan, & Peebles, 1998). It is thus reasonable to postulate that the observed bimodality in galaxy properties is in some way linked with the ability of galaxies to accrete gas from the external environment.
It is very difficult to probe gas infall onto galaxies directly. Resolved studies of the stellar populations of galaxies may, however, provide some important clues as to how accretion may refuel galaxies. Bell & de Jong (2000) used a large sample of low inclination spiral galaxies with radially resolved B,R,K photometry to derive estimates of age and metallicity as a function of position within the galaxy. Bell & Bower (2000) then interpreted these results using very simple models of disk galaxy evolution. They showed that a “closed box” model in which the star formation history and the metallicity of a given area in any galaxy depend only on the initial local gas surface density did not provide a good fit to the observational results. Real galaxies had stronger age gradients than predicted, and the predicted slope of the age/central surface brightness correlation was steeper than observed. Models which included infall of gas (with an infall rate that was larger for low mass galaxies) were required to fit the age/surface brightness relations. Outflows were required to explain the observed correlation between stellar metallicity and galaxy mass.
Muñoz-Mateos et al. (2007) examined the specific star formation rate profiles of a sample of nearby, face-on spiral galaxies with UV photometry from the GALEX Atlas of Nearby Galaxies (Gil de Paz et al., 2007) and K-band photometry from the Two Micron All Sky Survey (Skrutskie et al., 2006). They showed that on average, galaxies were forming stars at higher relative rates in their outer regions compared to their inner regions. More recently, Wang et al. (2011) showed that UV/optical colour gradients of galaxies are strongly correlated with their atomic gas content. Gas-rich galaxies with high Hi gas masses had stronger colour gradients than galaxies of the same stellar mass, size, and NUV-r colour with average Hi content. Both Muñoz-Mateos et al. (2007) and Wang et al. (2011) interpreted their results in the context of an “inside-out” picture of disk galaxy formation, which has commonly served as a basis for semi-analytic models of the formation of discs in the context of cold dark matter cosmologies.
The UV/optical colours of galaxies depend strongly on the amount of dust extinction in the galaxy and also are sensitive to star formation occurring over timescales of 1 Gyr (Kong et al., 2004). They thus cannot be used to assess whether the recent star formation history of a galaxy has been smooth or episodic. Combinations of narrow-band stellar absorption line indices, in particular the 4000 Å break strength and the equivalent widths of Balmer absorption lines , such as H or H, are able to probe the recent star formation histories of galaxies in more detail. Galaxies that have undergone a burst of star formation in the last 1-2 Gyr will have stronger Balmer absorption line equivalent widths for a given value of 4000 Å break strength, compared to galaxies that have been forming their stars continuously (Dressler & Gunn 1983; Poggianti et al. 1999; Kauffmann et al. 2003a).
This paper aims to constrain the radial dependence of the recent star formation histories of disk galaxies. We compare spectral indices, the 4000 break strength (Dn4000), a Balmer line index derived using an approach based on principal component analysis (PCA), and the present-day star formation rate over stellar mass (specific star formation rate ; SSFR) to a library of models generated from the Bruzual & Charlot (2003) population synthesis code. We use the best fit models to constrain the timescale over which stars have been formed at different radii in the disk. We show that the star formation histories of many spiral galaxies cannot be be described by simple exponentially declining star formation histories. Additional recent ( 2 Gyr old) episodes of star formation are required in order to fit Dn4000, H and SSFR simultaneously. The mean fraction of stars formed in these recent episodes is similar in the inner and outer regions of galaxies, except for massive galaxies, where the bursts occur predominantly in the outskirts of the galaxy.
We also study how the recent star formation histories and gas-phase metallicities in the inner and outer regions of the galaxies in our sample correlate with their atomic and molecular gas content. Our main result is that the recent star formation history and the metallicity in both the inner and outer regions of galaxies are strongly correlated with their total atomic gas mass fraction. In contrast, only the inner star formation history and metallicity are correlated with total molecular gas fraction.
Our paper is organized as follows. Section 2 introduces the 21cm and CO(1-0) line data we use from GASS (Catinella et al., 2010) and COLD GASS (Saintonge et al., 2011) surveys and the long-slit spectroscopic observations from the MMT follow-up observations (Moran et al., 2012). We explain how we create a library of model spectra and use it to extract estimates of parameters such as burst mass fraction in Section 3. Based on the results of the fits, we classify our sample galaxies into five groups according whether their star formation histories are best described by continuous or burst models in their inner and outer regions. In Section 4, we examine how the fraction of galaxies in these different classes depends on their location in the plane of stellar mass versus stellar surface density/concentration/colour. We also examine how the fraction of stars formed both continuously and in bursts in the inner and outer regions of the galaxy depends on the location of galaxies in these planes. We summarize and discuss our results in Section 5.
2 Data
The data set on which this analysis is based has been described in detail in (Moran et al., 2012). The original parent sample consists of galaxies with Hi line flux data from the Arecibo telescope that were observed as part of the GALEX Areceibo SDSS (GASS) survey (Catinella et al. 2010; 2012). GASS aimed to measure the neutral hydrogen content for a large, uniform sample of 1000 massive galaxies with stellar masses in the range and redshifts in the range . No other selection criteria such as cuts on morphology, colour or gas content were applied. This sample thus provided an unbiased view of how the cold gas fraction related to the physical parameters of galaxies. The reader is referred to these papers for details about the sample selection and the HI observations. A subset of 300 galaxies were selected from this sample for CO () observations using the IRAM 30m telescope (Saintonge et al., 2011). Of these, around 200 galaxies now have reduced long-slit spectroscopy obtained from both the Blue Channel Spectrograph on the 6.5m MMT telescope on Mt. Hopkins, AZ, and the Dual Imaging Spectrograph on the 3.5m telescope at Apache Point Observatory (APO; see Moran et al. 2010 for details about the observational setup and data reduction). These galaxies were all selected at random from the GASS sample.
The wavelength ranges for MMT and APO observations are 3900-7000 Å at a spectral resolution of 4 Å (90 km s, and 3800-9000 Å at a spectral resolution of 6-8 Å (150 km s-1). The spectra were spatially binned outward from the galaxy center to ensure an adequate in each spatial bin. All bins have minimum extent equal to the slit width: 1.25 for the MMT observations) and 1.5 for the APO observations. The bin size is typically 3 , corresponding to a physical size of 1.5-3 kpc at the redshift of the galaxies in our sample. The per bin is required to be larger than 15 (per Å) in the inner regions of the galaxy. In the outer, lower surface brightness regions, these requirements are progressively loosened in order to compromise between and spatial resolution: we adopt 10 for bins out to a distance of 4.5, 8 for bins between 4.5 and 6 and finally 6 in the outermost bins. The spectra were flux-calibrated by matching to SDSS and -band photometry measured through an aperture matched to the slit. The O3N2 index (Pettini & Pagel, 2004) was applied to estimate gas-phase metallicities. The empirical relation is 12 + log(O/H) = 8.73 - 0.32 O3N2, where O3N2 = log(([Oiii]/H)/([Nii]/H)). It was demonstrated that the inferred metallicity gradient did not depend on the exact choice of indicator.
All galaxies have NUV and FUV fluxes from the GALEX medium imaging survey. SDSS -band and GALEX NUV images were used to derive the NUV-r colours of the galaxies in our sample. The SDSS images were first degraded to the resolution of NUV images. The -band and NUV magnitudes within Kron elliptical apertures were obtained using SExtractor (Bertin & Arnouts, 1996) and corrected for Galactic extinction following Wyder et al. (2007). The reader is referred to Catinella et al. (2010) for a more detailed explanation. Global galaxy parameters such as stellar mass, stellar surface mass density, and concentration index were taken from the MPA/JHU value-added catalogs (http://www.mpa-garching.mpg.de/SDSS). Stellar masses were derived by fitting SDSS photometry to stellar population synthesis models. Stellar surface mass density was defined as , where was the radius containing 50% of the Petrosian flux in -band. Concentration index was defined as where and are the radii enclosing 90% and 50% of the total -band light.
3 Analyses
3.1 A PCA-based Balmer absorption line index
The use of “classic” Balmer absorption line Lick indices such as H or H measured directly from the galaxy spectra can be problematic for two reasons: 1) Because these indices are defined over a narrow range in wavelength, the signal-to-noise of the measurements is quite low, especially towards the outer regions of the galaxy, where the spectra may only have per pixel. 2) In star-forming galaxies, the Balmer absorption lines are filled in by emission. A robust measurement of the absorption line equivalent width hinges on subtracting this emission accurately.
If stellar population models fit the observed spectra accurately, they provide one way of solving the problem. Because the models are fit to the spectra over a wide range in wavelength, the errors on Balmer line indices derived from these fits decrease with respect to those for directly measured indices (Wild et al., 2007). In addition, the wavelength regions where emission may be present are masked when the fitting is carried out.
In this paper, we apply the principal component analysis (PCA) method described in Chen et al. (2012), which is an extension of the method described in Wild et al. (2007). The principle of PCA method is that a galaxy spectrum can be decomposed into a set of orthogonal principal components (PCs), which can be linked to physical properties such as fraction of stars formed over the last Gyr, or to estimates of indices such as D4000, H, H using a library of star formation histories generated using population synthesis models. By comparing the amplitudes of the principal components of the observed spectra to those of the modelled spectra, the likelihood distribution of such parameters can be calculated and thus constrained. The advantage of this approach is that it improves our estimates of Balmer absorption line equivalent widths, particularly for the spectral bins with poor in the outskirts of the galaxies. The reader is referred to Chen et al. (2012) for further details. In this work, we find the linear combination of PC amplitudes that best represents the indices D4000 and H for each spectrum. A probability distribution function (PDF) for either D4000 or H can be built using as weights. We use the median value of the PDF as our nominal estimate of the parameters, and the 16th to 84th percentile range of the PDF as the confidence interval.
3.2 Comparison with a Library of SEDs of Model Galaxies
We compare two PCA-derived spectral indices, which we will denote PCA and PCA, as well as the present-day star formation rate over stellar mass (SSFR) derived from the extinction-corrected H flux as described in Moran et al. (2012), to a library of models generated from the Bruzual & Charlot (2003) population synthesis code. As we will demonstrate, these three quantities jointly place strong constraints on whether the galaxy has been forming stars smoothly or episodically over the past 1-2 Gyr.
We create a library of models by using the population synthesis code of Bruzual & Charlot (2003). The underlying model has a continuous SFR, declining exponentially with time SFR, with uniformly distributed between 0 (i.e. constant star formation rate) and 1 Gyr-1. Stars begin to form at a look-back times between 13 Gyr and 1.5 Gyr.
We then superimpose additional bursts of star formations onto these continuous models. 111It is true that exponentially decaying star formation histories are not very physical. However, as we will show, the look-back times when half the stellar mass was formed is never less than 4 Gyr. As a result, an exponential model and other parametrizations such as a delayed exponential model will yield the same answers regarding burst requirements, because the timescale over which the H index becomes strong following a burst is 1.5 Gyr. The strength of the burst is defined as the fraction of the stellar mass produced by bursts relative to the total mass formed by continuous models, and is distributed logarithmically between 0.001 and 4. Bursts are described by top-hat functions and have durations between 3 to 3 years. The combination of Balmer absorption lines and 4000 Å break strength is not sensitive to star formation episodes that have occurred longer than about Gyr ago, so the bursts occur randomly between look-back times of 2 Gyr and the present. The metallicity range of our models is distributed uniformly from 0.005 to 2.5. Each model includes dust extinction based on the two-component model of Charlot & Fall (2000), where the V-band optical depth follows a Gaussian distribution with a peak at 1.78 and a width of = 0.55. The distribution is truncated so that it only spans the range 0-4. is the fraction of that optical depth affecting stellar populations older than 10 Myr and is uniformly distributed between 0 and 1.
3.3 Fitting procedure
We first discard those spectral bins with contamination from background or foreground sources (3 spectral bins in total, originating from 2 galaxies). We also exclude the spectral bins with large errors in the PCA indices — PCA and PCA. This leaves a total of 2725 spectral bins out of the original 2812 bins. We first check whether the 2 PCA indices and the SSFR can be fit using the library of continuous SF models. The bins where such fits fail are then fit with the full library of continuous and burst models. We have used both the best-fit model with minimum chi-square to estimate quantities such as the stellar mass formed in the past 2 Gyr, as well as the median of the probability distribution function. In practice, the two estimates yield virtually identical results (see Figs 1 and 2). We record the stellar mass produced in the last 2 Gyrs. When the continuous models do not provide acceptable fits within 1 error of data, we also record the stellar mass produced in the burst mode during this time period.
3.4 Separating inner and outer regions of galaxies
In the following sections, we will often refer to the mass of recently formed stars in both the “inner” and the “outer” regions of the galaxy. We choose 0.7R90 as the nominal radius to partition our galaxies into inner versus outer spectral bins, where R90 is the radius enclosing 90 percent of the -band Petrosian flux. In Moran et al. (2012), they found that there was a clear anti-correlation between the outer-disk metallicity (R ) and the total galaxy Hi fraction. We therefore follow their definitions of the inner and outer regions of galaxies. We weight each spectral bin by the stellar mass enclosed by the circular annulus formed by the inner and outer boundaries of the bin. We then calculate weighted averages of quantities such as the fraction of recently-formed stellar mass and gas-phase metallicity.
3.5 Categorization of Galaxies According to Their Star Formation Histories
We divide our galaxy sample into five classes according to their star formation histories in their inner and outer regions:
(1)Type A: Those that are well described by continuous models at all radii, i.e. the star formation histories are well described by a varying exponential decline time as a function of radius. Type A galaxies have tstart ranging between 13 and 12 Gyr in look-back time.
(2)Type B: Those that are well described by continuous models at all radii, but with tstart varying between 12 and 2 Gyr.
(3)Type C: Those that are well described by continuous models with tstart varying between 13 and 2 Gyr in their inner regions, but which require a burst in their outer regions.
(4)Type D: Those that require bursts in both their inner and their outer regions.
(5)Type E: Those that require bursts only in their inner regions.

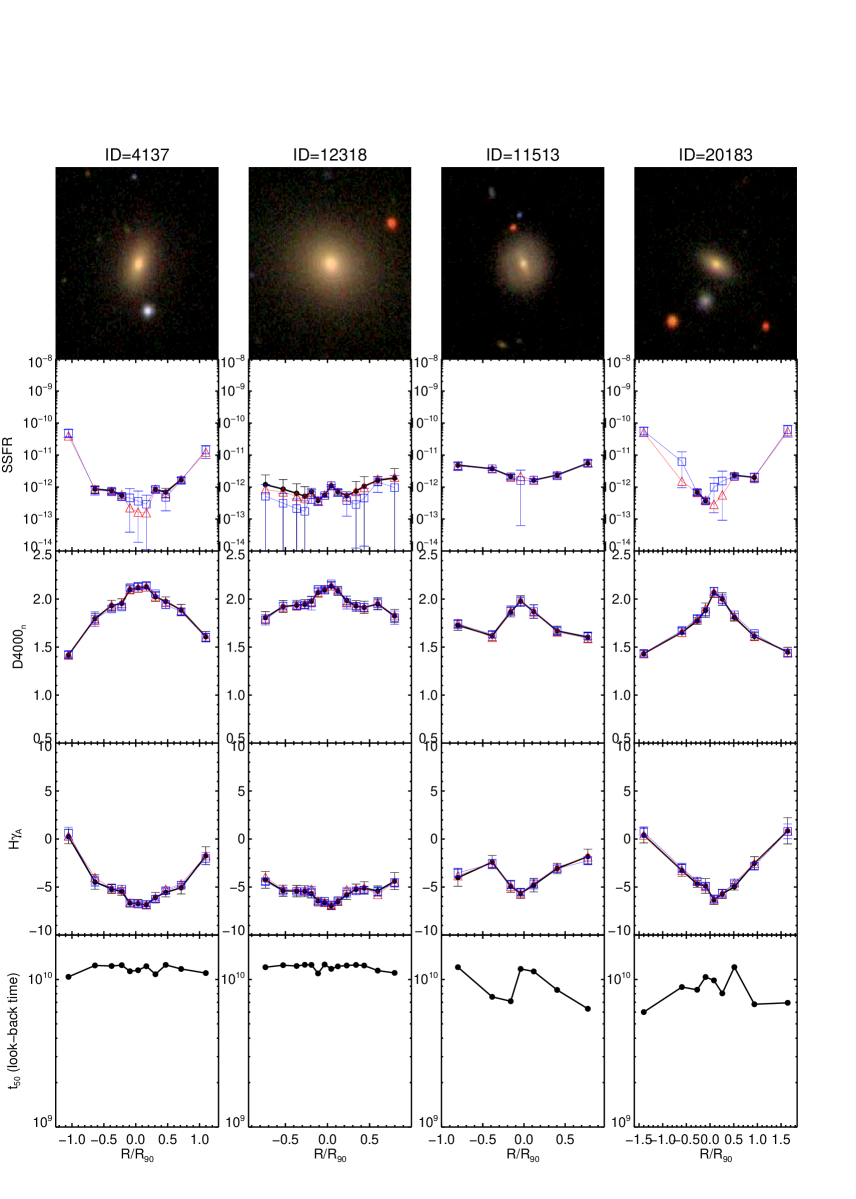
The number of galaxies of type A, B, C, D, and E is 45, 24, 34, 104, 2 respectively. Some examples of each type are presented in Figs 1 and 2. Fig. 1 shows examples of galaxies of types A and B, which are well fit by pure exponential models. In the first row, we show SDSS cut-out images. The 2nd, 3rd, 4th rows show SSFR, D4000 and H as a function of radius in the galaxy. Note that the radii have been scaled by dividing by R90. In these panels, black points show the data along with the errors. Red/blue lines are model fits using the minimum chi-square models and the median of the PDF, respectively. In the 5th row, we plot the parameters of the minimum chi-square models as a function of radius. The 5th row shows the look-back time when half of stellar mass was formed at each radius.
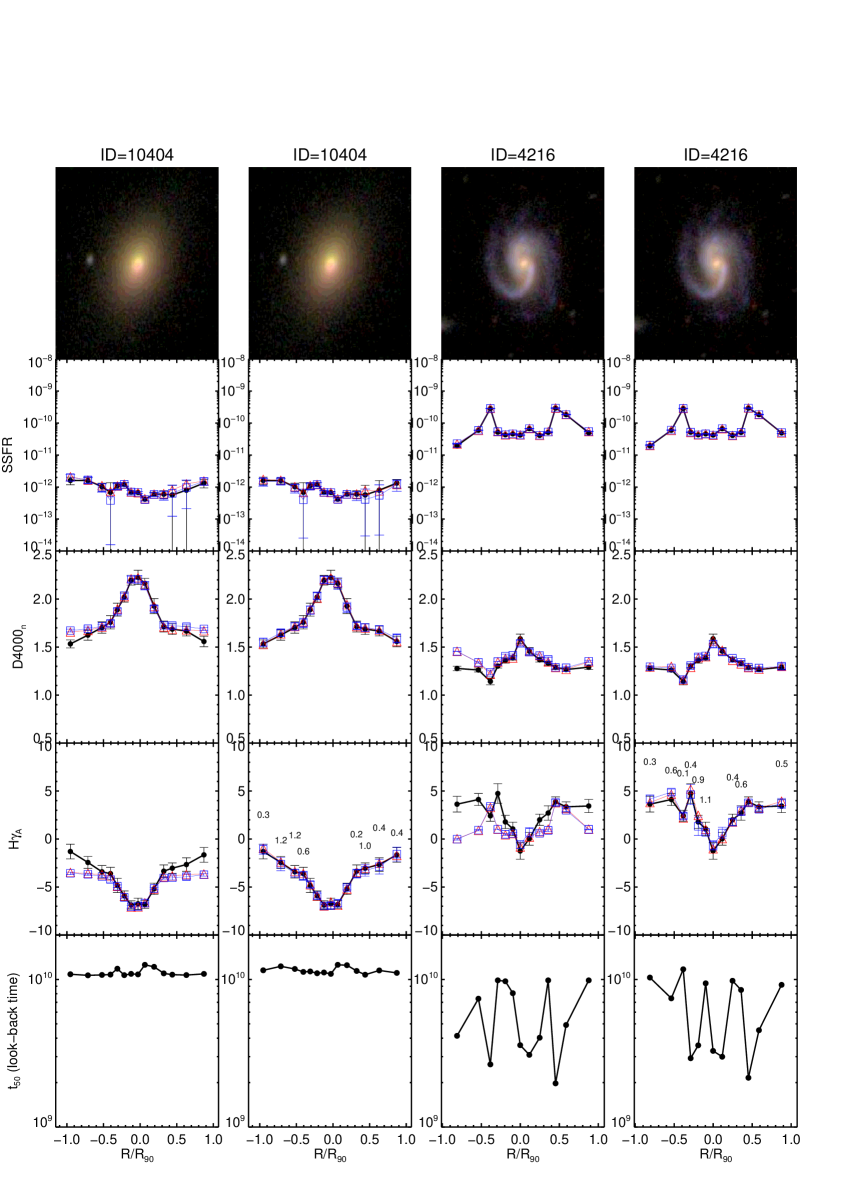
Fig. 2 shows examples of galaxies of types C and D, which require bursts. The rows are the same as in the previous figure. In the left column, we show the best-fit continuous models. As can be seen, in both cases such models generally work better near the centers of galaxies. In the outer regions, the deviations in the fit to PCA and PCA become large. The right panels show how addition of a burst bring the models into much better agreement with the data. We note that the physical size of each bin for our sample is at least 1.5-3kpc, and the discrepancies between the data and the continuous models often span more than 2 bins. This means that the bursts are not generated by individual Hii regions, but span a significant portion of the outer disk.
In Fig. 3 we plot the average deviation of the continuous models from the observations as a function of radius for type C (upper panel) and type D (lower panel) galaxies. In order to account for the fact that the observational errors increase as function of radius, we scale the deviation by before taking the average . As expected, the centers of Type C galaxies are well fit, with the average deviation increasing towards the outer regions. The lower panel of Fig. 3 shows that the same general trend is also true for type D galaxies. In the central regions, the average deviation from a continuous model is only , but in the outer regions the average deviation increases by a factor of 2-3. As we will show in the next section, the main difference between galaxies with type C and type D star formation histories is stellar mass. Galaxies with recent star formation only in their outer regions are predominantly systems with stellar masses greater than .
4 Results
4.1 Dependence of star formation history on stellar mass, surface density, concentration and colour
In this section, we investigate how the fraction of galaxies with different types of star formation histories defined in Section 3.5 depends on stellar mass, galaxy colour and structural parameters such as surface density and concentration.
For central galaxies, stellar mass is a good tracer of the mass of dark matter halo in which the galaxy resides. The surface density of the galaxy is a rough measure of the degree to which the gas has lost angular momentum prior to being converted into stars. The concentration index is a good proxy for the bulge-to-disk or bulge-to-total luminosity ratio of the galaxy (see Fig. 1 of Weinmann et al. 2009). Finally, in the absence of dust, the global NUV-r colour is a measure of the average luminosity-weighted age of the stellar population. In order to understand whether the star formation history of a galaxy is determined primarily by its mass or by its structural properties, we will analyze SFH trends in two dimensional planes of stellar mass versus surface density and concentration. We will also examine how the fraction of stars formed both continuously and in bursts in the inner and outer regions of the galaxy depends on the location of the galaxies in these 2D planes.
4.1.1 The plane of stellar mass versus stellar surface density
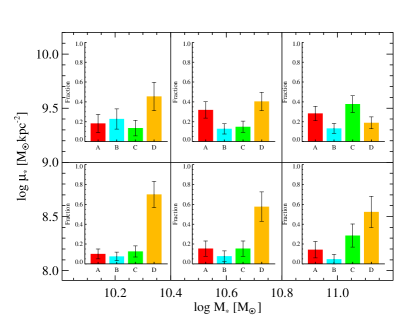
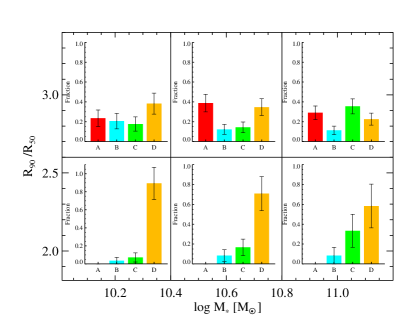
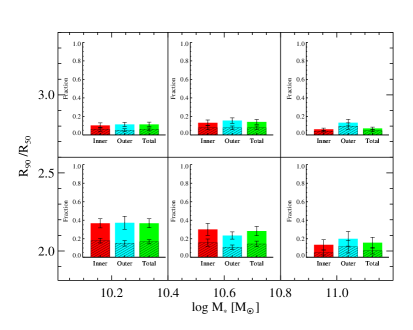
All galaxies are divided into 6 bins by dividing their stellar mass into 3 bins, 10.0–10.4 , 10.4–10.8 , and 10.8–11.2 in , and surface mass density into 2 bins: kpc-2 and kpc-2 . In each bin, we calculate (1) the fraction of galaxies with different types of star formation histories (left panel ), (2) the fraction of the stellar mass formed within the last 2 Gyr in the inner region, the outer region and in the entire galaxies (right panel), (3) the fraction of the stellar mass formed in the burst mode in the last 2 Gyr in the inner region, the outer region, and in the entire galaxy (hashed histograms in the right panel).
As shown in the left panel of Fig. 4, the star formation histories of galaxies clearly depend on both stellar mass and surface density. The fraction of quiescent galaxies without bursts (types A and B) depends mainly on surface density rather than stellar mass. There is some tendency for quiescent galaxies to be somewhat more active (i.e. be of type B) if they have low masses.
The fraction of galaxies that have experienced recent bursts in both their inner and their outer regions (type D) decreases both as a function of stellar mass and stellar surface density. In the stellar mass bin with in the range 10–10.4, type Ds make up more than two thirds of the entire population, but type Ds make up only a small fraction of the galaxies our highest / bin. Interestingly, however, the fraction of galaxies that have experienced recent bursts in their outer regions only (type Cs) exhibits the opposite dependence of on the mass of the galaxy. In the highest stellar mass bin with in the range 10.8–11.2, there are as many type C galaxies as there are quiescent (type A and B) galaxies.
The right panel of Fig. 4 displays the fraction of stars formed in the last 2 Gyr as a function of location in the plane of stellar mass and stellar surface density. We show the fraction of recently formed stars in the whole galaxy (in green) as well as the fraction in the inner (, red) and outer (,blue) regions. The fraction of stars formed in the last 2 Gyr in the burst mode is indicated as hashed shading. As expected, the fraction of recently formed stars is highest for galaxies with low masses and low surface densities and lowest for galaxies with high masses and high surface densities. Interestingly, the recent star formation is always rather evenly split between the inner and outer parts of galaxies, except for the most massive galaxies with low stellar surface densities, where more star formation occurs in the galaxy outskirts. These results are consistent with a recent analysis by Pérez et al. (2013) of star formation in the inner and outer regions of galaxies using a sample of galaxies with integral field unit (IFU) spectroscopy. What is new here, is that we can estimate the fraction of the recent star formation that occurred in bursts. We see that the burst fraction is highest in massive galaxies. The majority of galaxies with stellar masses in the range 10–10.4 in require bursts in both their inner and in their outer regions (i.e. they are classified as type D systems), but the total mass of stars formed in the bursts over the last 2 Gyr is comparable or smaller (in the case of low mass galaxies with low densities) than that formed in the quiescent mode. In high mass galaxies, the opposite is true – the majority of the recent star formation is contributed by bursts.
4.1.2 The plane of stellar mass versus concentration
Fig. 5 is similar to Fig. 4 except that we divide galaxies according to concentration index () at a value of 2.6. As can be seen, the results are quite similar to those obtained when galaxies are divided by stellar surface mass density. One notable difference is that in Fig. 5 we see that all type A galaxies have the division between quiescent galaxies and galaxies with actively ongoing star formation is much more pronounced. We see that all type A galaxies have , whereas Fig. 4 shows that there is a significant number of type A galaxies with stellar surface mass densities less than kpc-2. We note that high concentration index (equivalently bulge-to-disk ratio) instead of high stellar surface density (equivalently contraction factor) appears to be the necessary condition for galaxies with quiescent type A star formation histories. Although high concentration is a necessary condition, it is not a sufficient condition – a sizeable fraction of bulge-dominated galaxies have experienced bursts of star-formation in the last 2 Gyr.
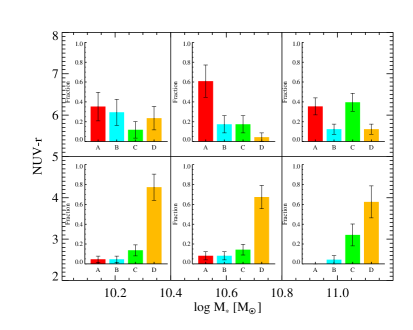
4.1.3 The plane of stellar mass versus colour
In Fig. 6 we divide galaxies according to (NUV-r) colour at a value of 4.8 . As can be seen from the right-hand panel, red global colours select out the galaxy population that have experienced very little recent star formation both in their inner and in their outer regions. It is noteworthy that almost all galaxies with quiescent star formation histories (types A and B) belong to the red population with NUV-r . Galaxies that have experienced bursts in their outer regions are roughly split evenly between the red and the blue populations, while type D galaxies that have experienced bursts in both their inner and outer regions are predominantly blue. We note, however, that a significant population of red type D galaxies is found in the lowest stellar mass bin.
4.1.4 Distribution of SFH parameters of galaxies
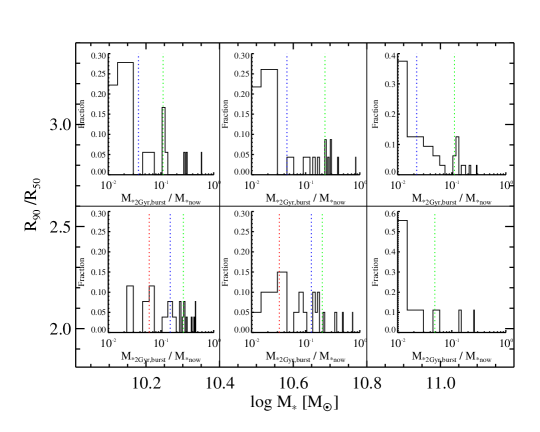
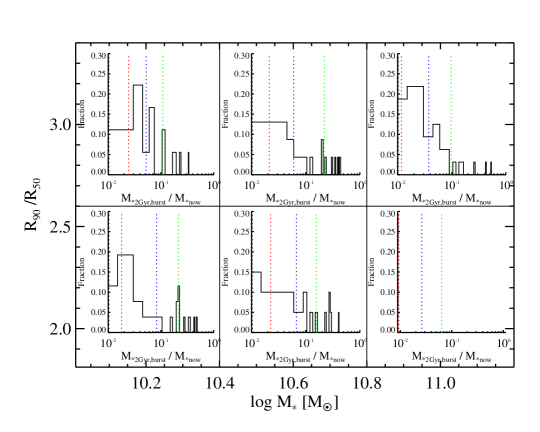
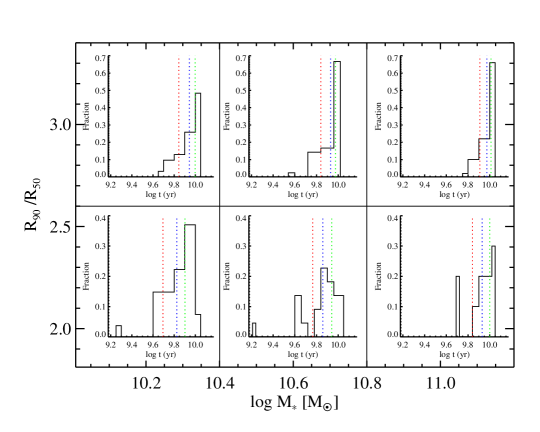
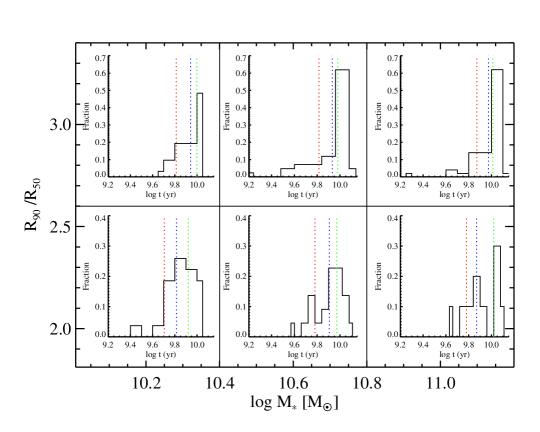
In the previous sub-sections we studied the fraction of galaxies with bursty versus continuous star formation histories as a function of stellar mass, colour and structural parameters. We also looked at the contribution of bursts to the recent star formation in the inner and the outer regions of galaxies, as a function of these same parameters. In this sub-section, we analyze the distribution of burst strengths in galaxies, as well as the look-back time when half the stars were formed. For simplicity, we confine our attention to the two dimensional plane of concentration versus stellar mass.
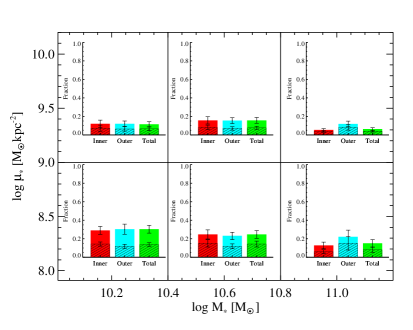
(i) The Fraction of stars formed in bursts. Fig. 7 shows the distribution of the fraction of stars formed in bursts in the inner and outer regions of galaxies as a function of position within this plane . As seen in the top panel, the fractions of stars formed in bursts in the inner region is generally around a few percent for bulgy galaxies () or for massive galaxies (). In the inner regions of less massive, disk-dominated galaxies the median burst strength is 10% and the distribution is much wider. The bottom panel of Fig. 7 shows that burst strengths in the outer regions of galaxies are insensitive to whether it is bulge or disk-dominated. The main controlling factor is the mass of the galaxy. In the highest stellar mass bin, the median burst strength in the outer region is %, about a factor of two lower than in the other two bins. We also note that in massive galaxies, the outer bursts are stronger than the inner bursts on average, whereas the opposite is true for low mass galaxies.
(ii)The look-back time when half the stellar mass was formed. In Fig. 8, we make similar plots of the look-back time when half the stellar mass was formed (T50), which provides information about the mean stellar ages of the galaxies. The trends in this plot are much weaker. Only a very small fraction of galaxies have T50 less than Gyr in either their inner or their outer regions. This is in keeping with the results in the previous section, which shows that although recent bursts are required to fit the spectral parameters, the fraction of mass formed in these bursts generally does not exceed of the total stellar mass. Disk-dominated galaxies generally have younger mean stellar ages than bulge-dominated galaxies of the same stellar mass, and the most massive galaxies have the oldest mean stellar ages. The trend for the most massive, bulge-dominated galaxies to have the oldest mean stellar ages holds in both the inner and outer regions of the galaxies, but is somewhat stronger in the outer region.
We also note that outer star formation in massive galaxies discussed in the previous section, is manifested in this plot as shift in the lower 25th percentile of the mean age distribution, rather than a shift in the median value. This means that outer disk growth is a phenomenon that pertains to a minority of the massive galaxies, rather than to the population in general.
4.2 Relations between star formation history, HI/H2 mass fraction and gas-phase metallicity
In the previous section, we explored how the star formation histories in the inner and outer regions of galaxies depend on their stellar mass, structural properties and colour. In this section, we examine how star formation history depends on the gas content and gas-phase metallicity of a galaxy. In previous work, Moran et al. (2012) showed that around 10% of all galaxies with stellar masses greater than exhibit strong drops in gas-phase metallicity in their outer regions. These galaxies tended to have high Hi content and to have actively star-forming outer disks.
In this analysis, we explore the correlations between the fraction of recently-formed stars and gas-phase metallicity in the inner and outer regions of the galaxy with both the Hi and H2 gas mass fraction. We also explore how the correlations change as we vary the radius used to divide the inner galaxy from the outer galaxy.
The spectral bins with only upper or lower limits on metallicity are discarded before we carry out our analysis. For each value of (in units of R90), we compute correlation coefficients of Spearman rank tests for
-
•
The relations between the fraction of stars formed in the inner/outer regions of the galaxy and total Hi gas mass fraction.
-
•
The relations between the fraction of stars formed in the inner/outer regions of the galaxy and total H2 gas mass fraction.
We only take into account the correlation coefficients with probability larger than 0.97. For the coefficients with probability smaller than 0.97, we set the coefficients to zero. (In practice, this only happens for the relations between outer star formation and metallicity and H2 gas mass fraction when is greater than .)
Fig. 9 summarizes the results of this exercise. is in units of R/R90. The upper and lower panels show the results for the correlations with Hi and H2 gas mass fraction, respectively. Coefficients with values larger and smaller than zero indicate positive and anti-correlations between the parameters.
As can be seen in the upper panel of the figure, the fraction of recently-formed stars and the gas-phase metallicity in both the inner and the outer regions of the galaxy correlate strongly with the global atomic gas mass fraction. The strength of the correlations does not depend on the adopted value of , until reaches values greater than 0.9 R90. At this point, stronger correlations between the gas-phase metallicity and the fraction of stars formed in the outer regions and the total Hi content are seen. Interestingly, the correlation between the fraction of stars formed in the inner region of the galaxy and total Hi gas fraction is independent of the value of . Even as decreases to values near zero, there is still a correlation between the fraction of stars formed in the very inner regions of the galaxy and its total atomic gas content. We will discuss possible reasons for this in the next section.
In the lower panel of Fig. 9, we see that the gas-phase metallicity and the fraction of recently-formed stars in the inner regions of the galaxy are also both correlated with H2 mass fraction. The correlation of these inner quantities with H2 mass fraction is stronger than the correlation with Hi mass fraction ( values of rather than ). Similar to what is seen for the atomic gas, the strength of the correlations of the inner quantities with H2 gas mass fraction are independent of . The outer quantities, however, are much more weakly correlated with H2 mass fraction and for , the correlations with H2 mass fraction disappear entirely.
5 summary and discussion
We now summarize our main results as follows:
(i) By fitting stellar population models to the combination of SSFR, D4000, H, we show that the star formation histories of many disk galaxies cannot be accurately represented if the star formation rate has declined exponentially as a function of time. Many galaxies have strong Balmer absorption lines that require recent short-lived episodes of star formation in both their inner and in their outer regions.
(ii) The fraction of galaxies that have experienced such episodes in both their inner and outer regions is highest for systems with low stellar masses, low surface densities, and low concentrations, i.e., late-type galaxies.
(iii) Around a third of all massive (), bulge-dominated galaxies have experienced recent star formation episodes only in their outer regions.
(iv) For low mass, disk-dominated galaxies, the fraction of stars formed in a single burst episode is typically around 15% of the total stellar mass in the inner regions of the galaxy and around 5% in the outer regions of the galaxy. When we average over the population, we find that such bursts contribute around a half of total mass in stars formed in the last 2 Gyr.
(v) For massive galaxies (), the fraction of stars formed in bursts is only % . Averaging over the population, however, we find that such bursts contributed nearly all the mass in stars formed in the last 2 Gyr.
(vi) The amount of recent star formation in both the inner and outer regions of a galaxy is positively-correlated with its total atomic gas content. In contrast, only the inner star formation is correlated with total molecular gas content.
(vii) Very similar results are obtained for gas-phase metallicity. Metallicity in both the inner and outer regions of galaxies are negatively correlated with global atomic gas fractions. The metallicity in the inner region of the galaxy is negatively correlated with the molecular gas mass fraction.
We hypothesize that these results can be understood if galaxies accrete atomic gas and form stars episodically. The fact that episodic component of the star formation occurs primarily in the outer regions of massive galaxies (right panels of Figs. 4 and 5) argues that gas may be accreted at large radii. We note that the non-episodic (continuous) component of the star formation is much more evenly split between the inner and the outer regions in these systems.
In low mass galaxies, both the episodic and the continuous components of the star formation are evenly divided between the inner and outer regions of the galaxy. It is tempting to postulate that this may indicate that gas accretion occurs in a different mode in low mass systems – some theoretical models predict that gas should be accreting in the form of “cold streams” in dark matter halos with low mass, and from quasi-static atmospheres of hot gas in dark matter halos of high mass (e.g. Kereš et al. 2005; Dekel & Birnboim 2006).
However, our data does not allow us to rule out the possibility that the inner and outer bursts in galaxies may have different triggers, for example gas accretion may be the trigger in the outer regions and disk-driven instabilities in the inner regions. Indeed, at fixed stellar mass, the fact that burst strengths are larger in the interiors of disk-dominated galaxies densities (Fig. 7, top panel), argues that disk instabilities may indeed be key to the origin of the episodic nature of the inner star formation. The Toomre Q parameter scales inversely with disk surface density.
The idea that gas accretion at large radii is followed by instability-triggered radial inflows of gas and a burst of star formation in the central regions of the galaxy is also consistent with our result that gas-phase metallicity and the fraction of recently formed stars in the inner region of the galaxy is best correlated with its molecular gas content. Molecular gas extends to much smaller radii than the atomic gas in all disk galaxies and also exists at considerably higher surface densities (Leroy et al., 2008). Why then do metallicity and recent star formation in the inner regions of galaxies also correlate (albeit more weakly) with the total atomic gas content of the galaxy? The most reasonable explanation, in our view, is that the atomic gas represents a longer-term reservoir for star formation in the inner galaxy. In other words, if the galaxy has no atomic gas, there is simply no raw material to be transported inwards to be converted into molecular gas and stars at galactic centers.
Finally, we would like to note that we began this paper with the statement “It is now well established that galaxies in the nearby Universe separate rather cleanly into two classes: those with disky morphologies, plentiful gas and ongoing star formation and those that are bulge-dominated, with little gas and star formation, and where star formation has largely ceased.” Examination of the left panel of Fig. 4 indicates that even at high stellar masses, bulge-dominated galaxies have actually experienced a wide variety of different star formation histories. Those that are “dead” in that they have not experienced any recent star formation episodes comprise less than half of the total population. In many of the massive, bulge-dominated galaxies star formation occurs in the outer regions of the galaxy, where the light has simply not been picked up by large scale redshift surveys that employ single fibre spectrographs. The fibres typically have diameters of 2-3 arcseconds and only sample light from the inner regions of the galaxies.
The realization that many early-type galaxies do have extended star-forming disks first came from studies of early-type galaxies at ultra-violet wavelengths (e.g., Yi et al. 2005; Kauffmann et al. 2007; Fang et al. 2012), and these results are now being confirmed by IFU studies of the nearby galaxy population Pérez et al. (2013). Our study reveals that the star formation in these disks did not occur continuously over a Hubble time, but was concentrated in a recent episode or burst. In future, large-scale Integral Field Unit (IFU) surveys of galaxies (see for example Sánchez et al. 2012) will shed more light on the nature of the star formation in the far outer reaches of nearby galaxies.
Acknowledgments
YMC is supported by the National Natural Science Foundation of China (NSFC) under NSFC-10878010, 10633040, 11003007 and 11133001.
References
- Baldry et al. (2004) Baldry I. K., Glazebrook K., Brinkmann J., Ivezić Ž., Lupton R. H., Nichol R. C., Szalay A. S., 2004, ApJ, 600, 681
- Bell & de Jong (2000) Bell E. F.,de Jong R. S., 2000, MNRAS, 312, 497
- Bell & Bower (2000) Bell E. F., Bower R. G., 2000, MNRAS, 319, 235
- Bertin & Arnouts (1996) Bertin E., Arnouts S., 1996, A&AS, 117, 393
- Bruzual & Charlot (2003) Bruzual G., Charlot S., 2003, MNRAS, 539, 718
- Catinella et al. (2010) Catinella B. et al., 2010, MNRAS, 403, 683
- Catinella et al. (2012) Catinella B., et al., 2012, A&A, 544, A65
- Charlot & Fall (2000) Charlot S., Fall S. M., 2000, MNRAS, 539, 718
- Chen et al. (2012) Chen Y. M. et al., 2012, MNRAS, 421, 314
- Dekel & Birnboim (2006) Dekel A., Birnboim Y., 2006, MNRAS, 368, 2
- Dressler & Gunn (1983) Dressler A., Gunn J. E., 1983, ApJ, 270, 7
- Fang et al. (2012) Fang J. J., Faber S. M., Salim S., Graves G. J., Rich R. M., 2012, ApJ, 761, 23
- Fukugita, Hogan, & Peebles (1998) Fukugita M., Hogan C. J., Peebles P. J. E., 1998, ApJ, 503, 518
- Gil de Paz et al. (2007) Gil de Paz A., Boissier S., Madore B. F., Seibert M., Joe Y. H., 2007, ApJS, 173, 185
- Kauffmann et al. (2003a) Kauffmann G. et al., 2003 , MNRAS, 341, 33
- Kauffmann et al. (2003b) Kauffmann G., et al., 2003b, MNRAS, 341, 54
- Kauffmann et al. (2006) Kauffmann G. et al., 2006 , MNRAS, 367, 1394
- Kauffmann et al. (2007) Kauffmann G., et al., 2007, ApJS, 173, 357
- Kereš et al. (2005) Kereš D., Katz N., Weinberg D. H., Davé R., 2005, MNRAS, 363, 2
- Kong et al. (2004) Kong X., Charlot S., Brinchmann J., Fall S. M., 2004, MNRAS, 349, 769
- Leroy et al. (2008) Leroy A. K., Walter F., Brinks E., Bigiel F., de Blok W. J. G., Madore B., Thornley M. D., 2008, AJ, 136, 2782
- Moran et al. (2010) Moran S. M. et al., 2010, ApJ, 720,1126
- Moran et al. (2012) Moran S. M. et al., 2012, ApJ, 745, 66
- Muñoz-Mateos et al. (2007) Muñoz-Mateos J. C., Gil de Paz A., Boissier S., Zamorano J., Jarrett T., Gallego J., Madore B. F., 2007, ApJ, 658, 1006
- Pettini & Pagel (2004) Pettini M., Pagel B. E. J., 2004, MNRAS, 348, L59
- Pérez et al. (2013) Pérez E. et al., 2013, ApJL, in press
- Poggianti et al. (1999) Poggianti B. M., Smail I., Dressler A., Couch W. J., Barger A. J., Butcher H., Ellis R. S., Oemler A., Jr., 1999, ApJ, 518, 576
- Saintonge et al. (2011) Saintonge A., et al., 2011, MNRAS, 415, 32
- Salim et al. (2012) Salim S. et al., 2012, ApJ, 755, 105
- Sánchez et al. (2012) Sánchez S. F., et al., 2012, A&A, 538, A8
- Skrutskie et al. (2006) Skrutskie M. F. et al., 2006, AJ, 131, 1163
- Strateva et al. (2001) Strateva I., et al., 2001, AJ, 122, 1861
- Wang et al. (2011) Wang J. et al., 2011, MNRAS, 412, 1081
- Weinmann et al. (2009) Weinmann S. M., Kauffmann G., van den Bosch F. C., Pasquali A., McIntosh D. H., Mo H., Yang X., Guo Y., 2009, MNRAS, 394, 1213
- Wild et al. (2007) Wild V., Kauffmann G., Heckman T., Charlot S., Lemson G., Brinchmann J., Reichard T., Pasquali A., 2007, MNRAS, 381, 543
- Wyder et al. (2007) Wyder T. K. et al., 2007, ApJS, 173, 293
- Yi et al. (2005) Yi S. K., et al., 2005, ApJ, 619, L111