The expansion proper motions of the extraordinary giant lobes of the planetary nebula KjPn 8 revisited
Abstract
The primary aim is to establish a firm value for the distance to the extraordinary planetary nebula KjPn 8. Secondary aims are to measure the ages of the three giant lobes of this object as well as estimate the energy in the eruption, that caused the most energetic outflow, for comparison with that of an intermediate luminosity optical transient (ILOT). For these purposes a mosaic of images in the H[N ii] optical emission lines has been obtained with the new Aristarchos telescope in 2011 for comparison with the images of the KjPn 8 giant lobes present on the POSSI–R 1954 and POSSII–R 1991 plates. Expansion proper motions of features over this 57 yr baseline in the outflows are present. Using these, a firm distance to KjPn 8 of 1.8 0.3 kpc has been derived for now the angle of the latest outflow to the sky has been established from HST imagery of the nebular core. Previously, the uncertain predictions of a bow–shock model were used for this purpose. The dynamical ages of the three separate outflows that form the giant lobes of KjPn 8 are also directly measured as 3200, 7200 and 5 yr respectively which confirms their sequential ejection. Moreover, the kinetic energy of the youngest and most energetic of these is measured as 1047 erg which is compatible with an ILOT origin.
keywords:
ISM: jets and outflows - planetary nebulae: individual (KjPn 8)1 Introduction
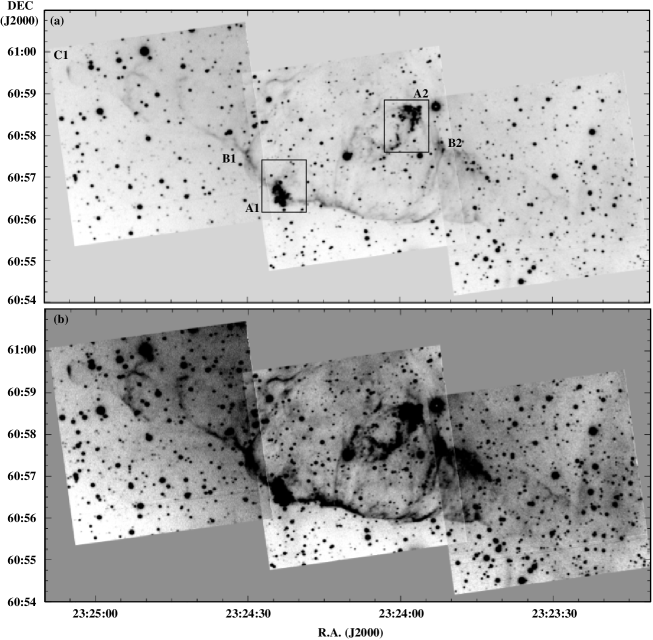
Three, short–lived, ejection events over a long period of time, and along different ejection axes, must have created the point symmetric ionized knots (A1 & A2, B1 & B2 and C1 marked in Fig. 1 (C2 may exist but be obscured by foreground dust) in the giant (14 4 arcmin2) lobes (López, Vasquez & Rodriguez, 1995) which project from the otherwise innocuous planetary nebula KjPn 8. The latter forms a bright 4 2 arcsec2 elliptically–shaped ring of optical emission surrounding a star of as yet unknown type (López et al., 2000). This central compact ring is the radiatively ionized inside surface of a small central hole in a much larger, 20 arcsec diameter, and massive, 0.007 , disk of neutral molecular gas (Huggins et al. 1997; Forveille et al. 1998).
Some of the characteristics of KjPn 8 and its giant lobes suggest their formation, similar to that of the poly–polar planetary nebula NGC 6302 (Soker & Kashi, 2012), by an intermediate–luminosity optical transient (ILOT) after the eruption identified in NGC 300 (Prieto et al., 2009). A precursor to this transient outburst is identified as a dust enshrouded 10 star and, with a peak luminosity of MV -13, the explosion is identified as an event with lower energy than a typical supernova explosion. The several months long outburst of an ILOT is thought to be powered by mass accretion onto a main sequence companion to an AGB (or extreme AGB) star. In order to form the point symmetric knots at different orientations in KjPn 8 the rotation axis of such an interacting binary star would have to have changed in time. Certainly, the point–symmetric knots (A1 & A2 in Fig. 1) which are aligned perpendicularly to the ellipse of the core of KjPn 8 have the ejection velocities in the hundreds of km s-1 (López et al., 1997) and could qualify for this ILOT origin.
Crucial to any interpretation of the nature and origin of KjPn 8 is sound knowledge of its distance, D. This has been given as D 1600 230 pc by Meaburn (1997 – Paper I) from measurements of the expansion proper motion (EPM) of the A1 & A2 outflow. This initial, but limited, measurement was made for only one sub–knot in this outflow by comparing its position on a 1954 Palomar Observatory Sky Survey (POSSI–R) plate to that on a comparable 1991 POSSII–R plate (i.e. over a 37 yr baseline).
This baseline has now been extended to 57 yr by obtaining a new H[N ii] image in 2011 for comparison with the earlier POSS images. This new H[N ii] image has not only permitted more detailed and accurate measurents of the EPMs of the A1 & A2 outflow, but has also led to the determination of their hitherto unknown values for the B2 and C1 features. Newly excited compact knots are also found in the most recent H[N ii] image of the A1 & A2 outflow. Any confusing star images have now been positively identified by taking a complimentary image in the adjacent red continumm light devoid of emission lines.
Furthermore, the tilt of the A1 & A2 outflow to the plane of the sky has now been estimated more certainly than in Paper I. When combined with this outflow’s measured radial velocity a more rigorous outflow tangential velocity, crucial to the determination of D from the measured EPMs, has now been obtained. In the present paper, because the measured (López et al., 1997) expansion velocity of the principal lobes is 300 km s-1, it is assumed that collisional ionization by hypersonic shocks must generate the optical emission lines. The high–speed knots and filaments that constitute these lobes have therefore been ejected from the central source. Any complication to the present measurements of the EPMs caused by any radiative ionization by Lyman photons from the central stellar system must be neglible, for bright rims associated with such ionization fronts would only propagate into the ejected material at the sound speed of 10 km s-1. A very similar situation occurs in the measurements of the lobe EPMs of the comparable multi–polar planetary nebula NGC 6302 (Meaburn et al., 2008) where the measured outflow velocities are 600 km s-1.
2 Imaging
2.1 Observations
KjPn 8 and its giant lobes were imaged at the f/8 Ritchey–Chretien focus of the 2.3-m Aristarchos telescope at the Helmos Observatory, Greece on August 18, 2011. Three pointing positions were used to cover the whole object with the 5 5 arcmin2 field of view of the CCD detector with its 1024 1024 data taking windows each 24 m square ( 0.28 arcsec square).
Exposures of 1800 s duration were obtained through the H[N ii], 40 Å bandwidth filter, centred on 6578 Å, on each pointing centre. These were complemented by exposures in the nearby continuum light each of 180 s duration through a 100 Å bandwidth filter centred on 6680 Å. All fields were projected on to a common origin on the sky and were subsequently combined to create the final mosaics in H[N ii]. During the observations the seeing varied between 0.8 and 1.2 arcsec. The image reduction was carried out using the IRAF and STARLINK packages. The astrometric solution for all data frames was calculated using the Space Telescope Science Institute (STScI) Guide Star Catalogue II (GSC–II; Lasker et al. 2008). All the equatorial coordinates quoted in this work, refer to epoch 2000.
3 Results
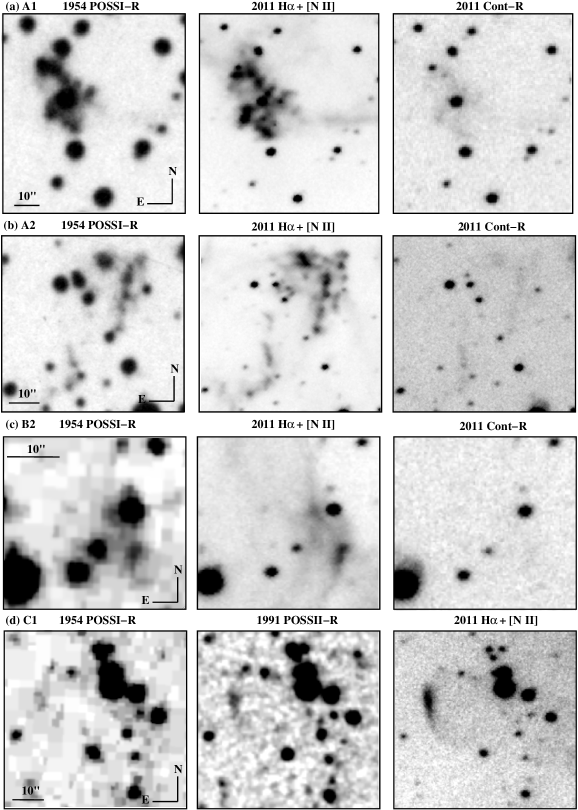
Small areas of the 2011 H[N ii] images covering the A1 & A2 and B2 knots are compared in Figs. 2a–c respectively with their 1954 POSSI–R images and red 2011 continuum images. POSS–I and POSSII–R images of the knot C1 are compared in Fig. 2d with the present 2011 H[N ii] image.
The Starlink CCDPACK programme CCDALIGN was used to scale, position the stars and orientate each frame identically in each set of three. The centroids of faint stellar images are positioned to within 0.1 arcsec of each other in each set after this process i.e. in each of the resultant three images of the same field any faint star, which has no significant PM of its own, has nearly exactly the same spatial pixel coordinates. The small differences in angular resolution between the 1954 POSSI-R and the new 2011 H[N ii] (see the similar angular size of the images of the faint star just to the north-west of Knot A2i, identified in Fig. 4 and displayed in Fig. 2b) do not affect this process. Only the ionized knots with significant EPMs change position between 1954 and 2011. Moreover, the brightnesses of some have changed considerably in this intervening period.
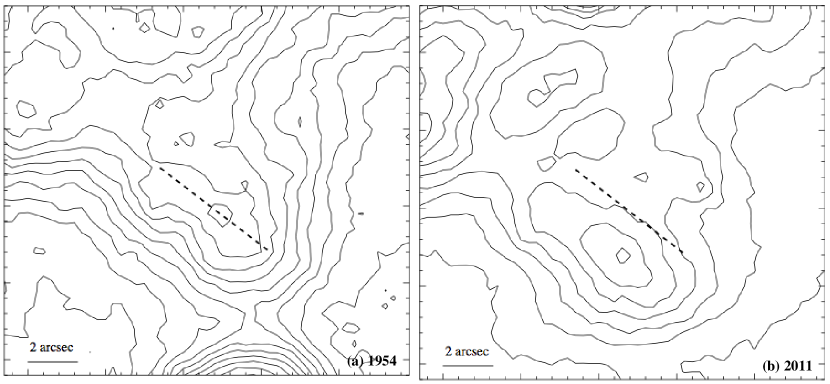
The detailed measurement of an EPM involved contouring the photographic density of an unresolved nebular knot or fine filament in the case of a CCDALIGN POSSI-R image for comparison with the contours of relative surface brightness in the corresponding CCDALIGN 2011 H[N ii] image of the pair. The displacement of the peak of a fine knot or ridge of a filament were simply then measured with a ruler on the two contour maps. This was repeated independently three times and the conservative errors quoted in Table 1 represent the spread in values from this process.
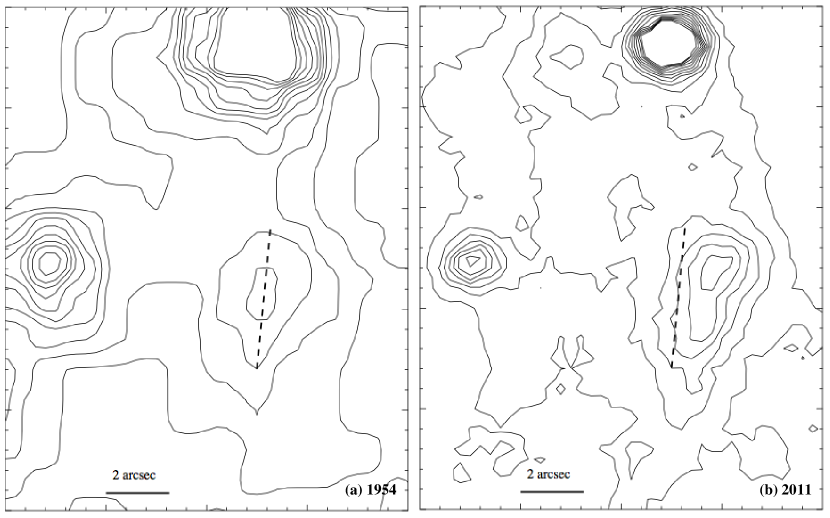
The A1 & A2 feature in Fig. 1a is the most notable bi–polar outflow with the EPMs very apparent when the 1954 and 2011 images (Figs. 2a and b) are ‘blinked’ using Starlink GAIA software. However, only compact knots or fine filaments which appear clearly in both images, separated by 57 yr, can be used to get accurate measurements of these EPMs. The 2011 H[N ii] brightness contours of those features that meet this criterion (A1a–c and A2a–i) are identified in Figs. 3 & 4 for the A1 and A2 outlows respectively. The axes of the outflows are also shown and confusing stellar images are marked with an ”S”. Contour maps of these knots in the 1954 POSSI–R image were compared with those in the 2011 H[N ii] image to give the EPMs and their position angles (PAs) to 5∘ as listed in Columns 2, 3 and 4 of Table 1. An example of this comparison for knot A1b is shown in Figs 5a & b. Only one position for knot B2 was measured in a similar way (Figs. 6a & b) and listed in Table 1. The data for B1 was too poor to permit an accurate measurement. An upper limit to the EPM for knot C1 is also given. The strange knot A2e is only listed with no measurement to draw attention to its appearance in 2011. It is not present in the 1954 POSSII–R image (see its identification in Fig.4 and presence in Fig. 2b).
The errors in the EPM measurents in Table 1 are mainly a consequence of the changing shapes of the individual knots between 1954 and 2011. This change is particulary noticeable for knot A2a as can be seen in Fig. 2b.
The validity of obtaining the EPMs of expanding lobes by comparison of nebular images on a POSSI-R 103a-E photographic plate with those obtained in 2011 using a CCD detector, as well as a different filter (with 40 Å bandwidth) and telescope, should be questioned. The H line at 6563 Å and the [N ii] 6548, 6584 Å nebular emission lines dominate all others in both observations with intensities relative to each other in the A1 lobe of 855, 1598 and 528 respectively (, 1998). However, the broader wavelength range ( 800 Å) of the POSSI-R observation also transmits the [S ii] 6716, 6731 Å nebular lines whose relative intensities are 548 and 410 respectively. This causes neglible problems in this comparison for the sensitivity of the Kodak 103a-E falls off rapidly towards the red: it is around 40 times less sensitive at 6730 Å than at 6563 Å (Westerlund, 1950). In any case, any residual detection of the [S ii] lines, because they originate in ions of similar ionization potential to those that emit the [N ii] 6548, 6584 Å lines, would make no significant difference to a determination of the position of a feature in a lobe of KJPn 8. The ratio of continuum starlight to the nebular emission line light is of course much higher in the broad band POSSI-R image than in the narrower bandwidth 2011 H[N ii] image. This leads to the detection of more faint stars and the spread in the photographic emulsion of the images of brighter stars in the POSSI-R data. However, the angular resolution is unaffected and very similar in both observations (see the faint stellar images in Fig. 2a-d). With these differences in mind only the changes in positions of the peak brightnesses of compact knots and fine filaments are measured in the present work.
Proof of the validity of this comparison and the simple method of analysis is found in Meaburn et al. (2008) and Szyszka, Ziljstra & Walsh (2011) both dealing with EPMs of similar high–speed lobes of NGC 6302. In Meaburn et al. (2008), nebular positions from a recent CCD narrow–band image are compared with those from a historic broadband image obtained with 103aE photographic emulsion and different telescope. The EPMs in Meaburn et al. (2008) match closely their values in the complementary measurements made by Szyszka, Ziljstra & Walsh (2011) employing only Hubble Space Telescope images.
Furthermore, the EPM rate of one bright knot in the A1 lobe in Paper 1 , where its change in position between the POSSI and POSSII surveys was compared, is reproduced, within the quoted uncertainties, in the present work. An identical method of analysis to that described here was employed.
The dynamical age of a feature given in Table 1 is its angular distance from the nebular core, measured using the image in Fig. 1, divided by its EPM rate.
4 Dynamical ages
The dynamical age of a knot assumes that its measured EPM, over a limited time interval, has been maintained during its whole passage from its point of origin to its present position. Obviously decelerations are likely to have occurred if it encounters a significant ambient medium since leaving the ejecting source. However, its value can give an indication of the sequence of events and it remains possible (Sect. 6) that the A1 & A2 as well as the B1 & B2 outflows have travelled through tenuous material in pre–formed large cavities.
Here, the ejecting source is assumed to be the central star at RA(2000) 23h24m10.408s DEC(2000) 60∘57′30.61″discovered in the Hubble Space Telescope image. The angular separations listed in Column 5 of Table 1 are the apparent distances from this star. The dynamical ages of the knots listed in Column 6 of Table 1 are then simply the division of these separations by the respective EPM rates in Column 4.
It is clear from these dynamical ages that the A1 & A2 outflows are the bi–polar consequence of the same event i.e. they have been ejected in opposite directions with the same speeds but along the same axis. Only the Knots A2h and A2i fail to fit this pattern. A2h appears to be moving at a substantial angle to the general outflow and A2i has a significantly smaller dynamical age. Excluding these two knots the mean dynamical age of the A1 & A2 outflows is 3200 yr.
With a dynamical age of 7218 yr knot B2 is a significantly older feature than the A1 & A2 outflows and with an age of 5 104 yr C1 must be the earliest event in the creation of the lobes surrounding KjPn 8.
5 Distance
There are several serious weaknesses in the determination of the distance, D, to KjPn 8 in Paper I. Firstly, the EPM of only one knot in the A1 & A2 outflow was derived from comparison of POSSI–R (1954) and POSSII–R (1991) images. It is sounder to include more knots in this measurement, as in the present paper, to avoid the possibility that a single knot could be unrepresentitive.
Furthermore, the crucial value of the angle to the plane of the sky, , of the outflow was determined using the predictions of the theoretical model of bow–shocks (Hartigan, Raymond & Hartmann, 1987). Firstly, this assumes that the emission is from bow shocks around multiple ejecta, which is most likely though not certain. Within this model it is assumed that the full width of the line profiles equals the difference in outflow velocity and the medium it is colliding with. The error on D quoted in Paper I includes only that from the EPM measurement and does not include any uncertainty due to these obvious weaknesses in its derivation.
Here ,these basic weaknesses have now been addressed: the EPMs of many knots within the A1 & A2 outflow and a direct value of , from a subsequent HST image of the nebular core, have both been determined.
From the values in Table 1 the weighted mean of the A1 & A2 outflow EPM (for knots A1a, b & c and A2a ,b, c, f & g) is 1.93 0.1 arcsec which in 57 yr gives an EPM rate of 33.9 0.18 mas yr-1. It seems most probable that the A1 & A2 outflow is along the axis of the central toroidal disk of KjPn 8 which appears as a 2.4″ 1.3″ elliptical ring. As this is assumed to be a circular toroid viewed at an angle then its axis must be tilted by = 32.6∘. As the magnitude of the difference in radial velocity = 180 km s-1 of both the A1 & A2 outflows, with respect to the systemic radial velocity, then the outflow velocity V 334 km s-1 and tangential velocity Vt 281 km s-1.
The relationship of D, EPM rate and outflow velocity V along a line at an angle to the plane of the sky is:
| (1) |
Insertion of the measured values in Eq. 1 therefore gives D 1.8 0.3 kpc. The uncertainty in D is larger than that given by the standard deviation of the EPMs in Table 1 alone for it must also include the range of values observed within the outflow and the uncertainty in the measurement of .
Incidentally, the large projected extents of the A1 & A2, B1 & B2 and C1 & C2 (?) lobes of 2.1 pc, 2.4 pc and 7.4 pc respectively are confirmed by this new distance measurement.
6 Discussion
The dynamical ages in Sect. 4 are the first direct evidence of the sequence of events that must have formed the giant lobes of KjPn 8. Firstly, the lobe culminating in C1 & C2(?) was formed by a collimated, but shortlived, bi–polar ejection (episodic jet) 5104 yr ago. Larger cavities around the path of this jet were then created most likely by the mechanism described by Steffen & López (1998). Both the B1 & B2 and A1 & A2 bipolar outflows have their brightest optical emissions where they collide with the edges of these large cavities 7200 and 3200 yr ago respectively. Within this interpretation these latter dynamical ages are likely to be the real ages because the ejected material will have travelled along different axes but through the low density ambient medium within the evacuated cavity interior.
The distance measurement to KjPn 8 of D1.8 0.3 kpc derived in Sect. 5 is on a far firmer footing than the previous one in Paper I. However, as its value in Paper I is close to this latest determination, the bow-shock interpretation of the full width of the line profiles (taken to be equal the outflow velocity– Hartigan, Raymond & Hartmann 1987) that was employed in Paper I, but not here, is vindicated. It is also interesting that the 15″ radius disk of CO emission surrounding the small optical core of KjPn 8 has an expansion velocity of 7 km s-1 (Forveille et al., 1998) to give a dynamical age of 2 104 yr when combined with this latest measurement of D. This implies that the creation of this central neutral disk not only certainly preceded the A1 & A2 bipolar ejection but also, marginally, that of B1 & B2.
A sound order–of–magnitude estimation of the kinetic energy (KE) of the outflows from KjPn 8 can now be made with D1.8 kpc after the volume of the ionized gas is estimated for the most energetic A1 & A2 bipolar outflow. With the local electron density Ne 100 cm-3 from the [S ii] ratios measured by (1998) the outflowing mass of A1 & A2 ionized gas is then 0.08 and with V334 km s-1 (Sect. 5) the KE 1047 erg is derived. Both this KE and V are then comparable to those for the poly–polar planetary nebula, NGC 6302, which led Soker & Kashi (2012) to suggest an ILOT origin. The older lobes of KjPn 8 defined by the C1 & C2(?) and B1 & B2 point symmetric features (see Table 1) may also have been generated by the same binary system with a rotating axis which culminated in the final ILOT outburst of which the A1 & A2 outflow is the consequence. The three axes of ejection of the KjPn 8 lobes, with different PAs, suggest alone their origin in a close binary system. Another criterion for this classification by Soker & Kashi (2012) in NGC 6302 is the Hubble-type nature of its outflowing lobes i.e. the outflow velocities along a lobe are proportional to the distance from the origin (see Meaburn et al. 2005, 2008; Szyszka, Ziljstra & Walsh 2011 for NGC 6302). There is only marginal evidence in Table 1 for this to be the case for KjPn 8. Perhaps, slower ’bullets’ within the A1 & A2 outflow are travelling within a cavity and not excited until they hit its boundary where they become excited knots. The recent appearance of Knot A2e, seen first in the 1991 image (Paper I) and here in the 2011 image but not in the 1954 one (Fig. 2b), suggests that this could be the case.
The detailed nature of the ionized knots in the A1 & A2 outflow, however, remains uncertain. Is the knotty optical line emission from concave bow–shocks, as seen from the central star of KjPn 8, around ‘bullets’, sprayed out in a wide bipolar cone, as they encounter the ambient medium or, alternatively, from convex bow–shocks as a bipolar cone of less collimated, ejected, material encounters dense clumps in the surrounding shell wall? The first possibility seems most likely though the string of knots coincident with the wall of the larger cavity of A1 in Fig. 3, of which Knot A1c is one of these, could suggest the latter possibilty is correct. Images of the knots in the optical emission lines, at higher angular resolution ( 0.1″), are now needed to determine the concave or convex nature of the bow–shocks.
The ILOT origin of the youngest A1 & A2 lobes of KjPn 8 would require an AGB star in a close binary system at the core of KjPn 8. A candidate for such a star (or its immediate AGB aftermath) must be the MERLIN 6 cm point ( 0.1″ diameter) thermal radio source which, though somewhat offset from the centre of the ionized ring of KjPn 8, is embedded in a larger knot of H emission within the nebular core. This object at RA(2000) 23h24m10.399s DEC(2000) 60∘57′30.14″ is separated by 0.34″ from the HST central star which corresponds, with D = 1.8 kpc, to an apparent separation of 800 AU whereas Soker & Kashi (2012) give a requirement of 5 AU for the mass transfer to occur in the central system of NGC 6302 within an ILOT configuration. A more detailed investigation of the stellar systems in the core of KjPn 8, particulary any assocated directly with the MERLIN radio source, are required before firm conclusions can be drawn. The MERLIN source could be the required close binary but within a more complex stellar system.
7 Conclusions
1) The EPM rates of the A1 & A2, B2 and C1 giant lobes of KjPn 8 are measured as 33.9, 19.3 and 8.8 mas y-1 respectively. The dynamical ages of these features are then 3200, 7,218 and 5 104 y respectively.
2) The outflow velocity of the A1 & A2 bipolar lobe is 334 km s-1 as derived from its measured changes in radial velocity and its angle of tilt with respect to the plane of the sky derived from HST imagery.
3) A very sound distance, D, to KjPn 8 is derived in the present paper as 1.8 0.3 kpc. This has been derived by combining the EPM rate of the A1 & A2 outflow, now for several unresolved knots, with the measurement of the radial velocity difference and the newly derived outflow angle, , to the plane of the sky.
4) This new value of D is very similar to the less certain one in Paper I which was derived from the EPM rate of only one knot in the A1 & A2 outflow combined with a more uncertain value of which depended on the theoretical predictions of a bow shock model. This similarity could suggest that the A1 & A2 line emission is originating in bow shocks and the theoretical predictions of the bow shock model are sound. Imagery of the A1 & A2 lobe at 10 times higher angular resolution could confirm the existence of bow shocks around small high–speed bullets.
5) A candidate for the dust enshrouded massive AGB star (or its immediate aftermath) that is required, if the youngest, and most energetic, A1 & A2 lobes of KjPn 8, originated in an ILOT event, could be the compact radio source in the central nebula. Any evidence that this is a close binary system should be searched for. The older C1 & C2 (?) and B1 & B2 lobes could then have been generated by less energetic ejections, from the same binary system, that preceded the final ILOT event.
Further consideration of ILOTs generally are outside the scope of the present paper.
Acknowledgements
JM is grateful to the hospitality of the National Observatory of Athens in June 2012 when this paper was initiated. The authors would like to thank C. Goudis for all the effort he put the last decade in order the ”Aristarchos” telescope to be operational. Based on observations made with the Aristarchos telescope operated on Helmos Observatory by the Institute of Astronomy, Astrophysics, Space Applications and Remote Sensing of the National Observatory of Athens.
References
- Forveille et al. (1998) Forveille T., Huggins P.J., Bachiller R. & Cox P., 1998, ApJ, 495, L111.
- Hartigan, Raymond & Hartmann (1987) Hartigan P., Raymond J. & Hartmann L., 1987, ApJ, 483, L57.
- Huggins et al. (1997) Huggins P. J., Bachiller R., Cox P. & Forveille T., 1997, ApJ, 483, L57.
- Lasker et al. (2008) Lasker, B. M., Lattanzi, M. G., McLean, B. J., et al., 2008, AJ, 136, 735.
- López, Vasquez & Rodriguez (1995) López J. A., Vasquez R. L. F. & Rodriguez L. F., 1995, ApJ, 455, L63.
- López et al. (1997) López J. A., Meaburn J., Bryce M. & Rodriguez L. F., 1997, ApJ, 475, 705.
- López et al. (2000) López J. A., Meaburn J., Rodriguez R., Vazquez R., Steffen W. & Bryce M., 2000, ApJ, 538, 233.
- Meaburn (1997) Meaburn J., 1997, MNRAS, 292, L11 (Paper I).
- Meaburn et al. (2005) Meaburn J., López J. A., Steffen W., Graham M. F. & Holloway A. J., 2005, AJ,130, 2303.
- Meaburn et al. (2008) Meaburn J., Lloyd M., Vaytet N. M. H., López J. A., 2008, MNRAS, 385, 269.
- Prieto et al. (2009) Prieto J. L., Sellgren K., Thompson T. A. & Kochanek C. S., 2009, ApJ, 705, 1425.
- Soker & Kashi (2012) Soker N. & Kashi A., 2012, ApJ, 746, 100.
- Steffen & López (1998) Steffen W. & López J. A., 1998, ApJ, 508, 696.
- Szyszka, Ziljstra & Walsh (2011) Szyszka C., Ziljstra A. A. & Walsh J. R., 2011, MNRAS, 416, 715
- (15) Vasquez R., Kingsburgh R. L. & López J. A., 1998, MNRAS, 296, 564.
- Westerlund (1950) Westerlund, B., 1950, ArA, 1, 91.
| Knot Parameters | |||||
| Knot | EPM | PA | EPM rate | Separation | dynamical age |
| arcsec | degrees | mas yr-1 | arcsec | yr | |
| A1a | 2.050.3 | 146 | 35.9 | 118 | 3284 |
| A1b | 1.770.2 | 136 | 31.6 | 115 | 3630 |
| A1c | 2.850.5 | 147 | 50.0 | 106 | 2116 |
| A2a | 2.400.5 | 317 | 42.1 | 110 | 2606 |
| A2b | 1.770.3 | 306 | 30.5 | 116 | 3810 |
| A2c | 2.130.3 | 306 | 37.4 | 114 | 3035 |
| A2d | 2.300.3 | 315 | 40.4 | 126 | 3121 |
| A2e | - | - | - | 124 | - |
| A2f | 1.800.3 | 300 | 31.6 | 111 | 3525 |
| A2g | 1.540.3 | 293 | 27.2 | 102 | 3739 |
| A2h | 2.960.5 | 10 | 51.9 | 78 | - |
| A2i | 2.700.3 | 336 | 47.4 | 75 | 1577 |
| B2 | 1.100.3 | 290 | 19.3 | 139 | 7218 |
| C1 | 0.5 | - | - | 423 | 5104 |