Gas infall into atomic cooling haloes: on the formation of protogalactic disks and supermassive black holes at
Abstract
We have performed hydrodynamical simulations from cosmological initial conditions using the AMR code RAMSES to study atomic cooling haloes (ACHs) at with masses in the range . We assume the gas has primordial composition and -cooling and prior star-formation in the haloes have been suppressed. We present a comprehensive analysis of the gas and DM properties of 19 haloes at a spatial resolution of (proper) pc, selected from simulations with a total volume of (comoving) Mpc3. This is the largest statistical hydro-simulation study of ACHs at to date. We examine the morphology, angular momentum, thermodynamical state, and turbulent properties of these haloes, in order to assess the prevalence of disks and massive overdensities that may lead to the formation of supermassive black holes (SMBHs). We find no correlation between either the magnitude or the direction of the angular momentum of the gas and its parent DM halo. Only of the haloes form rotationally supported cores. Two of the most massive haloes, however, form massive, compact over-dense blobs, which migrate to the outer region of the halo. These blobs have an accretion rate (at a distance of 100 pc from their center), and are possible sites of SMBH formation. Our results suggest that the degree of rotational support and the fate of the gas in a halo is determined by its large-scale environment and merger history. In particular, the two haloes that form over-dense blobs are located at knots of the cosmic web, cooled their gas early on (), and experienced many mergers. The gas in these haloes is thus lumpy and highly turbulent, with Mach numbers . In contrast, the haloes forming rotationally supported cores are relatively more isolated, located midway along filaments of the cosmic web, cooled their gas more recently, and underwent fewer mergers. As a result, the gas in these haloes is less lumpy and less turbulent (Mach numbers ), and could retain most of its angular momentum. The remaining 14 haloes have a diverse range of intermediate properties. If verified in a larger sample of haloes and with additional physics to account for metals and star-formation, our results will have implications for observations of the highest-redshift galaxies and quasars with JWST.
keywords:
galaxies: formation — large-scale structure of the universe — stars: formation — turbulence.1 Introduction
According to the paradigm of hierarchical structure formation, the dissipationless dark matter (DM) particles build up structures in the Universe from small building blocks to create increasing more massive DM haloes. Due to its ability to cool radiatively, the baryonic matter can loose pressure support and condense inside the DM haloes, forming the first luminous objects: stars, galaxies, and black holes (BHs).
The formation of the first stars has been extensively studied in the last decade by a number of authors (e.g. Abel et al. (2000); Yoshida et al. (2006); Turk et al. (2012)). These studies have shown that the first stars (pop III stars) were formed due to molecular hydrogen cooling inside DM haloes of at redshift as high as . Numerical simulations of the first stars were extended to the DM haloes in the mass range DM by e.g. Wise & Abel (2007), Greif et al. (2008), and Prieto et al. (2012) in order to study the physical processes involved in the formation of the first galaxies. Unfortunately, individual pop III stars (or even clusters of hundreds of these stars) are too faint to be detected even with current (and future) observations.
The possibility that the James Web Space Telescope (JWST) can observe the first galaxies, located in haloes times more massive than those hosting the first PopIII stars, is an exciting motivation to study the so-called atomic cooling haloes (i. e. DM haloes with a virial temperature ; hereafter ACHs – see e.g. Bromm & Yoshida (2011); Ferrara (2010) for a recent reviews). These types of haloes have been studied recently by Romano-Diaz et al. (2011) and Pawlik et al. (2011) in the context of galactic disk formation with smoothed particle hydrodynamic (SPH) simulations. Romano-Diaz et al. (2011) presented a low-resolution statistical study of haloes with masses above inside a highly biased over-dense region at , showing that every halo with mass above develops a gas disk structure. Pawlik et al. (2011) have studied the formation of a galactic disk inside a single halo using a high-resolution SPH simulation at the same redshift. Wise et al. (2012) similarly studied the formation of two proto-galaxies in high-resolution AMR simulations that also included star-formation and chemical and radiative feedback. Protogalactic disk formation inside ACHs has been studied using analytical (semi-phenomenological) approaches as well. Under the simple assumption (Mo et al., 1998) that the disk specific angular momentum is a fixed fraction of the DM halo specific angular momentum, Oh & Haiman (2002) found that most haloes are able to form a stable disks (the exceptions are haloes with very low spin parameter). Stringer & Benson (2007) extended the galactic disk study, taking into account the hierarchical nature of the structure formation. Under the assumption of conservation of specific angular momentum during the collapse process they studied the effect of mergers on disk formation, concluding that mergers have a significant impact on the prevalence of disks.
Pristine ACHs have been proposed as possible sites for the formation of supermassive black holes (SMBHs). If the gas were able to remain at a temperature of K in these haloes, it has been proposed that fragmentation may be avoided, allowing the formation of a supermassive black hole (SMBH) at the nucleus (Oh & Haiman, 2002; Koushiappas et al., 2004; Volonteri & Rees, 2005; Lodato & Natarajan, 2006; Spaans & Silk, 2006; Begelman et al., 2006). These SMBHs could then grow by another factor of by redshift and explain the puzzling presence of BHs by those redshifts (see, e.g., the recent review in Haiman 2012). A few groups have now performed simulations of gas collapse in such haloes (Wise et al., 2008; Regan & Haehnelt, 2009a, b; Latif et al., 2011), with the simplifying assumption that cooling can be avoided, which may be feasible in case the haloes are illuminated by a strong Lyman Werner background (Omukai, 2001; Bromm & Loeb, 2003; Shang et al., 2010). These works have indeed found no evidence of fragmentation.
In this paper we continue the study of ACHs using AMR simulations. Our work is motivated by the possible formation of galactic disks and SMBHs inside these haloes, as well as by the fact that these haloes may host the first galaxies that will be directly detectable by JWST. Our study is the largest in the literature based on hydrodynamical simulations, with a total of 19 haloes analysed at a spatial resolution of pc. We present, for the first time, a comprehensive study of gas and DM physical properties, including their spatial distribution, angular momenta, thermodynamical state, and turbulent properties. We go beyond commonly used diagnostic tools, such as spherically averaged profiles, and compute density and velocity power spectra, and density, velocity and temperature probability distribution functions. Using our sample of haloes, we attempt to identify the physical mechanisms that determine the angular momentum of the gas in the inner halo, and therefore whether a rotationally supported inner disk or a low-spin, compact dense cusp (and ultimately a SMBH) forms.
Although we find essentially no correlation between the magnitude or direction of the angular momenta of the gas and the DM haloes, there are clear differences between the haloes hosting the two types of inner gas: haloes with low-spin central cusps form in highly biased regions at super-knots of the cosmic web, and have cooled their gas early on and undergone many mergers. This results in a lumpy and highly turbulent medium that could produce efficient transfer of angular momentum. On the other hand, the rotationally supported core is found in haloes that are located midway along cosmic filaments, cooled relatively more recently, and have experienced fewer mergers. The gas in these haloes is less lumpy and less turbulent and could retain most of its angular momentum. By a detailed study of the turbulent properties of the intra-halo medium (hereafter IHM) we have found that turbulence plays a major role at dissipating (or preserving) angular momentum via fragmentation of the IHM. Turbulence in turn is fed by the merging process. We will show that compact over-dense blobs (COBs) form in highly biased regions at the centers of super-knots, while rotationally supported cores (RSCs) form in the middle of filaments in nearly un-biased regions. Our numerical experiments suggest that neither rotationally supported disks nor SMBHs are a common occurrence in ACHs, and should be followed up by studying a larger sample of haloes, with more realistic gas physics and more detailed analyses of turbulent angular momentum transport.
The paper is organized as follows: In section §2 we describe the details of our numerical simulations and our halo sample. In §3, we explain our analysis and show the physical quantities extracted from the simulations. In section §4, we discuss our results and finally in §5 we present our conclusions.
2 Numerical Simulation Details
We used the AMR code RAMSES (Teyssier, 2002) with a modified non-equilibrium cooling module (Prieto, Infante, & Jimenez, 2008) in order to study the main physical properties of both DM and gas components of 19 ACHs in the mass range M⊙ to M⊙. We assumed the gas has primordial composition, and switched off all molecular cooling processes, allowing the gas to cool down only due to atomic hydrogen and helium lines.
We worked in a concordance CDM cosmological model: , , , , and (Komatsu et al., 2011). The dynamical initial conditions were taken from mpgrafic (Prunet et al., 2008) and the initial abundances of H, H+, He, He+ and He++, D, D+ and from Galli & Palla (1998) at (the initial redshift of the simulations).
First, we performed a number of DM-only simulations with 2563 particles inside (3 Mpc)3, (5 Mpc)3, (5.5 Mpc)3 and (8 Mpc)3 boxes in order to look for ACHs, i.e., haloes with virial temperatures TK, which corresponds to a M⊙ at . The relation was taken from Bryan & Norman (1998) and refers to the mass for a DM overdensity with a density contrast . In this study, we focus on , which corresponds to the epoch when ACHs are “2-” objects and begin to have a significant abundance (a few per Mpc3). Using the HOP algorithm (Eisenstein & Hut, 1998) we identified DM haloes in the DM simulations outputs at this redshift. Our goal was to study the simplest, relatively isolated first protogalaxy, and we therefore avoided haloes that are undergoing an obvious merger at . We have found that mergers are very common at high redshift, and we have rejected many simulations (containing pre-selected haloes) in which no such isolated DM halo was found, before arriving at a sample of 19 suitable, non-merging DM haloes. We then performed a new set of gas+DM simulations for these 19 haloes, in 19 different runs. Each of these re-simulation runs were performed with DM particles inside the corresponding original simulation volume. from to in order to follow the main process of gas collapse into the ACHs at higher resolution. In Table 1, we summarize the properties of our 19 haloes, and the simulations in which they were identified. The virial quantities are computed from the halo mass taking the expressions of Bryan & Norman (1998). Each of our simulations used CPU hours (for a total of total CPU hours for the whole simulation suite) on a cluster with cores and TB of distributed memory.
| Halo | Halo mass | Tvir | Rvir | Object | Box | mDM | Resolution |
|---|---|---|---|---|---|---|---|
| (number) | (M⊙) | (K) | (kpc) | (Mpc) | (M⊙) | (pc) | |
| 1 | 5.35 | 2.34 | 0.72 | RSC | 3.0 | 7.38 | 8.3 |
| 2 | 1.02 | 3.60 | 0.89 | – | 3.0 | 7.38 | 8.3 |
| 3 | 1.47 | 4.59 | 1.00 | – | 3.0 | 7.38 | 8.3 |
| 4 | 1.56 | 4.78 | 1.02 | – | 3.0 | 7.38 | 8.3 |
| 5 | 3.21 | 7.73 | 1.31 | – | 3.0 | 7.38 | 8.3 |
| 6 | 3.39 | 8.02 | 1.33 | – | 3.0 | 7.38 | 8.3 |
| 7 | 3.99 | 8.94 | 1.40 | RSC | 5.5 | 4.55 | 15.3 |
| 8 | 4.59 | 9.81 | 1.47 | – | 5.0 | 3.42 | 13.9 |
| 9 | 4.78 | 1.00 | 1.49 | – | 3.0 | 7.38 | 8.3 |
| 10 | 5.00 | 1.03 | 1.51 | – | 3.0 | 7.38 | 8.3 |
| 11 | 5.40 | 1.09 | 1.55 | – | 5.0 | 3.42 | 13.9 |
| 12 | 5.72 | 1.13 | 1.58 | RSC | 5.5 | 4.55 | 15.3 |
| 13 | 7.81 | 1.39 | 1.76 | – | 3.0 | 7.38 | 8.3 |
| 14 | 8.35 | 1.46 | 1.80 | – | 5.5 | 4.55 | 15.3 |
| 15 | 8.60 | 1.49 | 1.81 | – | 3.0 | 7.38 | 8.3 |
| 16 | 9.22 | 1.56 | 1.86 | COB | 3.0 | 7.38 | 8.3 |
| 17 | 1.48 | 2.14 | 2.18 | – | 5.5 | 4.55 | 15.3 |
| 18 | 1.53 | 2.19 | 2.20 | COB | 5.0 | 3.42 | 13.9 |
| 19 | 1.87 | 2.50 | 2.35 | – | 8.0 | 1.39 | 22.1 |
Throughout this study, we adopted the following refinement strategy: if there were more than DM particles inside a cell, then the cell is refined; if the gas density inside a cell is more than times the average density inside the whole box, then the cell is refined, and if the linear cell size is larger than its corresponding Jeans length, then the cell is refined (Truelove et al., 1997). The maximum level of refinement was , corresponding to a proper resolution at of , , , and pc in the (3 Mpc)3, (5 Mpc)3, (5.5 Mpc)3 and the (8 Mpc)3 box, respectively. Our resolution corresponds to of the virial radius and it is not adequate to resolve structures in the inner core of the halo. We therefore set a gas temperature floor, , in order to avoid numerical fragmentation. This temperature floor was based on the Truelove criterion that the Jeans length must be resolved by 4 cells,
| (1) |
where is the Jeans length, is the proper cell size at a given level of refinement .
In their recent study of primordial star formation study with magnetic field and non-equilibrium chemistry, Turk et al. (2012) show that a much higher number (64) cells per Jeans length is required to achieve convergence in the ultra-dense center of the halo. Since here we do not include chemistry or magnetic fields, and we are not interested in studying the gas collapse process at sub pc scales, the standard Truelove criterion should be adequate for our purposes. We then obtain the gas temperature floor at a given level of refinement as
| (2) |
where is the Newton’s gravitational constant, is the mean molecular weight, is the proton mass, is the gas mass density, is the Boltzmann constant and is the proper simulation box size. Assuming (appropriate for the nearly neutral K primordial gas in our case) and , at can be written as
| (3) |
This temperature floor is much lower than the atomic cooling temperature threshold K, so it does not affect the thermal evolution of the gas unless its number density exceeds cm-3. In most of our haloes, the gas does not reach such high densities and the temperature floor is not activated. However, there are two exceptions, where the number density in the core reaches up to cm-3. In these cases the gas temperature in the central over-dense regions does not have a physical meaning (nevertheless, as we will see below, our results are sufficient to argue that conditions in these cores may be most favourable for forming SMBHs).

3 Results
In this section, we present an exhaustive list of physical quantities extracted from our 19 simulated haloes. These include traditional global measures (such as gas mass fractions, as well as the geometrical shapes and spin parameters for both the DM and the gas), radial profiles (density, temperature, and angular momentum), three–dimensional morphologies, as well as phase diagrams for the gas. In addition, we present several less commonly used diagnostics, such as probability distribution functions (gas density, temperature and velocity), and a Fourier analysis (including power spectra of gas density and velocity), which will help us to understand the physical conditions in ACHs at their collapse at .
3.1 Gas fractions and phase diagrams
We computed the baryon mass fraction inside each of the 19 haloes at three different radii: 0.5, 1, and 2. Here the virial radius is measured from the center of mass of the DM halo. Figure 1 shows these mass fractions as a function of the halo mass. The average baryon mass fractions are , which correspond to 39%, 57% and 92% of the cosmic average value (). This is lower than the observed average value found by Romano-Diaz et al. (2011) at the same redshift and for the same range of masses using SPH simulations. Our value is also lower than values typically found in galaxy cluster simulations at low redshifts (e.g., Gottlber & Yepes (2007), Ettori et al. (2006) and Kravtsov et al. (2005)).
The low baryonic mass fractions we find might be partly due to the fact that the gas temperature is not too far below the virial temperature, so that gas pressure can affect the dynamics and delay the collapse of the gas. Interestingly, however, the mass fractions lack any obvious trend with halo mass (or with ), as one would expect. The lack of this trend suggests that turbulence, generated at the time of virialization (Wise & Abel, 2007), can provide additional pressure support, and delay gas collapse even in more massive haloes, where thermal pressure is less important. The hypothesis that gas has not yet fully collapsed in the haloes will be supported by our results below on spin misalignment angles and the gas spin parameters.
Harford et al. (2008) show that the baryon mass fraction increases inside smaller radii and it reaches a value near the cosmic average at . The values in Figure 1 decrease as the average volume (and radius) decreases. In other words, there is no evidence of an overall concentration baryons near the DM halo center of mass in our simulations, suggesting that thermal and turbulent pressure can delay gas collapse even inside 0.5.
Figure 1 also shows a large scatter in , with halo-to-halo variations by an order of magnitude. Despite the low average at , we find three haloes with near the universal value even at . As we will show below, these haloes are the ones with high central gas spin parameters and low misalignment angles between gas and DM spin.
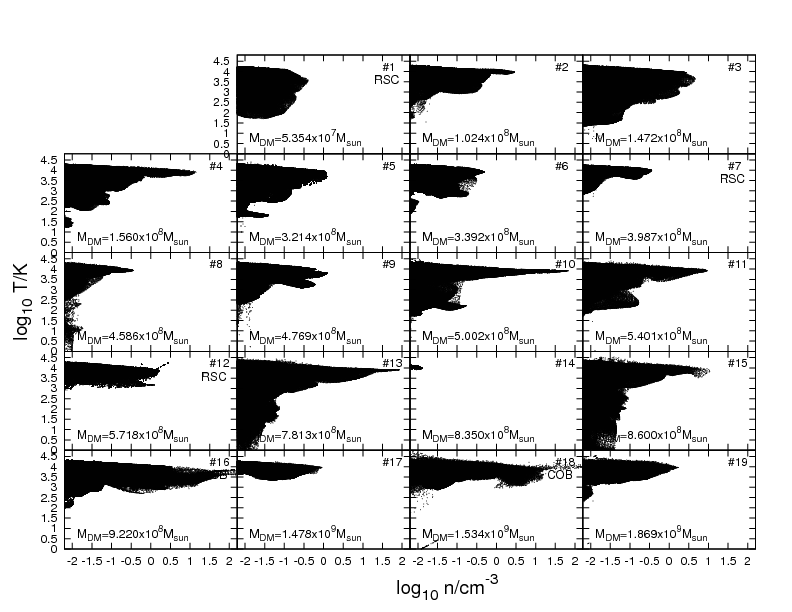
In Figure 2, we show the density-temperature phase diagrams for gas inside . The figure shows that at the highest densities, most of the gas is heated by shocks and by compression above the K limit, but radiative cooling keeps the gas temperature near this value. At lower densities, a range of temperatures is seen, with a significant amount of cooler gas that has not yet been heated and some gas still significantly above K. Also seen in this figure are a few haloes in which the gas density is prevented from reaching high values (). As we will see below, some of these haloes have a high degree of rotational support near their center (including three haloes, #1, #7, and #12, with full rotational support).
3.2 Shape of the DM halo and its gas content
In order to quantify the morphology of both the gas and the DM components, we computed ratios of the three semi-axis of the ellipsoids, characterized by the eigenvalues of the gas/DM moment of inertia tensor inside the virial radius . The moment of inertia tensor was computed from its standard definition
| (4) |
where and label Cartesian coordinates , and , is the distance from the DM (gas) center of mass to the DM particle (gas cell) and is the Kronecker delta function.
Given the three eigenvalues of , the semi-axis follow the relations
| (5) |
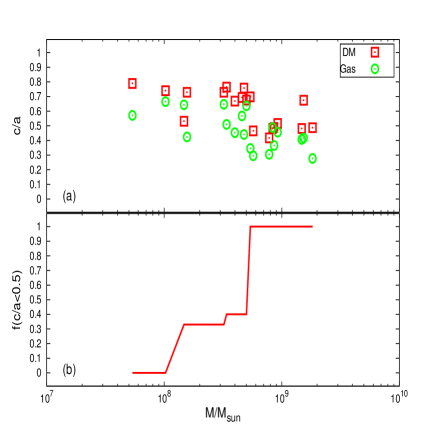
Figure 3(a) shows the semi-minor to semi-major axis ratio as a function of the halo mass. It is clear that the DM component (squares) tends to be more spherical than the gas component (circles). The average value is for the DM and for the gas. Figure 3(b) shows the fraction of haloes with the gas ratio below . For masses above M⊙ all haloes show . This plot is similar to Figure 3(c) in Romano-Diaz et al. (2011), from which they conclude that the disk fraction is 100% for more massive haloes. However, as we will see below, despite of the low , it is far from being rotationally supported.
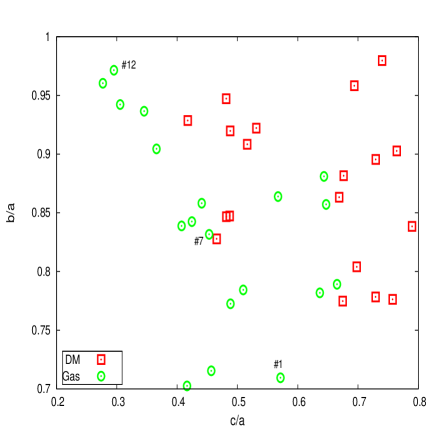
In general, the set of criteria that defines a conventional, rotationally supported disk should include: (i) low ratio together with ; (ii) alignment of the gas angular momentum vector with shortest principal axis and (iii) a gas spin parameter . Figure 4 shows the 19 haloes in the plane. As this figure illustrates, the DM component (squares) tends to populate the high ratio region in the plane, while the gas component (circles) tends to reach much lower values. This would be expected if the gas is able to collapse in the direction perpendicular to the angular momentum vector to assume a more flattened shape. We computed the misalignment angle between the angular momentum and the shortest semi-axis ”a” (inside ) and found that there is an offset of between 30-90 degrees in the whole sample. Overall, the shapes of the DM and the gas are both typically quite triaxial. The shapes of the gas and DM nearly remain closer to prolate rather than oblate (), with average ratios of for the gas and for the DM. This feature has been seen, e.g. in the DM-only simulation of Vera-Ciro et al. (2011) where the DM matter haloes develop a prolate shape at the beginning and evolve to an oblate shape at later times.
3.3 DM halo vs. gas angular momentum
Doroshkevich (1970); White (1984); Heavens & Peacock (1988) showed that the initial angular momentum of a system in a hierarchical Universe is proportional to both the tidal tensor and to the moment of inertia tensor
| (6) |
The evolution of the angular momentum of DM haloes in a cosmological context has subsequently been revisited by, e.g. Vitvitska et al. (2002), to study the importance of mergers. They found that the angular momentum typically has increases sharply in major mergers, and declines steadily during periods of gradual accretion of small satellites. The angular momentum evolution has moved from a picture where the tidal forces due to the neighboring structures are solely responsible for the halo spin to a picture in which the merger history of the halo has a significant impact.
In order to study the global rotational features of our systems, we computed the spin parameter defined by Bullock et al. (2001a):
| (7) |
The definition of in eq. 7 corresponds to times the ratio between the angular velocity and the angular velocity of a rotationally supported system with the same mass and radius (i.e. , the gas/DM mass inside the virial radius). with
| (8) |
is the gas/DM angular momentum. This quantity is computed with respect to the gas/DM center of mass and the velocities are corrected by the gas/DM center of mass velocity; is the gas/DM mass at position . All these quantities are computed inside the virial radius of the halo.
It has been shown by a number of works (e.g. Bullock et al. (2001a) and references therein), that the spin parameter follows a log-normal distribution:
| (9) |
where is defined by (the geometric average of the spin parameter for haloes) and is its standard deviation. Bullock et al. (2001a) have shown these parameters have values and .
In order to study the correlation between the DM and gas spin orientations, we also computed the misalignment angle between their spin directions,
| (10) |
Figure 5(a) shows the spin parameters for both gas (circles) and DM (squares) as a function of halo mass. The average values over the 19 haloes are nearly identical, and . The average DM spin value is in good agreement with that found in a previous study using N-body simulations and focusing on high-redshift haloes (Davis & Natarajan, 2009). Overall, the result is also consistent with the usual simple picture in which the DM and gas initially have similar spin parameters at the virial scale. However, we do find an average ratio of . This value is higher than the values reported by Gottlber & Yepes (2007) for M⊙ haloes at low redshift, and also higher than the simple ratio . This is because the gas spin parameter tends to be noticeably smaller (by a factor of two) than the DM spin parameter at masses MM⊙. At higher masses, the gas spin parameters increase and exceed the DM spin in some cases. This tendency is illustrated more clearly in Figure 5(b), where we show the ratio between the gas and DM spin parameter as a function of the halo mass. Figure 5(c) shows v/s . There is no a clear trend among these two quantities. This fact will be supported below by the measurement of the misalignment angle among gas and DM angular momentum. Kimm et al. (2011) have recently studied the relative angular momenta of gas and DM haloes, and also found significant differences. In particular, they found that the discrepancy between the specific angular momentum of the gas and the DM in the region is due to the cooling process governing the gas dynamics. The gas is accreted through cold filaments into the inner regions of the halo, where it condenses; however, the accreted DM crosses the central region and redistributes the angular momentum in the outer regions of the halo.
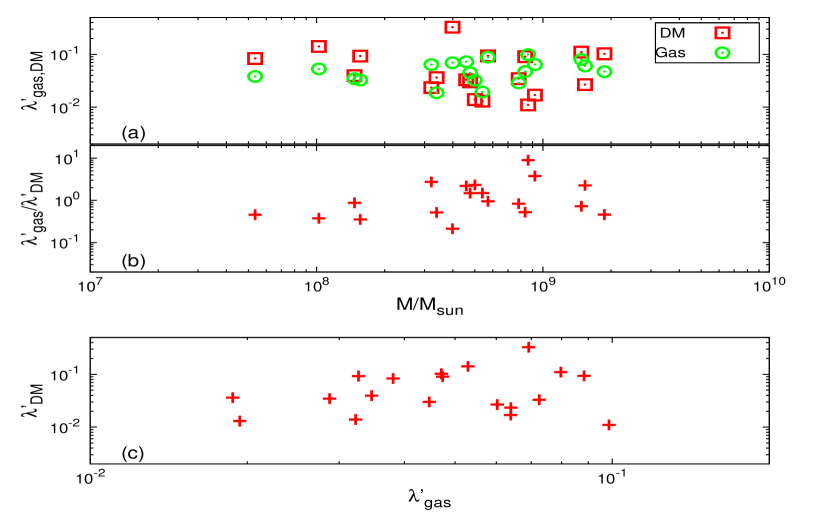
Figure 6 shows the angle between the DM and the gas angular momentum vectors. The DM and gas spins are misaligned for all 19 haloes we analyzed, by an average angle . This angle is almost 5 times the average misalignment angle of around found by Sharma & Steinmetz et al. (2005) at , using the SPH technique. Figure 6 shows no trend of with halo mass, and clearly shows that despite their similar magnitudes, the gas and DM spins must have different physical origins. Interestingly, we find that the three most aligned systems have high gas spin parameters and high baryonic mass fractions. This suggest that the gas in these haloes has collapsed enough to be aligned.
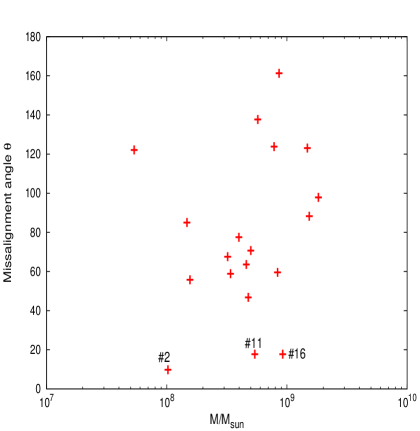
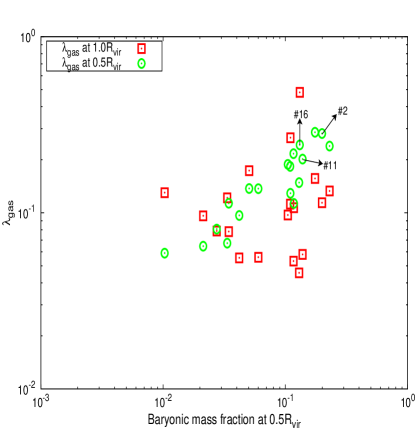
Figure 7 shows the correlations between the baryonic mass fraction , and the gas spin parameter within both (squares) and (circles). There is a clear correlation between and , showing that gas inside haloes with more collapsed gas reaches a higher spin. In particular, the three haloes with the lowest misalignment angles present high and . This is consistent with the simple picture in which the DM and gas have similar angular momenta at larger radii, but the gas can continue to collapse along their mutual angular momentum axis, and is spun up by a larger factor - eventually this could lead to disk formation.
3.4 Radial profiles
We computed the radial profiles of different quantities for both the gas and the DM component of each halo. This includes the mass-weighted specific angular momentum and the mass density, separately for the gas and the DM. For the gas component, we additionally computed the mass-weighted temperature. All quantities were computed as spherical averages centered at the component (gas/DM) center of mass. Note that this, in general, does not coincide with the point with the highest density.
More specifically, the mass-weighted average value of a physical quantity was computed as
| (11) |
where is the position of each DM particle or hydro cell inside an spherical element of volume given by . The averaging bin takes the value for gas and for DM, with the minimum resolved scale of the simulation; is the DM or baryonic mass at the position . is the total DM or baryonic mass inside the averaging volume and .
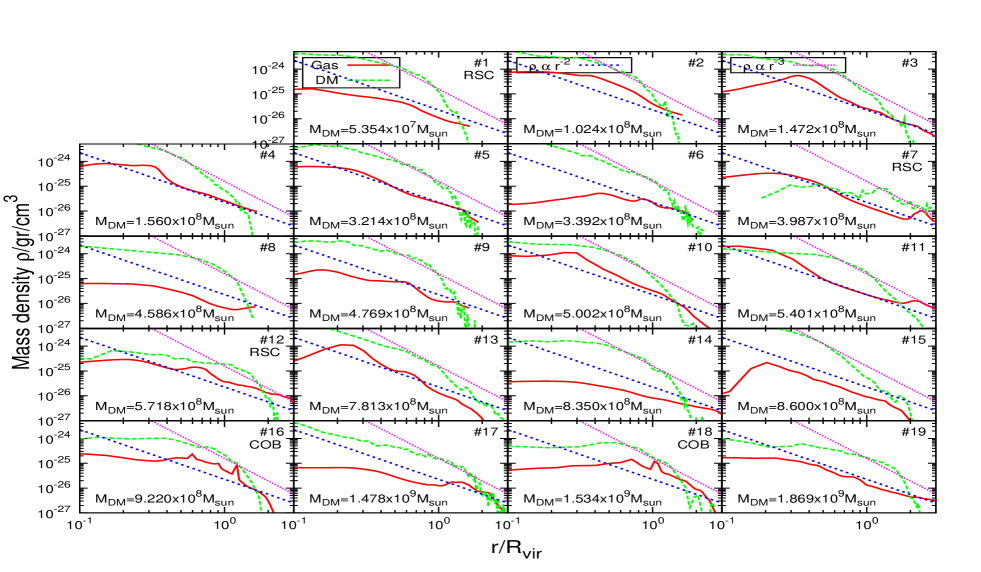
Density profiles. Figure 8 shows both the gas (solid line) and DM (long-dashed line) density profiles. As mentioned above, the DM and gas component are centered at their respective center of mass. This is the reason why the highest densities are not located at . For reference, the short-dashed line shows the isothermal radial profile and the dotted line show a , the NFW density profile at large radius (Navarro, Frenk & White, 1997). These power-law profiles are not good descriptions of the majority of the profiles (especially for the baryons) but are good approximations over limited ranges of radii (especially for the DM profiles in the outer halo near ).
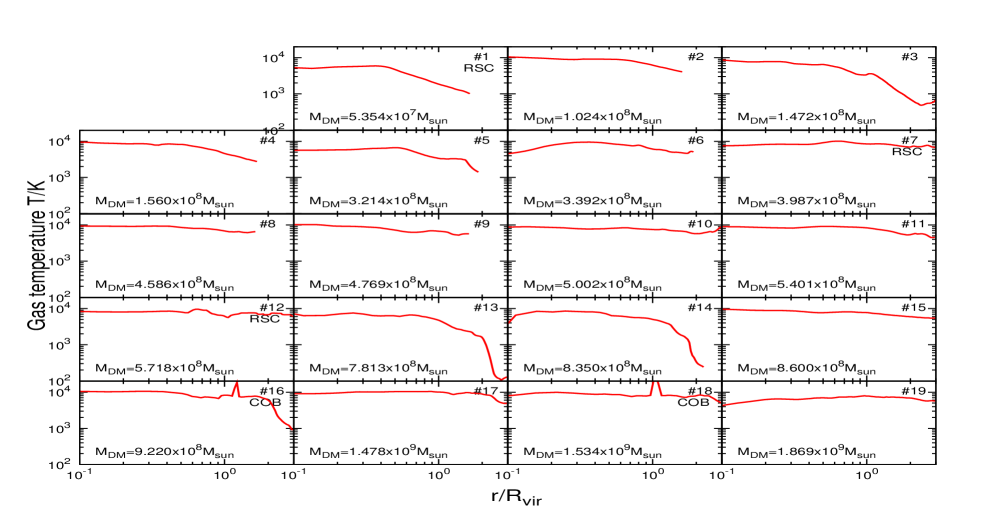
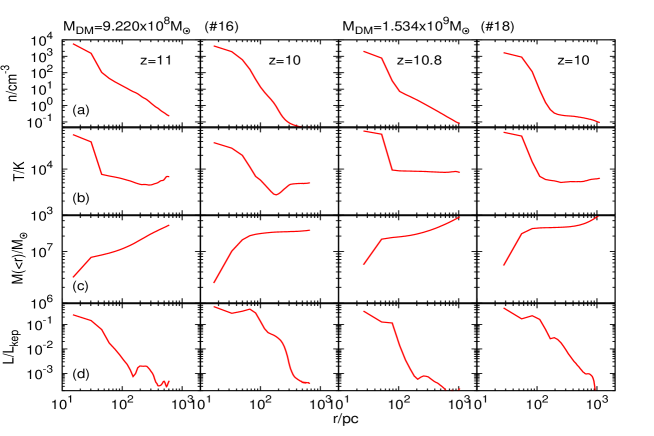
Temperature profiles. The temperature profiles are shown in Figure 9. As expected from ACHs, the gas temperature is almost constant around K inside the virial radius. This temperature is not affected by the numerical temperature floor in eq. (3), because at the densities we resolve inside these haloes, is much lower than K. The two exceptions are the sharp peaks in the temperature profiles of haloes #16 and #18 near (in the bottom row). These correspond to strong overdensities (as shown in Fig. 8) which formed at . Despite our poor spatial resolution, as we will argue below, these runaway overdensities are candidate sites for SMBH formation. These objects have masses of M⊙ and M⊙ for haloes #16 and #18 (with halo masses of M⊙ and M⊙, respectively). Interestingly, in both cases, the strong gas overdensities are located near the virial radius, rather than near the halo center. It is tempting to conclude that we are seeing a merger, and to associate the overdensities with the cores of the merging partner haloes. However, this is not the case: the overdensities are seen only in the gas and not in the DM. In other words, the dense gas “blobs” are not at the center of another DM halo. We have examined the evolution of the gas distribution over time, and have found that the overdensities are produced in large–scale, highly supersonic shocks, and are originally located near the center of the halo. The gas flows producing the blobs are not perfectly radial toward the center of the halo, however, and the interacting gas shows a velocity relative to the halo’s center of mass. The over-dense blob itself, produced by the strong supersonic shocks, has a significant residual velocity relative the halo’s center of mass. This residual velocity exceeds the escape velocity from the central region of the halo, allowing the blob to travel to the outer region of the halo within a dynamical time. A similar phenomenon has been seen in numerical simulations of star-forming regions (Padoan et al., 1997).
To examine these blobs further, in Figure 10 we show their radial profiles at two different redshifts, re-centered at the center-of-mass of each blob. Row (a) shows the gas (number) density profiles, and row (b) shows the temperature profiles. As mentioned above, inside pc, the gas temperature increases unphysically, because the activation of the temperature floor (we emphasize that our results are conservative, in the sense that without the temperature floor, the blobs should have collapsed further and reached even higher densities). Row (c) shows the enclosed gas mass and row (d) shows the specific angular momentum, divided by the Keplerian value at each radius. This ratio is always below unity, but increases toward smaller radius, reaching a maximum value of at the innermost regions. This value is similar to the values shown by Regan & Haehnelt (2009a) in their Figure 7 at few pc. As in that paper, these blobs can be similarly argued to be sites where compact disks, and eventually SMBHs, may form. Due to the lack of our spatial resolution, however, we can not say more about the inner structure of these blobs.
We next compute the mass accretion rates (at ) onto the dense blobs as follows:
| (12) |
where is the gas grid position measured from the blob’s center of mass, its modulus, and is the unit vector in that direction; is the radius averaged in a finite shell, is the density at and is the gas velocity with respect to the blob’s center-of-mass velocity at . We have found at a distance pc. This value should, of course, be taken only as an upper limit for the rate that would reach any putative SMBH forming near the center of the COB. This rate is roughly in agreement with the rates typically found inside atomic cooling haloes (O’Shea & Norman, 2007; Shang et al., 2010). This latter value is of order the mass accretion rate expected in a self-gravitating gas at temperature K.
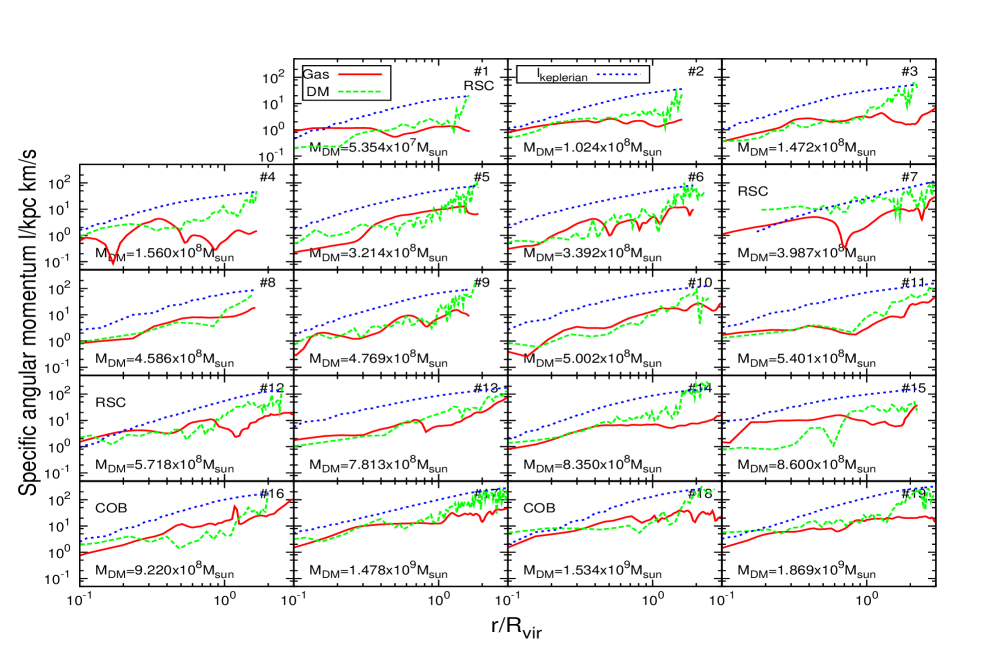
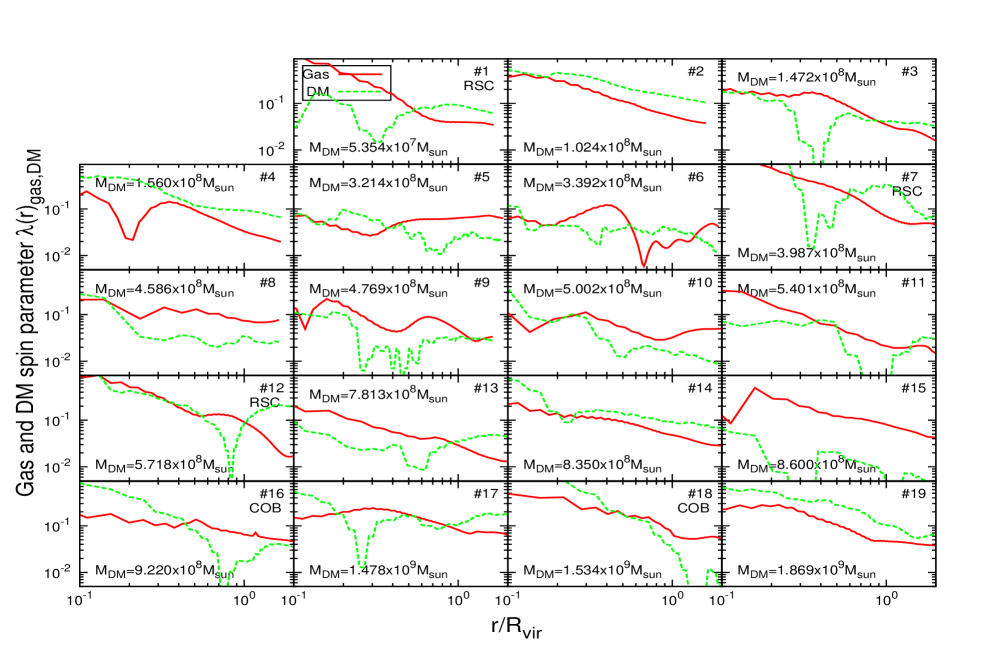
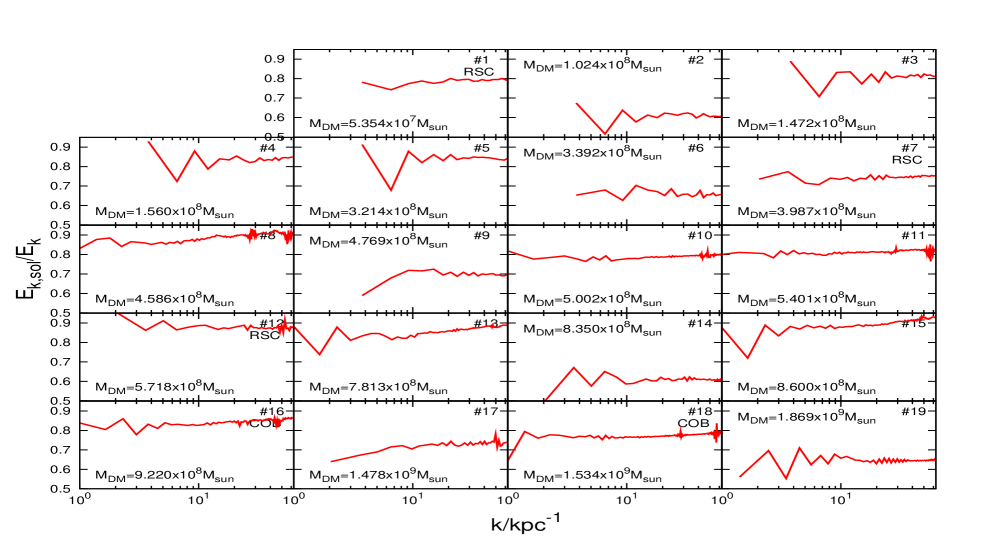
Angular momentum profile. Figure 11 shows the profiles of the specific angular momentum (SAM) for both gas (in solid line) and DM (in long-dashed line). Overall, the DM and gas SAM trace each other well at small radii in most of the haloes. This agreement break down outside , where the DM SAM exceeds the gas SAM, and increases more rapidly with radius, as well. The short-dashed line shows the Keplerian SAM profiles, computed for the density profiles found in the simulations (Fig. 8). At radii , the Keplerian curves are higher than the real gas SAM, showing that the gas is not rotationally supported. At smaller radii there are three haloes (#1, #7, and #12, with , and ) in which the gas SAM reaches the Keplerian value, suggesting the existence of rotationally supported disks in the inner regions of these three haloes. However, inspection by eye does not reveal geometrical disks for these three haloes. In the inner 0.1, we find axis ratios of and . In particular, the semi-minor to semi-major axis ratio is close to the ratio between the sound speed and the circular velocity; consistent with thermally supported “fat disks” expected when the gas temperature is not significantly below the virial temperature (Oh & Haiman, 2002; Regan & Haehnelt, 2009a). Hereafter we refer to these objects generically as having rotationally supported cores (RSCs). Figure 12 shows the corresponding gas and DM spin parameter profiles. As shown in Figure 5(b), the gas spin parameter is higher than the DM spin parameter in some of the haloes at ; overall, there seems to be little correlation between the details of the two. For most of the haloes, increases at smaller radii. As seen already in Figure 11, there are three cases in which the gas spin parameter reaches , this happens at radii . The cores of these three haloes within this radius are rotationally supported. Interestingly, even in these three cases, there is a significant misalignment between the direction of the shortest (semi-minor) axis and the angular momentum vector, by an angle when measured inside .
3.5 Beyond spherically averaged profiles
3.5.1 Power spectra of the intra-halo medium
We next perform a Fourier analysis, in order to understand the properties of the turbulent environment through which the gas collapses into the DM haloes. The power spectrum of a physical quantity is the square of the Fourier transform averaged on spherical shells of radius in wave number space. Following the above definition we computed the gas mass density power spectrum (PS), in a box of side around the halo’s center of mass, as:
| (13) |
and the gas velocity PS
| (14) |
where () is the Fourier transform of the gas velocity (density), () is its complex conjugate, and is the modulus of the wave number. For the velocity field, we have subtracted the motion of the center of mass, to avoid any spurious turbulence. The pre-factor of in the velocity power spectrum converts this quantity into the kinetic energy stored in wave numbers around . With this factor included, we computed the fraction of the kinetic energy in solenoidal modes,
| (15) |
where the compressional () and solenoidal () components of the velocity field are given respectively by
| (16) |
and
| (17) |
In turbulent fluid dynamics, there are two well–studied limits for the turbulent energy power spectrum: the 1D Burgers spectrum and the 3D Kolmogorov spectrum (Kolmogorov, 1941). The first one describes a system with velocity and a fluid viscosity governed by the equation
| (18) |
For a high Reynolds number or (applicable for this work), eq. 18 describes the evolution of a 1D shock wave. Despite the one-dimensionality of the Burgers equation, it is often used as a reference for turbulent 3D fluids. A different 3D treatment comes from the seminal work of Kolmogorov (1941). In this theory, the statistical properties of a turbulent fluid with viscosity , mean energy dissipation rate per mass and a minimum scale associated to the energy dissipation (by viscosity) are fully determined by these three (or two if ) quantities in the inertial scale range: , with the scale associated to the source of the turbulence (in our case ).
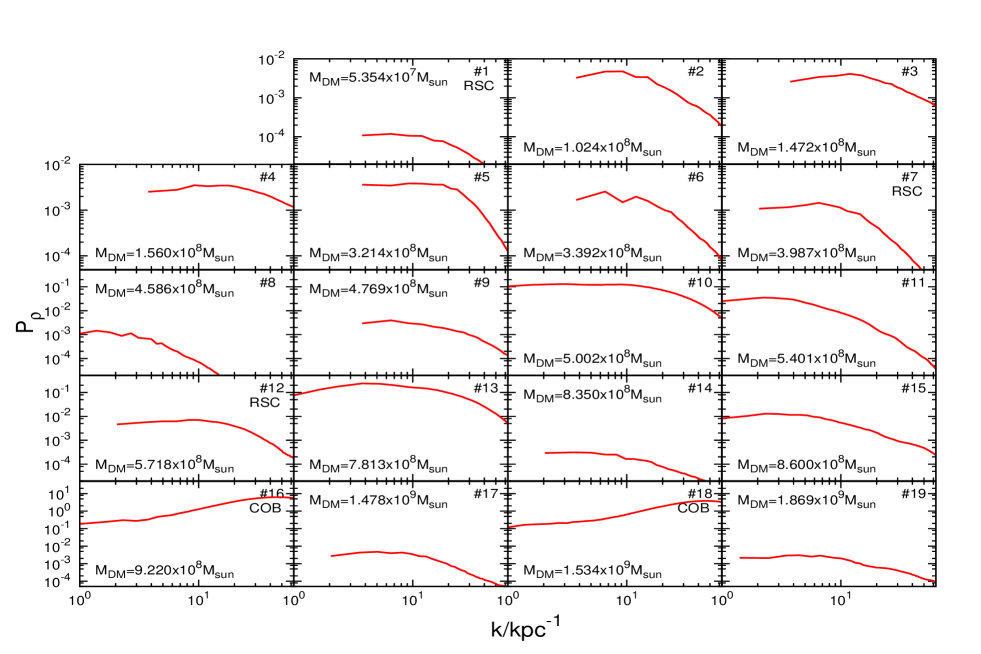
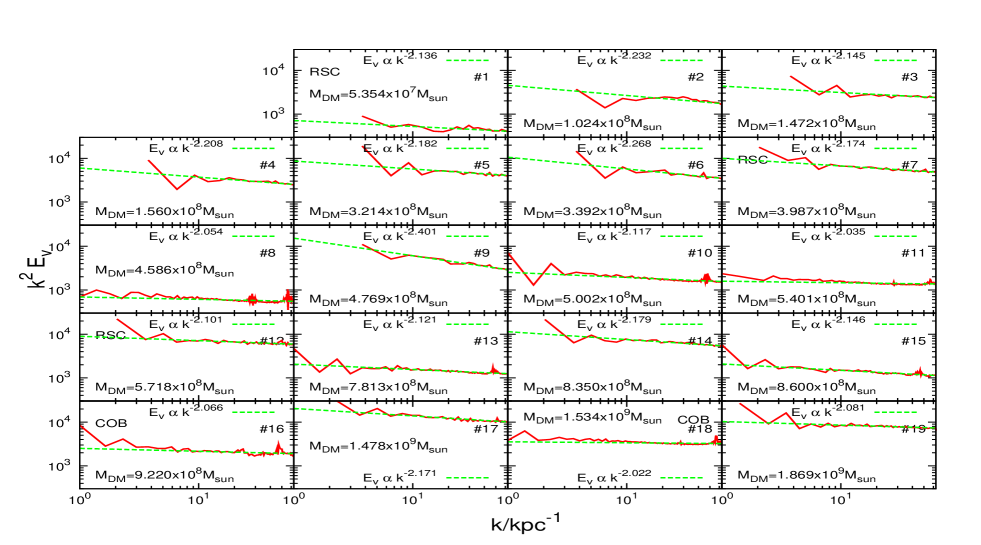
Figure 13 shows the density power spectra for the gas in the range of wave numbers corresponding to proper scales kpc kpc. Saichev & Woyczynski (1996) discussed two limits of the scaling relation for the density PS in the Burgers equation: and . The case corresponds to the limit of negligible pressure in which the fluid is dominated by strong shocks while arises in the presence of fluid pressure, i.e. a weakly shocked fluid. The gas density power spectra in our simulations do not show a well-defined single power-law, such as found in Gazol & Kim (2010). The PS is flatter on large scales, above kpc, whereas for most haloes, the power decreases steeply with on smaller scales. The power-law slopes on large (small) scales are close to (). Kim & Ryu (2005) have shown that the slope of flattens as the Mach number increases. Following Gazol & Kim (2010), our power spectra can be interpreted as evidence for a turbulent cascade from highly supersonic turbulence (with large ) on the virial (shock) scales of kpc, to low- turbulence on small scales (higher ).
Probably the most significant feature in these power spectra is that for two of the most massive haloes, the PS increases at large . These behavior is characteristic of systems with self-gravity as shown by Collins et al. (2012), where the densest regions have enough mass to collapse gravitationally and form gas clumps increasing the power on small scales. As mentioned by Collins et al. (2012), this feature in the density PS is indicative of a highly lumpy environment. In our case, this occurs for the two haloes which developed over-dense blobs, and clearly distinguishes these two haloes from the others. It is worth noting that the excess power is not simply caused by the presence of these blobs: the wave numbers with excess power cover a range from pc to pc, and show no sign of convergence on small scales. This means there is excess power all the way down to our resolution scale of pc, smaller than the size pc of the individual over-dense blobs, as well as on scales much larger than blobs. Our interpretation is therefore that the over-dense blobs are a result of a highly lumpy and turbulent environment. Below, we will hypothesize that this is a result of these haloes biased location (at the knots of the cosmic web) and their merging and cooling history (these haloes are among those with the largest number of mergers, and could cool their gas early on ).
Figure 14 shows the gas velocity power spectra (compensated by ). This plot is useful in order to differentiate between a Kolmogorov (, or ) and a Burgers (, or ) power spectrum. Interestingly, Figure 14 shows a flat PS for all 19 haloes, with an average power-law exponent of . In other words, the gas component for these 19 ACHs is closer to the Burgers PS (consistent with earlier findings in Prieto et al. (2011, 2012)). Figure 15 shows the solenoidal to total (solenoidal plus compressional) kinetic energy ratio. In an ideal fully developed turbulent fluid, this quantity should take the value , showing the equal distribution of energy in two solenoidal, divergence-free , modes and a single compressional, curl-free , mode. Figure 15 shows that the distribution of energy typically exceeds the equipartition value of ; . This implies that turbulence has not had time to settle into a steady pattern.

3.5.2 Probability distribution functions of the IHM
We next examine the probability distribution functions (PDFs) of the gas density, temperature, and velocity. Throughout this discussion, the PDF is volume-weighted (i.e. gives the probability to find a fluid element with a given physical quantity between and ).
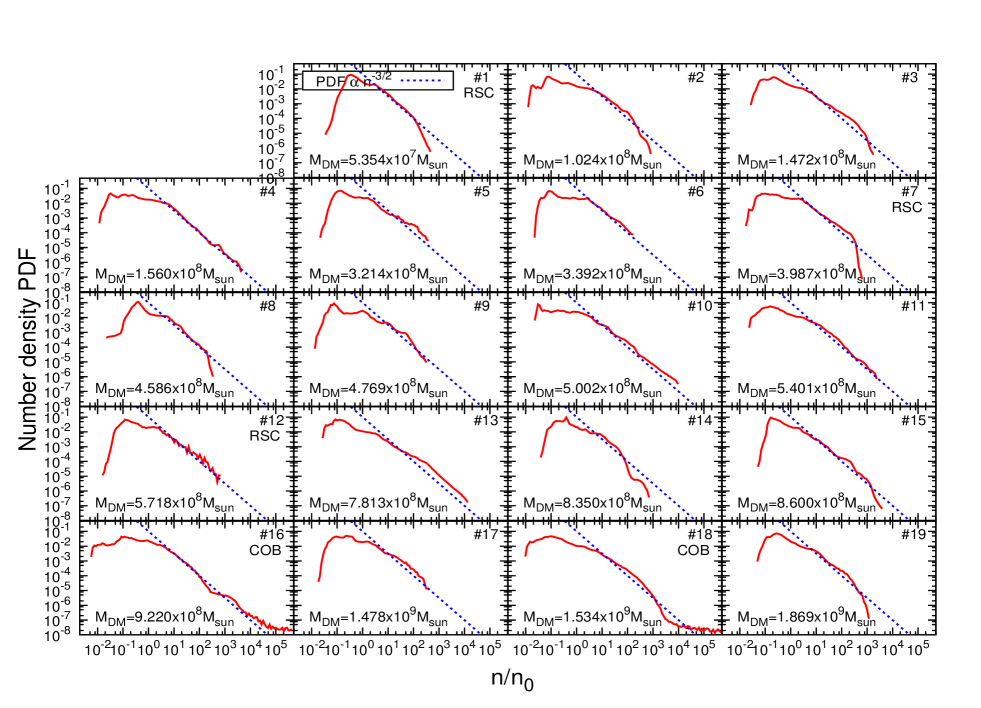
Figure 16 shows the PDF of the normalized number density , where is the mean number density inside the volume analysed (i.e. inside 2). Each of the 19 haloes shows a distinct peak at . Similar peaks can be seen in Figure 9 of Prieto et al. (2012); in that paper, the peaks show a clear evolution with time, and become more pronounced at lower redshifts. As in Prieto et al. (2012), the peaks shown in Figure 16 result from the gas collapsing to the central regions of the DM halo. Through this process, the gas piles up in a very small percentage of the volume, while the low density regions fill the rest of the volume. At densities above , the PDF develops a nearly power-law shape (the dashed lines in Fig. 16 show a power-law PDF for reference). This is explained by Kritsuk et al. (2011) as a feature from the first stages of a nearby isothermal gravitational collapse.
Two of our 19 haloes developed high-density tails, extending above . These two haloes are the ones that exhibit large density fluctuations at small scales (Figure 13), and develop the compact over-dense blobs (COBs). Such high-density tails result from self gravity acting on the gas, and have been seen in different contexts in simulations that include self-gravity, such as isothermal supersonic turbulence (e.g Kritsuk et al. 2011), isothermal MHD turbulence (e.g. Collins et al. 2012) and in a cosmological simulations of primordial gas collapsing in a lower-mass M⊙ DM halo (Prieto et al., 2012). An interesting feature of these two haloes is that they have the broadest number density PDFs. This signature is consistent with these two being the most shocked and turbulent haloes of the sample.
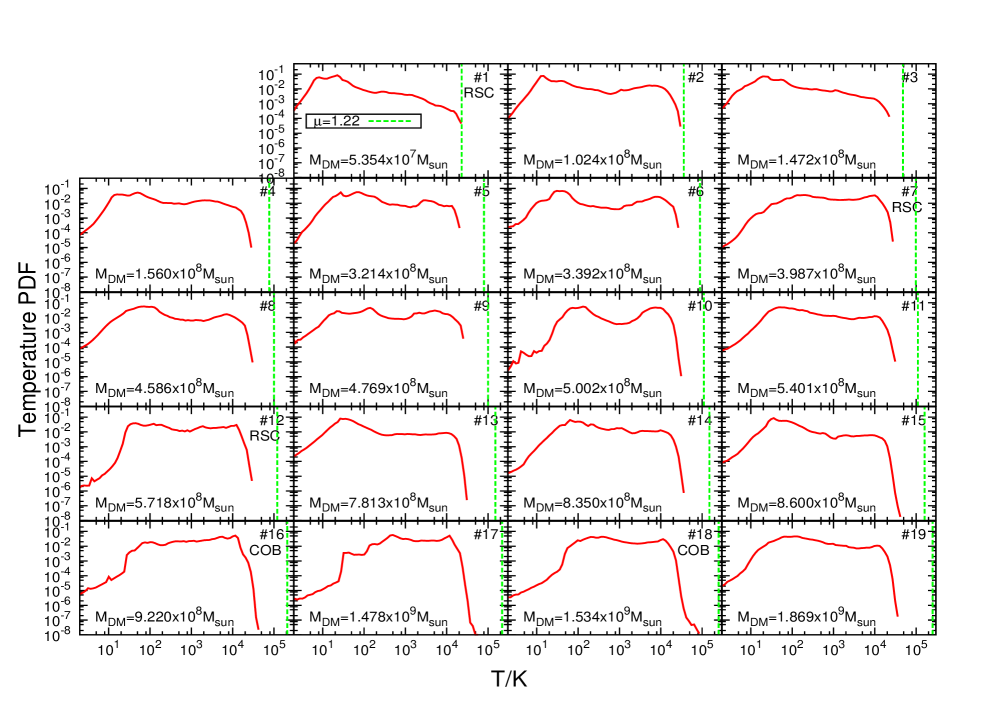
Figure 17 shows the gas temperature PDFs for each of the 19 haloes. The vertical dashed lines correspond to the virial temperatures computed assuming a mean molecular weight (appropriate for our nearly neutral H+He gas). The shape of the temperature PDF can be understood as a mixture of cold and hot gas interacting through the collapse process. All PDFs show a sharp cut-off above K as a consequence of atomic cooling, and (except for the two smallest haloes #1 and #2) the PDFs do not extend to temperatures as high as . The PDFs all show cold tails, corresponding to uncompressed gas from the IGM. The PDFs for haloes #16 and #18 extend close to K; as mentioned above, this is due to the activation of a numerical temperature floor in the COBs in these haloes.
Figure 18 shows the PDF of the gas velocity modulus, defined as
| (19) |
where is the center of mass velocity of the gas in each Cartesian direction. For reference, the short-dashed curves show Maxwell-Boltzmann distributions assuming a gas temperature . The velocity PDF resembles features of a Maxwell distribution: for most of the haloes it has a power-law tail at low velocities that is well approximated by the slope PDF, shows a knee at , and has an exponential cutoff at higher velocities. For reference, the long-dashed vertical lines correspond to the halo circular velocity . Interestingly, the peak of the velocity PDFs are at high velocities, only slightly below (and in some cases coincident with) . This is in contrast with the temperature PDF, which shows that the gas cools well below the virial temperature. This indicates that a large fraction of the gas falls into the haloes supersonically, at speeds near the halo circular velocity. Typical Mach numbers of the gas can thus be roughly estimated simply as the ratio of the halo circular velocity and the gas sound speed . Using the spherical collapse model to compute for an ACH of mass and redshift , and adopting K), we have
| (20) |
showing that our haloes should be able to develop a turbulent environment with Mach numbers , and with more massive haloes having higher Mach numbers. We computed the Mach numbers inside the virial radius for our haloes, and for the most interesting cases, i.e. the RSCs and the COBs haloes, we found a Mach number and , respectively.
3.5.3 Three-dimensional morphologies
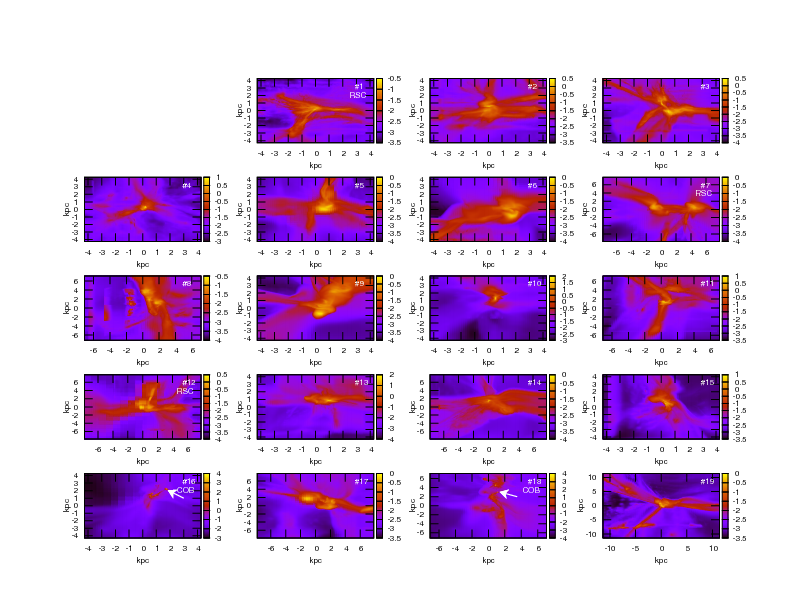
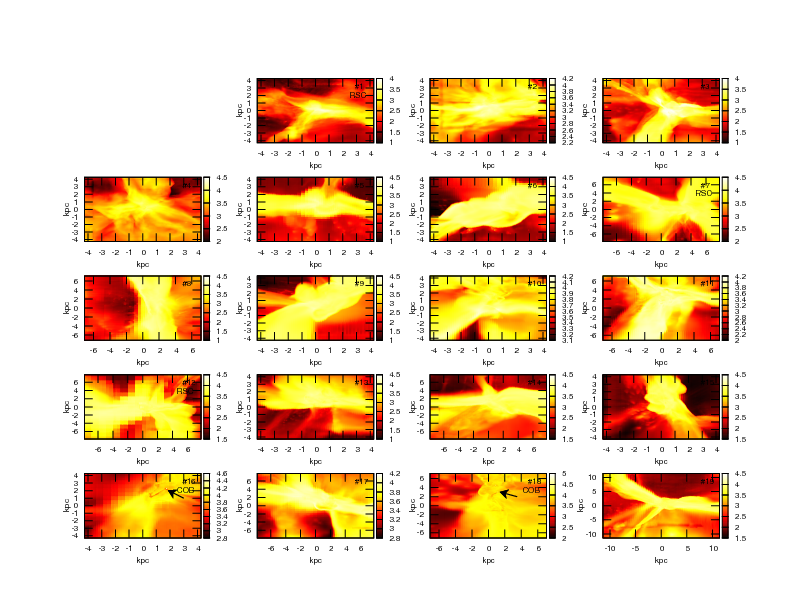
Figures 19 and 20 show logarithmic projections of the mass–weighted gas density and temperature, respectively, for each halo.111The fourth column in the second row shows two haloes, the halo we analyzed (#7) is the one close to the center of the image. There are significant variations in the details of the morphologies of our haloes, but all of them are characterized by a central overdensity, fed through gas filaments, tracing the underlying DM structure.
The filamentary accretion produces a shocked and turbulent environment. As mentioned above, the spherical collapse model predicts that our haloes have Mach numbers and a direct computation inside the virial radius gives a Mach number range of allowing the development of supersonic turbulence. One role of the gas filaments in this context is to feed the chaotic turbulent environment at the central regions of the haloes. As shown in Figure 20 (and supported by the average radial profiles in Figure 9) due to the atomic cooling, the overall gas collapse, and the accretion through the filaments, both proceed supersonically. As mentioned in previous sections, two of the most massive haloes develop M⊙ COBs, which can be seen as high density peaks in the bottom row in Figure 19 ( and ). These two haloes present a merger history characterized by almost continuous episodes of minor mergers as can be seen from Table 2. The multitude of mergers likely helped to create and maintain a lumpy, turbulent environment.

3.5.4 Turbulence
The gas in the ACHs have Mach numbers and they are thus susceptible to developing shocks and turbulence (see also Scannapieco & Brüggen (2010) for studies of turbulence in galaxy formation). Our results indeed indicate the presence of supersonic turbulence. There are two mechanisms that could naturally drive and maintain this turbulence: (i)the filamentary accretion of gas in relatively narrow, collimated streams – the infall speed in these streams is supersonic, and such streams can collide and create large Mach-number shocks, and stir the gas near the core of the halo. (ii) mergers with other DM haloes – mergers can likewise create violent shock waves, and stir the gas.
To elucidate the role of these processes, we first examine the polar patterns of mass accretion rate in our haloes. In Figure 21, we show the mass infall rate at each point on the sphere of radius , placed around the center-of-mass of each halo. These polar plots show the mass flux (in units of ). Note that negative values correspond to inward mass flux (i.e. accretion), and positive values correspond to outward-directed flows.
This figure shows sharp peaks, indicating that most of the gas inflow into the haloes occurs along relatively narrow accretion streams. We have confirmed that this is true quantitatively, i.e. most of the mass inflow occurs in a solid angle . Some haloes (e.g. #5) have multiple streams, and some (e.g. #10) have strong collimated outflows as well. Most importantly, this figure shows that the two haloes in which COBs develop (#16 and #18) have the highest mass fluxes by far. Additionally, the streams feeding gas into these haloes are the most narrowly collimated (occupying the smallest solid angle). By comparison, the haloes having rotationally supported cores present the lowest mass inflows, and the inflow occurs spread out over a much larger solid angle (roughly confined, however, to lie within the same plane).
The difference in mass flux among these two populations is a factor of . These results suggest a causal connection between the strength of the filamentary accretion and the nature of the object formed at the center of the halo. Namely, that stronger streams lead to stronger shocks and a more turbulent environment, which can produce COBs. By contrast, the less collimated, and weaker accretion proceeds in a more orderly fashion, which allows the specific angular momentum of the gas to be conserved, and a rotationally supported core (RSC) to develop.
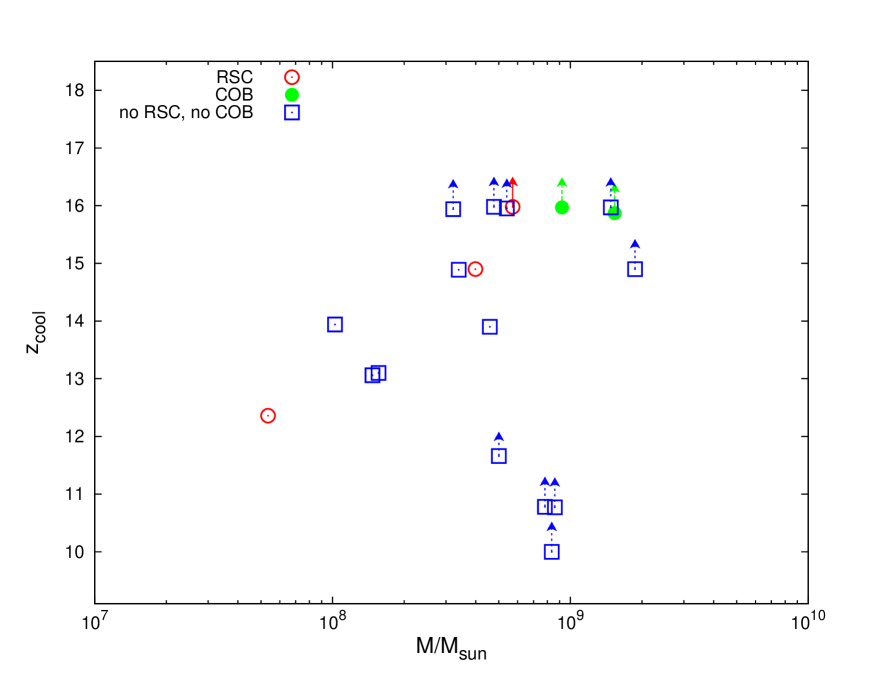
Next, we examine the merger histories of the haloes. In Table 2, for each halo, we list the total number of mergers it has experienced, the number of minor and major mergers (defined as having mass ratios below and above , respectively), the redshift and mass ratio of each merger, and the first (highest) redshift at which the gas in the halo could cool. For our available hydro outputs, was computed as the z when the gas temperature inside reaches the K. Because we do not have all the hydro outputs at high for every simulation, for the cases in the last column of Table 2 we used the DM-only simulations to get this redshift. In this case was computed as the when the halo reaches the mass .
This table shows that the haloes with the COBs are among those with the highest number of mergers. This is mostly due to their being among the most massive haloes. However, note that haloes #17 and #19 have comparable masses, but experience fewer (i.e. two and zero) mergers, and these halo do not develop COBs. This suggests that mergers are responsible for creating the high mass inflow rates, and causing a highly turbulent and lumpy environment that leads to strong shocks, and the formation and spatial displacement of the COBs. Note that the COB haloes have not only suffered more mergers, but their gas has also cooled earlier (see also Fig. 23 below). This can explain why in these haloes the gas is more lumpy (as seen in their density PDFs in Fig. 16) and can transfer its angular momentum and fall in rapidly. Catastrophic transfer of angular momentum and rapid gas infall of highly clumped gas to small radii is well known to be associated with early cooling in the low-redshift galaxy formation literature (e.g. Weil et al. 1998 and references therein).
The same effect can explain the rapid inflow rates we find in our two COB-forming haloes. By comparison, in haloes that undergo fewer or no mergers, the accretion rate remains much lower, spread out over a larger solid angle, and more coherent. In this case, a large fraction of the specific angular momentum can be conserved, leading to rotationally supported cores.
| Halo | Halo mass | #Total | #Minor | #Major | z1 | z2 | z3 | z4 | z5 | z6 | z7 | zcool |
|---|---|---|---|---|---|---|---|---|---|---|---|---|
| (number) | M⊙ | mergers | mergers | mergers | (merger | |||||||
| ratio) | ||||||||||||
| 1 | 5.35 | - | - | - | - | - | - | - | - | - | - | 12.36 |
| 2 | 1.02 | - | - | - | - | - | - | - | - | - | - | 13.94 |
| 3 | 1.47 | 1 | 1 | 0 | 10.63 | - | - | - | - | - | - | 13.06 |
| (0.19) | ||||||||||||
| 4 | 1.56 | 5 | 5 | 0 | 10.60 | 11.24 | 11.85 | 12.39 | 13.26 | - | - | 13.10 |
| (0.08) | (0.07) | (0.08) | (0.14) | (0.12) | - | - | ||||||
| 5 | 3.21 | 5 | 5 | 0 | 10.67 | 11.20 | 12.52 | 13.35 | 14.07 | - | - | 15.94 |
| (0.02) | (0.06) | (0.07) | (0.05) | (0.10) | - | - | ||||||
| 6 | 3.39 | 7 | 7 | 0 | 10.45 | 11.03 | 11.57 | 12.35 | 13.10 | 13.77 | 14.86 | 14.89 |
| (0.02) | (0.07) | (0.02) | (0.05) | (0.07) | (0.05) | (0.08) | ||||||
| 9 | 4.78 | 6 | 5 | 1 | 10.43 | 10.98 | 11.58 | 12.28 | 12.95 | 13.78 | - | 15.98 |
| (0.02) | (0.02) | (0.07) | (0.04) | (0.22) | (0.52) | - | ||||||
| 10 | 5.00 | 5 | 5 | 0 | 10.68 | 11.25 | 11.74 | 12.55 | 13.37 | - | - | 17.58∗ |
| (0.01) | (0.04) | (0.09) | (0.09) | (0.11) | - | - | ||||||
| 12 | 5.72 | 2 | 2 | 0 | 11.55 | 12.28 | - | - | - | - | - | 15.98 |
| (0.04) | (0.05) | - | - | - | - | - | ||||||
| 13 | 7.81 | 5 | 5 | 0 | 10.59 | 11.21 | 11.75 | 12.56 | 14.04 | - | - | 17.42∗ |
| (0.05) | (0.07) | (0.02) | (0.02) | (0.09) | - | |||||||
| 14 | 8.35 | 1 | 0 | 1 | 12.30 | - | - | - | - | - | - | 14.71∗ |
| (0.75) | - | - | - | - | - | - | ||||||
| 15 | 8.60 | 6 | 6 | 0 | 10.61 | 11.19 | 11.88 | 12.58 | 13.24 | 14.04 | - | 17.12∗ |
| (0.08) | (0.10) | (0.04) | (0.10) | (0.03) | (0.05) | - | ||||||
| 16 | 9.22 | 6 | 6 | 0 | 10.68 | 11.26 | 11.89 | 12.49 | 13.28 | 14.08 | - | 15.97 |
| (0.03) | (0.10) | (0.09) | (0.07) | (0.06) | (0.06) | - | ||||||
| 17 | 1.48 | 2 | 2 | 0 | 10.50 | 11.04 | - | - | - | - | - | 15.97 |
| (0.04) | (0.11) | - | - | - | - | - | ||||||
| 18 | 1.53 | 5 | 5 | 0 | 10.42 | 10.99 | 11.65 | 12.25 | 12.96 | - | - | 15.87 |
| (0.10) | (0.11) | (0.06) | (0.08) | (0.04) | - | - | ||||||
| 19 | 1.87 | 0 | 0 | 0 | - | - | - | - | - | - | - | 14.90 |
| - | - | - | - | - | - | - |
4 Discussion
4.1 No disks in atomic cooling haloes
By definition, the ACHs have a virial temperature . These haloes lose part of the thermal energy generated through the gravitational collapse process by H (and He near ) emission line cooling, and reach a temperature floor of . This fact can be seen in the temperature profiles in Figure 9, which show a constant inside . The gas density profiles approximately follow a power–law , in-between the profiles expected from pressureless cosmological infall and infall of non-radiating gas through shocks (Gunn & Gott, 1972; Bertschinger, 1985).
One of the main motivation for this work was indeed to look for large (), rotationally supported gaseous disks inside the ACHs. This is expected in the simplest toy models (e.g.Mo et al. 1998; Oh & Haiman 2002), in which efficient cooling allows the gas to collapse preferentially in the direction parallel to its angular momentum vector, while acquiring increasing rotational support in the plane perpendicular to this direction – eventually settling to a rotationally supported disk. Interestingly, we find that collapse indeed occurs preferentially along specific directions, and the gas has a less spherical shape than the host DM haloes. haloes with masses above , present a flattened gas distribution, with . This is in agreement with the earlier results by Romano-Diaz et al. (2011). However, we find that the minor axis of the gas distribution is not aligned with its angular momentum vector - the offset is between 30-90 degrees. This invalidates the above simple picture.
Furthermore, we find that none of these flattened gas distributions are rotationally supported; their spin parameters are well below unity. Interestingly, in 3 of our haloes the gas in the core does reach , but these rotationally supported cores are found in the lowest-mass haloes, and are closer to spherical blobs than to geometrical disks. In summary, we have proposed the following requirements for the gas distribution to qualify as a conventional “disk”:
-
•
a low and a high ,
-
•
a high gas spin parameter and
-
•
an alignment (to within ) of the angular momentum vector of the gas with the minor axis of the associated ellipsoid.
We find no disks in our sample of 19 atomic cooling haloes that satisfy this set of intuitive criteria.
4.2 Lack of correlation between gas and DM spin
Another interesting result from our study is that the directions of the angular momentum vectors of the gas and DM components are significantly misaligned. The misalignment angle for most of the haloes; in fact, for a third of the haloes in our sample, we find , i.e. the gas and the DM components counter-rotate.
Following the simple scenario in which the baryonic matter acquires an average SAM , as assumed in Mo et al. (1998) and Oh & Haiman (2002), we should expect a negligible misalignment angle. Three of our haloes present alignment to within . As mentioned above, these haloes have a high spin parameter and a high , suggesting that they are in a more advanced state of collapse compared with the rest of the haloes. One reason for the high misalignment angles in most of the haloes could be that the gas in these haloes have not yet fully collapsed, and the DM and gas components have not had enough time to interact and reach a stable, aligned state. As mentioned above, Kimm et al. (2011) have recently studied the relative angular momenta of gas and DM in haloes at lower redshifts, and also found significant differences, due to the very different dynamics of the gas and the DM once they cross the central region of the halo. It has also been pointed out by Angles-Alcazar & Davé (in preparation).
4.3 Rotationally supported cores vs. compact over-dense blobs
Our simulations show evidence for the formation of RSCs and COBs. The haloes in which these two different gas configurations are found have very different physical features, in terms of turbulence, merger history and larger-scale environment. These difference can help us understand the reason for having such different primordial objects.
The radial profiles of the specific angular momenta and the spin parameters show that in the 3 haloes where the gas component reaches a rotational support at small radius, and a inside . On the other hand, the haloes forming COBs have low gas spin parameters, and much flatter spin parameter profiles, indicating that the gas could efficiently transport its angular momentum. As described above, the two types of haloes have very different merger histories: Table 2 shows that the COB haloes have suffered many more mergers than the RSC haloes and that they have cooled their gas earlier (Fig. 23). The early cooling and the multitude of mergers can explain the fact that the gas in the COB haloes have a much more clumpy distribution (Fig. 16), which may explain the efficient transfer of angular momentum, and the rapid and narrowly collimated gas inflows (Fig. 21) in these haloes - creating strong shocks and driving strong turbulence in the central regions, eventually forming the COBs.

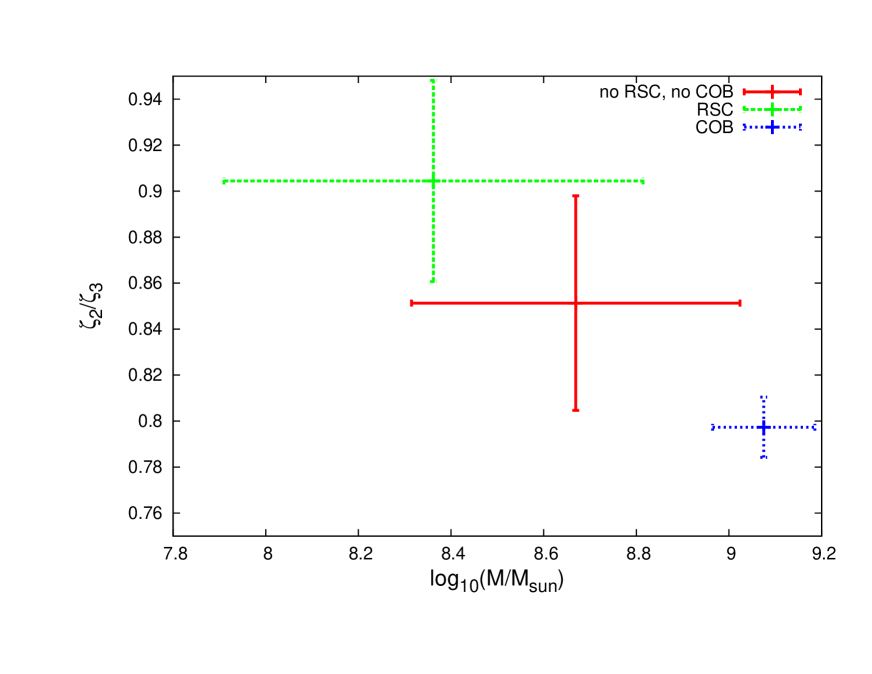
In order to distinguish haloes with a diagnostic that is explicitly related to turbulence, we have measured the velocity structure functions of the gas within the inner . The structure functions of order are defined as:
| (21) |
where the velocity component is parallel (longitudinal structure function) or perpendicular (transversal structure function) to the vector , , and the spatial average is over all values of the position (for more details, see Padoan et al. (2004)). The ratio of the power-law exponents of the longitudinal structure function of and order, , has been shown to depend on the strength of turbulence (Padoan et al., 2004). In particular, for highly developed supersonic turbulence, Padoan et al. (2004) finds the general scaling
| (22) |
which for yields a value of 0.74. We have computed this ratio for each of our 19 halos, and show the average values, with r.m.s. errors, for the three types of halos separately in Figure 22. Interestingly, the two types of halos with RSCs or COBs have significantly different ratios, versus , which can be attributed to the different turbulent conditions. The value for the COB-forming halos is close to the Boldyrev-type (i.e. highly supersonic, fully developed) turbulence. From Figure 2 in Padoan et al. (2004), we see that the higher value of for the halos with RSCs corresponds to less supersonic, and less well-developed turbulence (but still above the value for Kolmogorov subsonic turbulence). Perhaps most interesting is the clear correlation between the halo mass and structure function ratio, as can be seen in Fig. 22. Without further simulations and analysis, it is unclear what causes this correlation, but we speculate, consistent with our interpretations above, that it is due to the different merger histories, which in turn set the different turbulent conditions, which in turn create different types of objects. We will explore this hypothesis in more detail in a forthcoming publication.
As mentioned above, the mergers suffered by the progenitor halo is not the only possible source of turbulence. A second possible source is rapid gas accretion through filaments, following the underlying DM structures. These two mechanisms can, in principle, both simultaneously contribute to driving turbulence. In particular, we found that the gas accretion rate for the COB haloes is times higher than the one presented in the RSC haloes, suggesting that this second mechanism must play an important role.
Finally, it is interesting to ask whether the larger-scale environments of the haloes may affect their turbulent properties, and the type of object that forms the haloes. Figure 24 shows maps of the projected DM surface density around the location of one of the RSC (left panel) and COB (right panel) haloes. The differences are evident: while the RSC halo is located at a typical point in a filamentary region, the COB-forming halo resides at the center of a dense knot in the cosmic web. These DM density maps support the idea that the more numerous mergers and more rapid accretion flows found in the COB haloes are connected to its larger-scale cosmic environment.
5 Summary and Conclusions
In this study, we have presented the largest statistical cosmological hydro-simulation study of atomic-cooling haloes (ACHs). We studied the physical properties of 19 isolated haloes at , covering a total comoving volume of Mpc3. The simulations reach a spatial resolution of (proper) pc.
We presented a comprehensive analysis of the gas and DM physical properties, including baryonic mass fractions, gas and DM shapes, gas and DM spin parameters, as well as the radial profiles, power spectra, and probability distribution functions of various halo and gas properties. Our main goal was to study and understand the formation of any large galactic disks among ACHs, which may be stable and avoid fragmentation, suitable for forming SMBHs. In particular, our aim was to assess whether disk formation was common among these haloes.
Our main conclusions can be summarised as follows:
-
1.
None of our 19 haloes has formed a rotationally supported geometrical disk. While haloes with masses above have flattened geometrical shapes, they do not have significant rotational support. Conversely, we find three lower-mass haloes in which a rotationally supported core develops, but the shape of this core is closer to spherical than to a disk. Nevertheless, these cores are candidate sites for SMBH formation.
-
2.
The gas spin parameter is higher than the DM spin parameter for some of our haloes above M⊙. This result is in superficial agreement with the simple picture of galactic disk formation, in which specific angular momentum is conserved, and the gas spin parameter increases, as the gas collapses inside the DM halo. However, we find that the magnitude of the gas and DM spins have little correlation, and their directions are also significantly misaligned. This indicates that the gas angular momentum does not follow the above simple picture.
-
3.
Two of our most massive haloes developed very massive compact over-dense blobs, with masses of few. The COBs form near the center of the haloes by strong shocks at the intersection of converging filamentary flows. However, unexpectedly, the blobs have large residual velocities, and they migrate to the haloes’ outskirts. The blobs are self-gravitating, and accrete rapidly (M⊙yr-1, measured at a distance of pc from their center). These COBs show no sign of fragmentation at our resolution, and are alternative candidate sites for SMBH formation by direct collapse.
-
4.
The intra-halo medium is turbulent and supersonic (with Mach numbers ). To demonstrate this we have computed structure functions and showed that for all haloes they are all consistent with structure functions above the Kolmogorov regime.
-
5.
The COB formation is associated with a highly turbulent, supersonic (Mach numbers ) and lumpy environment due to a high mass accretion rate and an active merger history. This is likely related to their location at dense knots of the cosmic web. On the other hand, the rotationally supported cores are associated with haloes that are less turbulent, undergo mergers much less frequently, and have a lower gas accretion rate. They are located midway along filaments in the cosmic web.
We conclude that the angular momentum transport and the fate of gas in ACHs is intimately related to the turbulent conditions, which in turn is determined by the merging history and larger-scale environment of the halo. We hypothesize that haloes in highly biased regions have more numerous and earlier mergers, more lumpy and turbulent gas distributions, and more efficient transfer of angular momentum. The gas in such haloes can be accreted rapidly, along narrow streams, into a very dense central object, whose formation involves strong shocks. On the other hand, haloes in less biased regions have fewer mergers, and a less turbulent intra-halo medium, where gas inflow is more coherent and weaker overall. In such haloes, a larger fraction of the angular momentum can be preserved, and thus eventually a rotationally supported configuration can be reached.
Our results are based on simplified simulations. Since we assume the gas has primordial composition and -cooling and prior star-formation in the haloes have been suppressed, our simulations can be regarded as numerical experiments. They may nevertheless be an accurate description of a small subset of atomic cooling haloes, exposed to strong enough Lyman-Werner radiation to prevent prior star-formation. If verified in a larger sample of haloes and with additional gas physics to account for metals, star-formation and feedback, our results will have implications for observations of the highest-redshift galaxies and quasars with JWST.
Acknowledgments
We thank Greg Bryan, Ryan Joung and Matt Turk for useful discussions. ZH acknowledges support from NASA grant NNX11AE05G.
References
- Abel et al. (2000) Abel T., Bryan G. L. & Norman M. L., 2000, ApJ, 540, 39
- Begelman et al. (2006) Begelman, M., Volonteri, M., & Rees, M. J. 2006, MNRAS, 370, 289
- Bertschinger (1985) Bertschinger E., 1985, ApJS, 58, 39
- Bromm & Loeb (2003) Bromm V., & Loeb A. 2003, ApJ, 596, 34
- Bromm & Yoshida (2011) Bromm V. & Yoshida N. 2011, ARA&A, 49, 373
- Bryan & Norman (1998) Bryan G. L., & Norman M. L., 1998, ApJ, 552, L1
- Bullock et al. (2001a) Bullock J. S., Kolatt T. S., Kravtsov A. V., Klypin A. A., Porciani C. & Primack J. R., 2001a, ApJ, 555, 240
- Collins et al. (2012) Collins D., Kritsuk A. G., Padoan P., Hui L. & Xu H., 2012, ApJ, 750, 13
- Davis & Natarajan (2009) Davis A. J. & Natarajan P., 2009, MNRAS, 393, 1498
- Doroshkevich (1970) Doroshkevich A. G., 1970, Afz, 6, 581
- Eisenstein & Hut (1998) Eisenstein D. J. & Hut P., 1998, ApJ, 498, 137
- Ettori et al. (2006) Ettori S., Dolag K., Borgani S. & Murante G., 2006, MNRAS, 365,1021
- Ferrara (2010) Ferrara A., 2010, AIPC, 1294, 148
- Galli & Palla (1998) Galli D. & Palla F., 1998, A&A, 335, 403
- Gazol & Kim (2010) Gazol A. & Kim J., 2010, ApJ, 723, 482
- Gottlber & Yepes (2007) Gottlber S. & Yepes G., 2007, ApJ, 664, 117G
- Greif et al. (2008) Greif T. H., Johnson, Jarrett L., Klessen R. S. & Bromm, V., 2008, MNRAS, 387, 1021
- Gunn & Gott (1972) Gunn J. E., Gott J. R., III, 1972, ApJ, 176, 1
- Haiman (2012) Haiman, Z., 2012, arXiv e-print 1203.6075
- Harford et al. (2008) Harford A. G., Hamilton A. J. S. & Gnedin N. Y., 2008, MNRAS, 389, 880
- Heavens & Peacock (1988) Heavens A., Peacock J., 1988, MNRAS, 232, 339
- Hobbs et al. (2012) Hobbs A., Power C., Nayakshin S. & King A. R., 2012, MNRAS, 421, 3443
- Kim & Ryu (2005) Kim J. & Ryu D., 2005, ApJ, 630L, 45K
- Kimm et al. (2011) Kimm T., Devriendt J., Slyz A., Pichon C., Kassin S. A. & Dubois Y. 2011, MNRAS, submitted, eprint arXiv:1106.0538
- Kolmogorov (1941) Kolmogorov A. N., 1941, Dokl. Akad. Nauk SSSR, 32, 16
- Komatsu et al. (2011) Komatsu E., et al. 2011, ApJS, 192, 18
- Koushiappas et al. (2004) Koushiappas S. M., Bullock J. S., & Dekel A. 2004, MNRAS, 354, 292
- Kravtsov et al. (2005) Kravtsov A., Nagai D. & Vikhlinin A. A., 2005, ApJ, 625, 588
- Kritsuk et al. (2007) Kritsuk, A. G., Norman, M. L., Padoan, P., & Wagner, R. 2007, ApJ, 665, 416
- Kritsuk et al. (2011) Kritsuk, A. G., Norman, M. L., & Wagner, R. 2011, ApJl, 727, L20
- Latif et al. (2011) Latif, M. A., Schleicher, D. R. G., Spaans, M., & Zaroubi, S. 2011, MNRAS, 413, 33
- Lodato & Natarajan (2006) Lodato G., & Natarajan P. 2006, MNRAS, 371, 1813
- Mo et al. (1998) Mo H. J., Mao S. & White S. D. M., 1998, MNRAS, 295, 319
- Navarro, Frenk & White (1997) Navarro J. F., Frenk C. S. & White S. D. M., 1997, ApJ, 490, 493
- Nordlund & Padoan (2003) Nordlund, Å., & Padoan, P. 2003, Turbulence and Magnetic Fields in Astrophysics, 614, 271
- Oh & Haiman (2002) Oh S. P. & Haiman Z., 2002, ApJ, 569, 558
- Omukai (2001) Omukai K. 2001, ApJ, 546, 635
- O’Shea & Norman (2007) O’Shea B. W. & Norman M. L. 2007, ApJ, 654, 66
- Padoan et al. (1997) Padoan P., Nordlund Å. & Jones B. J. T., 1997, MNRAS, 288, 145
- Padoan et al. (2004) Padoan P., Jimenez R., Nordlund Å., Boldyrev S., 2004, PhRvL, 92, 191102
- Pawlik et al. (2011) Pawlik A. H, Milosavljevic M. & Bromm V., 2011, ApJ, 731, 54
- Prieto, Infante, & Jimenez (2008) Prieto J. P., Infante L., Jimenez R., 2008, arXiv, arXiv:0809.2786
- Prieto et al. (2011) Prieto J., Padoan P., Jimenez R., Infante L., 2011, ApJ, 731, L38
- Prieto et al. (2012) Prieto J., Jimenez R. & Martí J., 2012, MNRAS, 419, 3092P
- Prunet et al. (2008) Prunet S., Pichon C., Aubert D., Pogosyan D., Teyssier R. & Gottloeber S., 2008, ApJs, 178, 179
- Regan & Haehnelt (2009a) Regan J. A. & Haehnelt M. G., 2009a, MNRAS, 393, 858
- Regan & Haehnelt (2009b) Regan J. A. & Haehnelt M. G., 2009b, MNRAS, 396, 343
- Romano-Diaz et al. (2011) Romano-Diaz E., Choi J., Shlosman I., & Trenti M., 2011, ApJ, 738L, 19R
- Saichev & Woyczynski (1996) Saichev A. I. & Woyczynski W., 1996, SIAM J. Appl. Math., 56, 1008
- Scannapieco & Brüggen (2010) Scannapieco E., Brüggen M., 2010, MNRAS, 405, 1634
- Shang et al. (2010) Shang C., Bryan G. L. & Haiman Z., 2010, MNRAS, 402, 1249
- Sharma & Steinmetz et al. (2005) Sharma S. & Steinmetz M., 2005, ApJ, 628, 21
- Spaans & Silk (2006) Spaans, M., & Silk, J. 2006, ApJ, 652, 902
- Stringer & Benson (2007) Stringer M. J. & Benson A. J., 2007, MNRAS, 382, 641
- Teyssier (2002) Teyssier R., 2002, A&A, 385, 337
- Truelove et al. (1997) Truelove J. K., Klein R. I., McKee Ch. F., Holliman J. H., Howell L. H. & Greenough J. A., 1997, ApJl, 489, 179
- Turk et al. (2012) Turk M., Oishi J. S., Abel T. & Bryan G. L., 2012, ApJ, 745, 154
- Vera-Ciro et al. (2011) Vera-Ciro, C. A., Sales, L. V., Helmi, A., Frenk, C. S., Navarro, J. F., Springel, V., Vogelsberger, M., White, S. D. M., 2011, MNRAS, 416, 1377V
- Vitvitska et al. (2002) Vitvitska M., Klypin A. A., Kravtsov A. V. & Wechsler R. H., 2002, ApJ, 581, 799
- Volonteri & Rees (2005) Volonteri M., & Rees M. J. 2005, ApJ, 633, 624
- Weil et al. (1998) Weil M. L., Eke V. R., & Efstathiou, G. 1998, MNRAS, 300, 773
- White (1984) White S., 1984, ApJ, 286, 38
- Wise & Abel (2007) Wise J. & Abel T., 2007, ApJ, 665, 899
- Wise et al. (2008) Wise J. H, Turk M. J., & Abel T. 2008, ApJ, 682, 745
- Wise et al. (2012) Wise J. H., Turk M. J., Norman M. L., & Abel T. 2012, ApJ, 745, 50
- Yoshida et al. (2006) Yoshida N., Omukai K., Hernquist L., & Abel T., 2006, ApJ, 652, 6