Theoretical investigation of FeTe magnetic ordering under hydrostatic pressure
Abstract
We investigate the pressure phase diagram of FeTe, predicting structural and magnetic properties in the normal state at zero temperature within density functional theory (DFT). We carefully examined several possible different crystal structures over a pressure range up to GPa: simple tetragonal (PbO type), simple monoclinic, orthorhombic (MnP type), hexagonal (NiAs and wurzite type) and cubic (CsCl and NaCl type). We predict pressure to drive the system through different magnetic ordering (notably also some ferromagnetic phases) eventually suppressing magnetism at around 17GPa. We speculate the ferromagnetic order to be the reason for the absence of a superconducting phase in FeTe at variance with the case of FeSe.
I introduction
In the chalcogenide family of iron-based superconductorsreview-takano (FeTe1-xSex, with ) the most studied are (FeSe) and alloys near the optimal doping (FeTe0.5Se0.5). The latter has till now the highest superconducting critical temperature KTropeano2010 among the chalcogenides at zero pressure, while the first shows a which depends strongly on external pressure: increases from 8K at ambient pressure up to 37K at 9 GPa. Margadonna2009 ; Medvedev2009 On the other hand, FeTe () is a noticeable example of non-superconducting parent compounds, in spite of having peculiar magnetic properties with potentially better superconducting properties than FeSeZhang2009 .
However, pure FeTe is always synthesized in the non stoichiometric form Fe1+yTe.Zhang09 ; Marina10 At higher concentrations it is also found that the excess Fe plays a role in determining the magnetic properties.Zhang2009 ; Stock2011
The ground state of FeTe is experimentally found as double stripe antiferromagnetically ordered phase (AFMs2)Bao2009 and theoretically confirmed.Ma2009 ; Moon2010 ; Profeta2012 The AFMs2 ordering consists into an AFM alternation of pairs of ferromagnetically ordered stripes of Fe-atoms, and can be seen as a spin-density wave (SDW) with a wave vector half of that corresponding to the usual stripe AFM ordering found in pnictides. This magnetic phase survives at low temperature with no sign of superconducting phase transition. This finding stimulated the search of a possible superconducting phase of FeTe, in particular, looking for a way to destroy the antiferromagnetic phase thus enhancing the spin-fluctuations.
For this purpose, hydrostatic pressure (P) has been largely used to induce superconductivity in non-superconducting materials at ambient pressure. In Fe-based superconducting compounds (both pnictides and chalcogenides), this technique had many successes Zhang09 ; Okada2009 ; Giannini2010 ; Duncan ; Kreyssig2008 ; Kimber ; Mittal ; Uhoya ; Colombier ; Torikachvili2008 ; Yamazaki ; Goldman ; Pratt ; Mani , guiding the discovery of new superconducting materials.
Regarding FeTe, transport measurementsOkada2009 show that pure FeTe is not a superconductor even under high pressure ( up to GPa). The same paper shows the presence of several phase transitions on FeTe by varying temperature and pressure (see Fig. 5).
Zhang et al.Zhang09 observe a sudden decrease of the isothermal compressibility for GPa. They observe that for GPa the axis decreases with increasing pressure much less than for GPa. The axis, on the other hand, decreases with the same slope with increasing pressure in the whole investigated range ( up to 10 GPa). This sudden kink in the slope of the axis versus curve was supposed to be related to some phase transitions (possibly of magnetic origin) and was observed to be second order (without any discontinuity in the unit cell volume as a function of pressure).
Another paperGiannini2010 reports isothermal compressibility data for less than 10GPa: it is quite smooth and does not show any derivative discontinuity.
However, these experimental evidences are at variance with what observed in the case of 122 compounds (Ca(Ba)Fe2As2 for example), in which a first order phase transition is observedTorikachvili2008 with volume contraction, well predicted by first principle calculations.Yildirim2009 ; Ji2011 ; Colonna2011 In the 122 type compounds a symmetry preserving phase transition, driven by hybridization of the pz As orbitals, produces a sudden shortening of the -axis and a sudden transition to a compressed phase (with a discontinuity in the volume versus pressure curve).Colonna2011 In FeTe, on the other hand, the crystal structure does not allow direct Te-Te bonds along -direction, thus this same phase transition is not expected at all.
Recently, by means of muon spin rotation, dc magnetization, and neutron depolarization measurementsBendele2012 new magnetic phases were reported (never reported for 1111 and 122 class of superconductors) and with synchrotron powder x-ray diffractionKoz2012 a plethora of structural phase transitions were observed within the 0-3 GPa pressure range in Fe1.08Te.
Within this scenario it is evident that the structural phase diagram of FeTe under pressure is not complete and the experimental evidences are not deeply explored and are still unclear, even from a theoretical point of view. In particular there are no informations on the possible structural phases under pressure, on new magnetic orderings and on the theoretical possibility to obtain an high-pressure non-magnetic phase.
In order to clarify the role of pressure in determining the interplay between structural and magnetic properties of FeTe, we performed extended first-principles simulations of the high-pressure phase diagram of FeTe within the Density Functional Theory (DFT) considering many different phases, both in their non-magnetic and magnetic configurations.
II computational method
Our calculations were performed within DFT framework using the Perdew-WangPerdew1992 version of generalized gradient approximation (GGA). The Projected Augmented Waves (PAW) pseudopotentialsBlochl were used for both Fe and Te atom as implemented in the VASP package.Kresse1 ; Kresse2 . Since usually Fe 3p semi-core electrons are treated as valence electrons in other Fe-based superconductorsMazin2008 and in order to ensure a proper transferability in the high pressure region (see below) we included them as valence electron too. Most of calculations were performed using a super cell with 8 Fe atoms and 8 Te atoms (see also below), in order to deal with the zero pressure equilibrium state magnetic ordering. We use a plane waves cutoff of 500eV. The k point mesh was a Monkhorst Pack grid for the tetragonal PbO structure ( unit cell, see below), in other cases a comparable mesh was chosen.
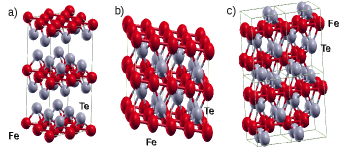
We consider several possible different crystal structures (see Fig.1): simple tetragonal (PbO type, space group), monoclinic, orthorombic (MnP type), hexagonal (NiAs and wurzite type) and cubic (CsCl and NaCl type). All structures were simulated with 8 Fe atoms unit cells. For tetragonal PbO cell we use a unit cell ( and referred to the 2Fe atoms unit cell). The tetragonal phase is unstable when an antiferromagnetic order is imposed and lowers the symmetry into an orthorhombic or monoclinic phase, slightly distorting the Fe in plane squares (AFM phase) or the angle between and (AFMs2 phase). The MnP type phase is an orthorhombic phase of the space group and can be viewed as a lower symmetry distortion of an hexagonal NiAs phase (space group ). The distortion of the NiAs phase to the MnP phase is customary in this family of compounds, as discussed for FeSe.Margadonna2009 ; Naghavi2011
We choose a set of volumes spanning the interval 40Å3/2Fe – 108Å3/2Fe and for each one we find the minimum energy configuration, at fixed volume, relaxing the internal atomic positions and cell parameters. In order to determine the transition pressures, we calculate the enthalpy as a function of the pressure. The pressure was calculated as the trace of the stress tensor (always isotropic). We also calculated the pressure from the analytic derivative of the curve obtained fitting the data with a Birch-Murnaghan equation of state. The two methods are in good agreement as far as the Birch-Murnaghan equation of state fits the calculated total enegies.
We investigate various magnetic orderings: non magnetic (NM), collinear antiferromagnetic stripe (AFMs), antiferromagnetic double stripe (AFMs2, also called bicollinear in the literature)Ma2009 ; Moon2010 , antiferromagnetic checkerboard (CB) and ferromagnetic (FM). Spin-polarized calculation were performed in the collinear approximation without including spin-orbit coupling.
III results and discussion
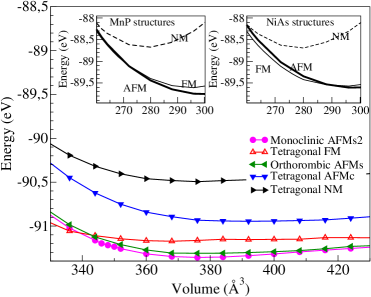
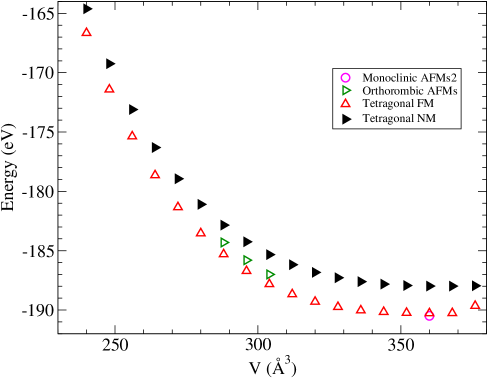
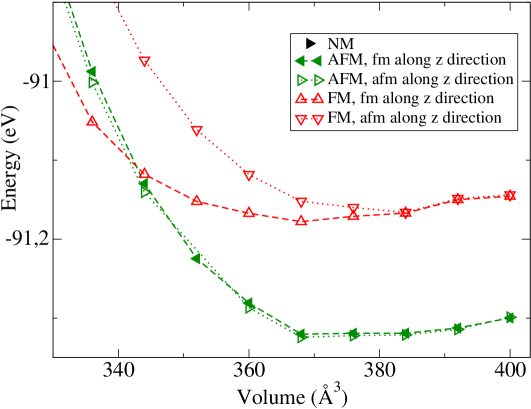
Fig. 2 shows the total energy as a function of unit cell volume for an 8 Fe atoms unit cell. The most stable structure at is the monoclinic crystal structure with an AFMs2 magnetic ordering. The distortion with respect to tetragonal symmetry is small and driven by the magnetic pattern, which brakes the equivalence of and axis. This can be rationalized in terms of a frustrated Heisenberg model.Ma2009
The and axis are no longer equivalent as in the tetragonal structure and the angle between and axis is no longer 90° but ranges from 88.35° and 88.2° for 2GPa, in a suitable agreement with what is found experimentally (89.17°) and in line with other theoretical calculations.Marina10 ; Profeta2012 The atoms internal coordinates vary (with respect to those in the tetragonal structure) in such a way that stripes with the same spin orientation become closer and stripes with opposite spin orientation become more distant.
The AFMs2 phase has an energy gain of less than 6 meV/Fe with respect to AFMs phase, which is the ground state of most of other Fe-based superconductors. This theoretical prediction agrees with both experimentsLi2009 and theoretical calculations.Ma2009 ; Moon2010 At the equilibrium volume is =94Å3/2Fe, in good agreement with experimental values reported in literature: 93.2Å3/2Fe at ambient temperatureZhang09 , 92.96Å3/2Fe at T45K Kuo-Wei , 90.78Å3/2Fe at T2KMarina10 . The slightly overestimation of the calculated volume with respect to low temperature measurements is usual in some material for GGA functional and in this case is mainly due to an overestimation of the out-of-plane () lattice constant.
With respect to the AFMs2 phase, the other tetragonal phases have energies higher by 6 meV/Fe (AFMs), 24 meV/Fe (FM), 53 meV/Fe (CB), and 108 meV/Fe (NM) at . These energy differences appear to be qualitatively in agreement with published theoretical resultsMa2009 ; Moon2010 , which in turn differ from each other on the same energy scale (see Tab. 1). Note that both papersMa2009 ; Moon2010 use different experimental lattice constants, while we optimized them.
At volumes near the equilibrium one, for Å3/8Fe (Å3/2Fe), the low energy phases are the tetragonal derived ones (slightly distorted depending on the magnetic order); at lower volumes (Å3/8Fe), on the opposite, the low energy phases become the NiAs derived ones (NiAs and MnP). All the other phases considered (CsCl, NaCl and wurzite) lie at higher energies at all considered volumes irrespective of their magnetic ordering (we do not show them in the figures for clarity, lower panel, Fig.2).
| Mag. phase | This work | Moon et al. | Ma et al. |
|---|---|---|---|
| AFMs2 | 0 | 0 | 0 |
| AFMs | 6 | 30 | 10 |
| FM | 24 | 70 | 76 |
| CB | 53 | 125 | 68 |
| NM | 108 | n.d. | 166 |
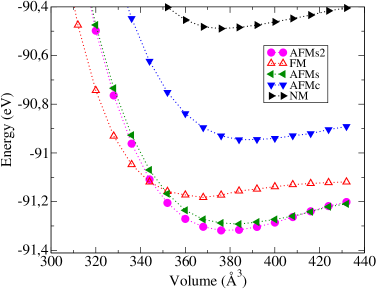
It is worth mentioning that even if low pressure distortions are sizable they do not determine the relative energy ordering of the different magnetic phases. The ground state is still AFMs2 and the first transition is still towards a ferromagnetic ordered phase even fixing the crystal structure in the tetragonal phase (see below). This is clear looking at Fig. 3, were we report the total energy of the different magnetic structures without (in the tetragonal phase) the magnetically-induced structural distortions.
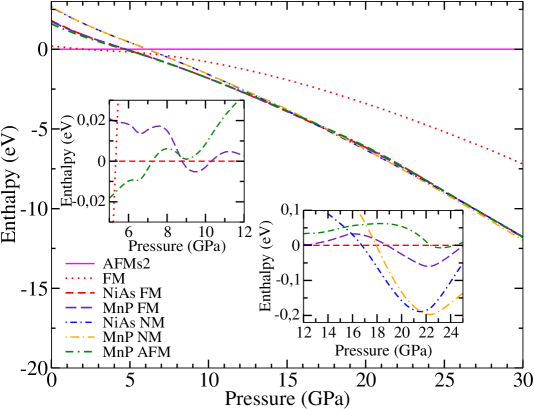
Having discussed the ground state geometry, at P=0, we pass to discuss high-pressure region of the phase diagram. Fig. 4 shows the enthalpy of FeTe over a wide range of pressures. It is evident how the system goes through several phase transitions going from lower to higher pressures. This is in line with what was recently observed with x-ray diffractionKoz2012 . Starting from the monoclinic AFMs2, a first transition leads to a tetragonal FM structure at 2.1 GPa. In this phase Fe layers are surprisingly ferromagnetically ordered. Around 5.3 GPa there is a further transition. Increasing we find many phases which compete with each other and with very similar enthalpies. Warning the reader that our predictive power on this scale may be limited by, e.g., the accuracy in the computed pressure, the sequence of phases encountered is: MnP AFM (at P= 5.3 GPa), NiAs FM (at P= 7.2 GPa), MnP FM (at P=8.8 GPa), NiAs FM (at P=10.0 GPa), NiAs NM (at P=17 GPa), MnP NM (at P=22 GPa). The system eventually becomes non-magnetic at 17 GPa. We point the experimental attention in this pressure range, in order to discover possible non-magnetic phases. However, the crystal symmetry and the magnetic alignment (FM) of the closer phase (ferromagnetic NiAs phase) does not favor a superconducting phase, at least assuming an antiferromagnetic spin-fluctuation mechanism.
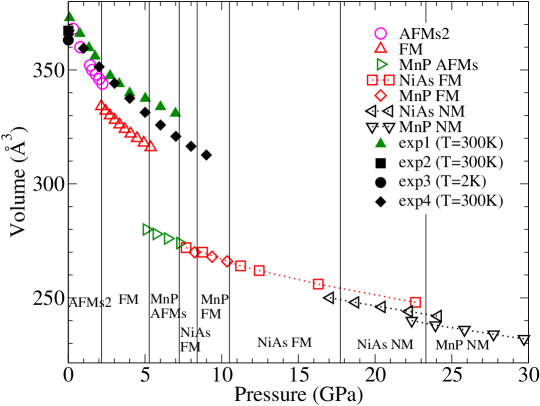
Fig. 5 shows the volume of an 8 Fe atoms cell as a function of pressure. The experimental equilibrium volume is well reproduced, while the bulk modulus is underestimated (i.e. the compressibility is overestimated) with respect to experiment. The fit with a order Birch-Murnaghan equation of state gives =13.1GPa, while experimentally a value of =31.3GPa at 300K was reportedZhang09 . The 2.1GPa transition to the FM tetragonal structure is of first order and is accompanied by a volume reduction of 2.5Å3/2Fe.
At 1.5 GPa, Okada et al.Okada2009, indicates the presence of a phase transition by means of magnetic and transport measurements taken at 4.2 K. It is argued that the monoclinic antiferromagnetic phase (low temperature and low pressure) is suppressed by increasing pressure in favor of another phase with a different magnetic state. According to our results this phase could be the FM tetragonal structure. This phase transition is very peculiar, given the apparent similarity of FeTe with other members of the iron-based pnictides compounds. However there are strong experimental indications. In fact, recently Bendele et al.Bendele2012 report on ferromagnetism induced by pressure in Fe1.03Te. They argue that at low temperature there is a transition from AFM to FM ordering, which confirms our predictions. Structural measurementsKoz2012 indicate that Fe1.08Te at low temperature and high pressure undergoes a structural transition from a monoclinic structure to a tetragonal structure at a pressure of about 1.5GPa. Even this structural phase transition is nicely predicted by our calculations which predicts a tetragonal FM phase at 2.1 GPa.
We point out that although a small amount of excess Fe in samples may have a role in driving the system properties, eventually producing an apparent agreement between experiments and calculations, our results seem to rule out also this possibility (see below for calculations on the Fe excess role).
Other experimentsZhang09 claim a second order transition at 3 GPa which brings the system in the so called “compressed tetragonal” phase, with the caveat that those data were taken at 300 K. Our results do not seem to support this conclusion (see later and discussion in the Introduction). For in the interval GPa Ref.Okada2009, does not show evidence of other phase transitions, apart from one at GPa, suggested on the basis of the electrical resistance versus temperature curves. These show a qualitatively different behavior at above and below GPa, but the authors declare that this could likely be due to a non hydrostatic stress.
Increasing the pressure a order transition from tetragonal FM towards another AFM phase (in the MnP structure) takes place at 5.3 GPa, with a sizable volume change. For going from 5.3GPa to 17GPa the system undergoes some transitions between MnP and NiAs magnetic phases (the MnP phase is a distorted NiAs phase). These phases are almost degenerate because in this pressure range the distortion that brings the NiAs to an MnP phase is very small. At 17GPa the magnetization goes definitely to zero and the system adopts a non magnetic NiAs structure, which distorts to a non-magnetic MnP structure at 22GPa. For higher pressures we do not find any other phase transitions, the MnP phase becomes more and more distorted with respect to NiAs one. The distortion is essentially characterized by a buckling of the Fe planes, which are no longer flat. This last buckling of the Fe plane has interesting effects even at zero pressure: in fact the AFMs2 magnetic phase is easily destroyed by the Fe buckling.
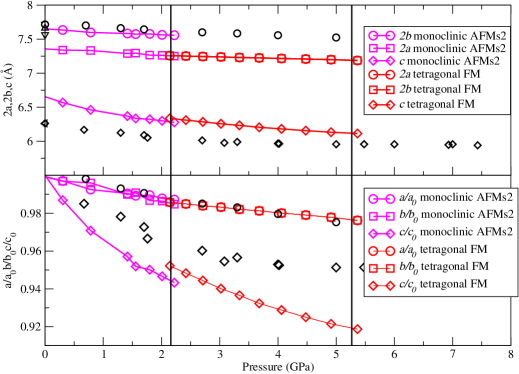
Fig. 6 shows low pressure cell parameters, both in absolute units and relative to those at 0GPa compared to experimental dataZhang09 ; notazhang (taken at 300K). At higher pressures there are no experimental data to compare with. It is clear how DFT-GGA overestimate the distortion in the plane (the ratio), the axis absolute value and the decrease of the axis with increasing pressure (bottom panel). On the opposite our calculations reproduce pretty well the axis absolute value and the reduction of the axis with increasing pressure.
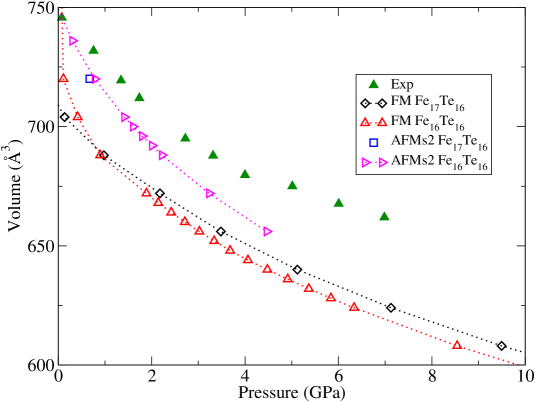
Although the qualitative agreement with experiments is good and reasonable, the quantitative comparison should be improved. The inaccuracy of DFT in descring pnictides, is a possible explanation, but presence of excess Fe, which is always present in real samples (and not taken into account in most of simulations) could be a possible source of error. In fact, Ref. Zhang09, and Ref. Marina10, both estimates a 5% concentration of excess Fe in FeTe. In order to clarify this point, always invoked to explain possible differences between theoretical predictions and experimental results, we performed representative calculations in a supercell with 17 Fe atoms and 16 Te atoms, which corresponds to Fe1,0625Te. The atoms where arranged in a cell, and the excess Fe occupies the so-called site, which is roughly coplanar with Te atoms. Fig.7 shows the total energy as a function of volume for representative magnetic orders. The excess Fe does not modify substantially the energy sequence. Although possible disorder effects can be present this result poses stringent limitations on the effect of Fe excess. At the same time, Fig.8 shows that the effect of excess Fe on structural properties is not crucial, being the compressibility with and without excess Fe nearly the same.
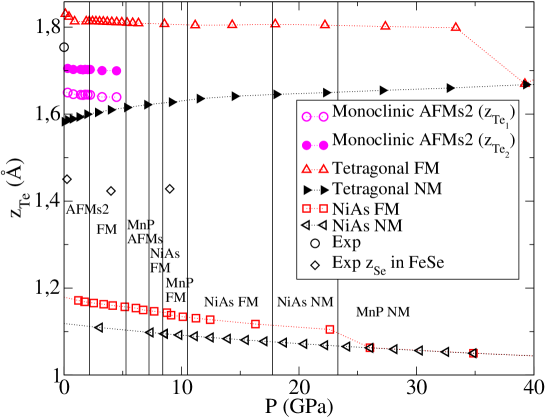
As discussed above there is a pressure range in which we obtain a ferromagnetic ordering along the Fe planes, in agreement with the available experimentsBendele2012 , a fact which was not observed in other pnictides based superconductors. However, the P based ones, LaCoPO is found to be ferromagnetic at ambient pressureJin2009 ; Profeta2013 , and therefore not a superconductor, similarly to the case of FeTe. The anion height above the Fe planes, is invoked as a possible parameter correlated with both the superconducting Tc and the magnetic phase.kuroki2009 ; Moon2010 ; Mizuguchi2010 Thus, in order to better clarify the origin of the high pressure ferromagnetic phase, we report in Fig.9 the Te height over Fe planes. It is in fact know that the Fe moment depends significantly from this quantity. In the AFMs2 phase we have two Te sites with two different heights. The corresponding calculated average is smaller than the experimental value by about 0.1 Å; in the FM phase, on the other hand, the theoretical value is larger by Å and, finally, in the NM phase is Å smaller than in experiment (which is a well known result). It is clear that in FeTe the anion height above Fe planes is bigger than the Se height in FeSe and the As height in LaFeAsO, which can be easily understood considering that the covalent radius of Te atom is bigger than Se and As. In agreement with Ref.Moon2010, , we find that high values of favors FM alignment, confirming that anion height determines the magnetic order.
The existence of ferromagnetic ordering is puzzling since it is not clear if it may be due to a deficiency of GGA functional to describe properly the binding within the solid (notably a higher that experiment) or this is a feature that distinguish this system from other compounds in the chalcogenide family.
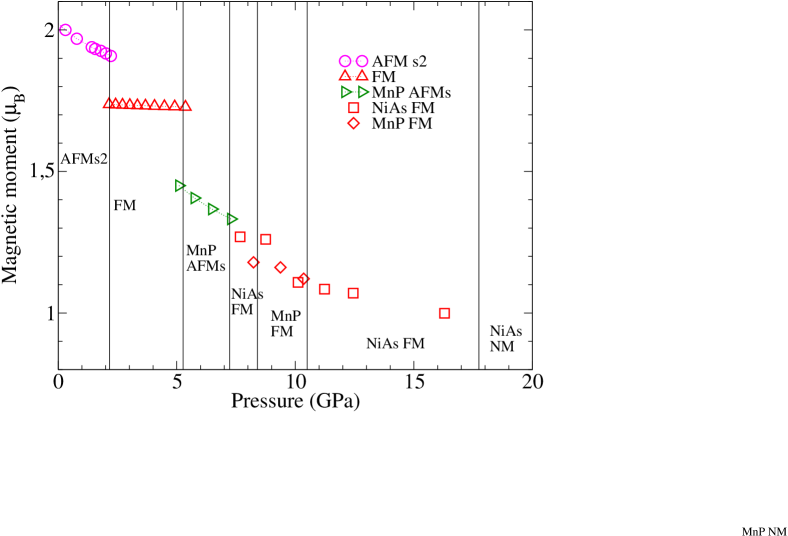
As expected, the magnetic moment at Fe site decreases monotonically with increasing pressure (Fig.11). At low pressure, in the AFMs2 phase, the calculated magnetic moment is , while experiments report typical values around Marina10 ,Li2009 . In the MnP/NiAs pressure range of stability is nearly independent from the assumed structure. At 17 GPa, above which the system is non magnetic, . Interestingly, the ferromagnetic ordering in the PbO structure persists under compression till very high pressures. In fact, FM order would survive up to pressures as big as 35 GPa, if it were the stable phase.
Another interesting issue on pure FeTe is the lack of superconductivity up to 19GPaOkada2009 , the maximum pressure reached till now experimentally, this is the opposite to what happens in FeSe.Margadonna2009 ; Medvedev2009 Our calculations reveal that the transition from magnetic ordering to non magnetic ordering with increasing pressure occurs at about 17GPa and involves a ferromagnetic ordered phase. So the strong fluctuations which likely manifest near the transition are of ferromagnetic nature, oppositely to what happens in FeSe, and do not promote a superconduting transition.
IV Conclusions
We present first-principle results on FeTe under hydrostatic pressure. We confirm the experimental evidence of an AFMs2 magnetic order at ambient pressure and predict several phase transitions between magnetically ordered phases under pressure, until the magnetization goes to zero as the pressure increases above 17GPa. We find FM to be the ground state for pressure between 2.1GPa and 17GPa. This finding is in agreement with experimental results. We speculate that this may be the discriminant between the behavior of FeTe toward superconductivity with respect to other chalcogenides of the same family.
Acknowledgements.
We kindly acknowledge Prof. Liling Sun for sharing raw data. We acknowledge computational support by CASPUR through Standard HPC Grant 2012 std12-162 and std12-000. M.M. acknowledges support from the Regione Sardegna, through the felloship Studio computazionale dei superconduttori a base di ferro within the program POR SARDEGNA FSE 2007-2013. F.B. acknowledges support by the FP7 European project SUPER-IRON (grant agreement No. 283204). G.P. acknowledges supported by the FP7 European project SUPER-IRON (grant agreement No. 283204), by a CINECA- HPC ISCRA grant and by an HPC grant at CASPUR.References
- (1) Y. Mizuguchi, Y. Takano, Journal of the Physical Society of Japan, Volume 79, 102001 (2010).
- (2) M. Tropeano, I. Pallecchi, M.R. Cimberle, C. Ferdeghini, G. Lamura, M. Vignolo, A. Martinelli, A. Palenzona and M. Putti, Supercond. Sci. Technol. 23 (2010) 054001.
- (3) S. Margadonna, Y. Takabayashi, Y. Ohishi, Y. Mizuguchi, Y. Takano, T. Kagayama, T. Nakagawa, M. Takata, and K. Prassides, Phys. Rev. B 80, 064506 (2009).
- (4) S. Medvedev, T. M. McQueen, I. A. Troyan, T. Palasyuk, M.I. Eremets, R.J. Cava, Nature Mater. 8, 630 (2009).
- (5) Lijun Zhang, D.J. Singh, and M.H. Du, Phys. Rev. B 79, 012506 (2009).
- (6) Chao Zhang, Wei Yi, Liling Sun, Xiao-Jia Chen, Russell J. Hemley, Ho-kwang Mao, Wei Lu, Xiaoli Dong, Ligang Bai, Jing Liu, Antonio F. Moreira Dos Santos, Jamie J. Molaison, Christopher A. Tulk, Genfu Chen, Nanlin Wang, and Zhongxian Zhao, Phys. Rev. B 80, 144519 (2009).
- (7) A. Martinelli, A. Palenzona, M. Tropeano, C. Ferdeghini, M. Putti, M.R. Cimberle, T.D. Nguyen, M. Affronte, and C. Ritter, Phys. Rev. B 81, 094115 (2010).
- (8) C. Stock, E.E. Rodriguez, M.A. Green, P. Zavalij, and J.A. Rodriguez-Rivera, Phys. Rev. B 84, 045124 (2011).
- (9) Wei Bao, Y. Qiu, Q. Huang, M.A. Green, P. Zajdel, M.R. Fitzsimmons, M. Zhernenkov, S. Chang, Minghu Fang, B. Qian, E.K. Vehstedt, Jinhu Yang, H.M. Pham, L. Spinu, and Z.Q. Mao, Phys. Rev. Lett. 102, 247001 (2009).
- (10) Fengjie Ma, Wei Ji, Jiangping Hu, Zhong-Yi Lu, and Tao Xiang, Phys. Rev. Lett. 102, 177003 (2009).
- (11) Chang-Youn Moon and Hyoung Joon Choi, Phys. Rev. Lett. 104, 057003 (2010).
- (12) F. Caglieris, F. Ricci, G. Lamura, A. Martinelli, A. Palenzona, I. Pallecchi, A. Sala, G. Profeta and M. Putti, Sci. Technol. Adv. Mater. 13, 054402 (2012).
- (13) H. Okada, H. Takahashi, Y. Mizuguchi, Y. Takano, and H. Takahashi, Journal of the Physical Society of Japan 78 083709 (2009).
- (14) E. Giannini, R. Viennois, R. ČERNÝ, M. Hanfland, Chem. Met. Alloys 3 63 (2010).
- (15) A. Kreyssig, M.A. Green, Y. Lee, G.D. Samolyuk, P. Zajdel, J.W. Lynn, S.L. Bud’ko, M.S. Torikachvili, N. Ni, S. Nandi, J. B. Leão, S.J. Poulton, D.N. Argyriou, B.N. Harmon, R.J. McQueeney, P.C. Canfield, and A.I. Goldman, Phys. Rev. B 78, 184517 (2008).
- (16) S.A.J. Kimber, A. Kreyssig, Y.Z. Zhang, H.O. Jeschke, R. Valenti, F. Yokaichiya, E. Colombier, J. Yan, T.C. Hansen, T. Chatterji, R.J. McQueeney, P.C. Canfield, A.I. Goldman, and D.N. Argyriou, Nat. Mater. 8, 471 (2009).
- (17) R. Mittal, S. K. Mishra, S. L. Chaplot, S. V. Ovsyannikov, E. Greenberg, D. M. Trots, L. Dubrovinsky, Y. Su, Th. Brueckel, S. Matsuishi, H. Hosono, and G. Garbarino, Phys. Rev. B 83, 054503 (2011).
- (18) W.J. Duncan, O.P. Welzel, C. Harrison, X.F. Wang, X.H. Chen, F.M. Grosche, and P.G. Niklowitz, J. Phys. Condens. Matter 22, 052201 (2010).
- (19) W. Uhoya, A. Stemshorn, G. Tsoi, Y. K. Vohra, A. S. Sefat,B. C. Sales, K. M. Hope, and S. T. Weir, Phys. Rev. B 82, 144118 (2010).
- (20) E. Colombier, S.L. Budko, N. Ni, and P.C. Canfield, Phys. Rev. B 79, 224518 (2009).
- (21) M.S. Torikachvili, S.L. Budko, N.Ni, and P.C. Canfield, Phys. Rev. Lett. 101, 057006 (2008).
- (22) T. Yamazaki, N. Takeshita, R. Kobayashi, H. Fukazawa, Y. Kohori, K. Kihou, C. H. Lee, H. Kito, A. Iyo, and H. Eisaki, Phys. Rev. B 81, 224511 (2010).
- (23) A.I. Goldman, A. Kreyssig, K. Prokes, D.K. Pratt, D.N. Argyriou, J.W. Lynn, S. Nandi, S.A.J. Kimber, Y. Chen, Y.B. Lee, G. Samolyuk, J.B. Leão, S.J. Poulton, S.L. Budko, N. Ni, P.C. Canfield, B.N. Harmon, and R.J. McQueeney, Phys. Rev. B 79, 024513 (2009).
- (24) D.K. Pratt, Y. Zhao, S.A.J. Kimber, A. Hiess, D.N. Argyriou, C. Broholm, A. Kreyssig, S. Nandi, S. L. Budko, N. Ni, P.C. Canfield, R.J. McQueeney, and A.I. Goldman, Phys. Rev. B 79, 060510 (2009).
- (25) A. Mani, N. Ghosh, S. Paulraj, A. Bharathi, and C.S. Sundar, Europhys. Lett. 87, 17004 (2009).
- (26) T. Yildirim, Phys. Rev. Lett. 102, 037003 (2009).
- (27) W. Ji, X.-W. Yan, and Z.-Y. Lu, Phys. Rev. B 83, 132504 (2011).
- (28) N. Colonna, G. Profeta, A. Continenza, and S. Massidda, Phys. Rev. B 83, 094529 (2011).
- (29) S.X. Huang, C. L. Chien, V. Thampy, and C. Broholm, Phys. Rev. Lett. 104, 217002 (2010).
- (30) M. Bendele, A. Maisuradze, B. Roessli, S. N. Gvasaliya, E. Pomjakushina, S. Weyeneth, K. Conder, H. Keller, R. Khasanov, arXiv:1209.0383 (2012).
- (31) C. Koz, S. Rossler, A.A. Tsirlin, D. Kasinathan, C. Borrnert, M. Hanfland, H. Rosner, S. Wirth, and U. Schwarz, Phys. Rev. B 86, 094505 (2012).
- (32) P.E. Blochl, Phys. Rev. B 50, 17953 (1994).
- (33) G. Kresse and J. Furthmuller, Phys. Rev. B 54, 11169 (1996).
- (34) G. Kresse and J. Furthmuller, Comput. Mater. Sci. 6, 15 (1996).
- (35) J.P. Perdew and Y. Wang, Phys. Rev. B 45, 13244 (1992).
- (36) I.I. Mazin, M.D. Johannes, L. Boeri, K. Koepernik, and D. J. Singh Phys. Rev. B 78, 085104 (2008).
- (37) S.S. Naghavi, S. Chadov and C. Felser J. Phys. Condens. Matter 23 (2011) 205601.
- (38) Shiliang Li, Clarina de la Cruz, Q. Huang, Y. Chen, J. W. Lynn, Jiangping Hu, Yi-Lin Huang, Fong-Chi Hsu, Kuo-Wei Yeh, Maw-Kuen Wu, and Pengcheng Dai, Phys. Rev. B 79, 054503 (2009)
- (39) Kuo-Wei Yeh , Tzu-Wen Huang , Yi-lin Huang , Ta-Kun Chen , Fong-Chi Hsu , Phillip M. Wu, Yong-Chi Lee, Yan-Yi Chu, Chi-Lian Chen, Jiu-Yong Luo, Der-Chung Yan and Maw-Kuen Wu, Europhys. Lett. 84, 37002 (2008).
- (40) Absolute value of lattice constants were kindly provided by Liling Sun because they were not published in Ref.Zhang09, .
- (41) Xinzhe Jin, Toshihiro Masubuchi, Tadataka Watanabe, Kouichi Takase and Yoshiki Takano, J. Phys.: Conf. Ser. 150 052085 (2009).
- (42) G. Prando Phys. Rev. B (submitted).
- (43) Y. Mizuguchi, Y. Hara, K. Deguchi, S. Tsuda, T. Yamaguchi, K. Takeda, H. Kotegawa, H. Tou and Y. Takano, Supercond. Sci. Technol. 23 (2010) 054013.
- (44) K. Kuroki, H. Usui, S. Onari, R. Arita and H. Aoki, Phys. Rev. B 79, 224511 (2009).