The spectral energy distributions of K+A galaxies from the UV to the mid-IR: stellar populations, star formation and hot dust
Abstract
We present spectrum synthesis fits to 808 K+A galaxies selected from the Sloan Digital Sky Survey (SDSS) and population synthesis of their spectral energy distributions, extending from the far UV (0.15 m) to the mid IR (22 m), based on the results of STARLIGHT code fitting to the SDSS spectra. Our modelling shows that K+A galaxies have undergone a large starburst, involving a median 50% of their present stellar masses, superposed over an older stellar population. The metal abundance of the intermediate-age stars shows that star formation did not take place in pristine gas, but was part of a dramatic increase in the star formation rates for originally gas-rich objects. We find no evidence for on-going QSO activity in the UV, which is well modeled by the emission of intermediate-age stars. We use K+A galaxies as local counterparts of high redshift objects to test for the presence of Thermally Pulsing AGB stars in similarly-aged populations and find no excess in the infrared due to emission from such stars, arguing that more distant galaxies are indeed old and massive at their redshift. All of our galaxies show significant excesses in the mid-IR compared to the light from their stars. We fit this ad hoc with a 300K blackbody. Possible sources include TP-AGB stars, obscured young star clusters and hidden AGNs, heating a significant dust component.
keywords:
K+A galaxies; post-starburst galaxies; galaxy formation1 Introduction
Most galaxies in the Universe fall into two broad classes in the colour-luminosity plane: a ‘red sequence’ of largely quiescent, typically early-type, old and metal rich systems, or within a ‘blue cloud’ of star-forming, later-type, more metal poor and usually less massive objects. The bimodality appears to be robust as a function of environment and is observed even at higher redshift (Strateva et al., 2001; Baldry et al., 2006; Brammer et al., 2009; Muzzin et al., 2012)111The literature on this subject is vast and it is impossible to do justice to the issue within a short introduction; here we mention a few papers we find especially useful as starting points for readers interested in exploring this topic further. The origin of the bimodal distribution and how galaxies migrate between the blue cloud and red sequence (and vice versa) are topics of active current research, both observational and theoretical. It is clear that in this context galaxies in the ‘green valley’, crossing between the two main clumps in colour-magnitude space, may provide important clues as to the processes leading to the origin of the red sequence and blue cloud, and how galaxies evolve between them.
In this framework, the class of objects known as K+A galaxies is particularly interesting. These appear to be galaxies whose spectrum shows signs of a recent (within 0.2 – 2 Gyr) episode of star formation, producing a strong Balmer series due to A stars, superposed over an old stellar population (dominated by K giants) typical of spheroids and early-type spirals. Nevertheless, there is no strong [OII] or H emission indicating that star formation is currently not taking place (e.g., Couch & Sharples 1987; Quintero et al. 2004). In many cases, the starburst appears to have comprised a significant fraction (20–60%) of the galaxy mass (e.g., Kaviraj et al. 2007; Choi, Goto & Yoon 2009 and see below). K+A’s, therefore, are observed in a short-lived phase as they transit from the blue cloud to the red sequence and thus provide the opportunity to obtain unique insights into the processes leading to the morphological and spectrophotometric transformation of galaxies.
Major starbursts of the importance observed in these objects are often encountered in mergers and interactions (e.g., the Antennae) and there is in fact some morphological evidence that a substantial fraction of K+A galaxies may be in interacting systems (see e.g. Yamauchi, Yagi & Goto 2008; Yang et al. 2008 and references therein). While we therefore have some hints as to what triggered the massive starbursts, the real mystery is what made star formation stop so suddenly that today we basically observe no traces of on-going star formation.
However, a significant fraction of the current star formation in distant clusters (where K+A galaxies were originally discovered by Dressler & Gunn 1983), is obscured by dust (Duc et al. 2002, Saintonge, Tran & Holden 2008, Dressler et al. 2009) suggesting that dust obscuration may explain the lack of observed star formation in K+A galaxies. Shioya, Bekki & Couch (2001) suggest that the progenitors of K+A galaxies may have been dusty starbursts of the e(a) type. It is also possible that star-forming is continuing: A-type stars could migrate away from their parental dust clouds during their lifetime, while more massive stars would still remain heavily obscured (Poggianti & Wu, 2000), thus producing an A-rich spectrum. Smail et al. (1999) found evidence of on-going star formation in their sample of 5 K+A’s while Miller & Owen (2001) detected 1.4 Ghz emission in 2 out of 15 K+A galaxies (this may be due to an AGN or to synchrotron radiation from supernova remnants in an obscured star forming region). Goto (2004) set a limit of yr-1 to the current star formation in a few K+A galaxies observed with the VLA. At least some K+A galaxies are seen to have substantial gas reservoirs comparable to those of spirals of similar luminosities (Chang et al., 2001; Buyle et al., 2006), suggesting that these galaxies may potentially be able to reinitiate star formation in the future.
In our previous work we have found that a stacked FIRST (Becker, White & Helfand 1995) image of 811 K+A galaxies selected from the SDSS Data Release 7 (Abazajian et al., 2009; Goto, 2007) shows only weak 1.4Ghz continuum signal, most of which appears to come from a subsample of about 5% of the galaxies that have (5) unambiguous detections in the FIRST survey (above 0.8 mJy), approximately equally split between AGNs and star-forming galaxies. The median stack of the remainder of the galaxies is consistent with a purely radio-quiet population (Nielsen et al., 2012). This may suggest that most K+A galaxies are observed in the ‘off’ phase of an activity cycle, and that such galaxies might actually move back and forth between the blue cloud and red sequence until their gas reservoirs are finally exhausted. Such a cycle of activity, modulated by mergers and ’feedback’, has been proposed by Hopkins et al. (2008) to account for the formation of a tight red sequence within a hierarchical merger scenario. It is therefore possible that K+A galaxies may be ‘playing possum’ rather than having permanently migrated towards the red sequence following a (merger-induced?) starburst.
K+A galaxies may also provide clues as to the nature of high redshift objects and their star formation history. There is a significant population of galaxies that appear to be red, quiescent, and massive. Such systems are difficult to explain within standard formation scenarios, as they appear to be already well-formed despite the Universe’s relative youth (Yan et al., 2004; Cirasuolo et al., 2010). Maraston (2005) proposed that these objects ’fake’ their old ages because they are dominated by Gyr old stars, which produce Thermally Pulsing AGB stars (TP-AGB), whose high luminosities and red colours mask the underlying blue light and therefore yield apparently larger stellar masses and older ages (Tonini et al., 2009, 2010), even for young and relatively low mass objects. Present-day K+A galaxies of course also host older stellar populations, but they have experienced a major star-formation episode, involving a large fraction of their stellar mass, and may therefore be adequate local counterparts to test this hypothesis (Kriek et al., 2010; Zibetti et al., 2012), whereas detection of the spectral signatures of TP-AGB stars would be very difficult at high redshifts.
In this paper we present a statistical study of the properties of the 811 K+A galaxies studied by Nielsen et al. (2012), for which we have combined SEDs obtained using archival data from GALEX, SDSS, 2MASS and WISE, with the population synthesis study of the SDSS spectra by Cid Fernandes et al. (2005). We use the combined knowledge of stellar populations, models, and spectral energy distributions covering the entire thermal spectrum over 2 decades in wavelength (from 0.15 to 22 m) to discuss the internal constituents of K+A galaxies, test current star formation and the nature of the starburst, and compare with high redshift galaxies. In the next section we describe the dataset, photometry and spectroscopy, and population synthesis models. We then discuss and interpret the results and present our conclusions and suggestions for future work. Unless otherwise stated and where applicable, we use the ’concordance’ cosmological parameters derived from the latest analysis of WMAP data in Jarosik et al. (2011).
2 Description of the Dataset and Broad Properties
We used a sample of 811 K+A galaxies selected from the SDSS as described by (Nielsen et al., 2012). This is an expansion of the K+A sample used by Goto (2007) and drawn from the 7th data release of the SDSS (Abazajian et al., 2009). Briefly, only objects classified as galaxies with a spectroscopic per pixel are considered. The selection criteria of K+A galaxies are equivalent widths of HÅ; HÅ; and [OII]Å where emission lines are negative. Galaxies with redshift have been excluded due to contamination by the 5577Å atmospheric feature.
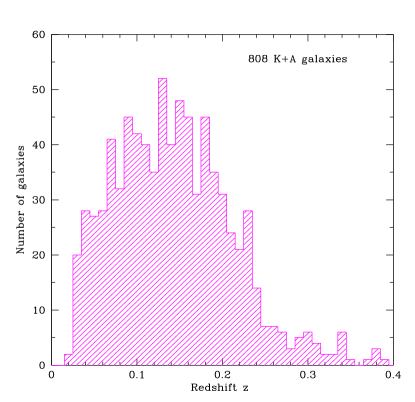
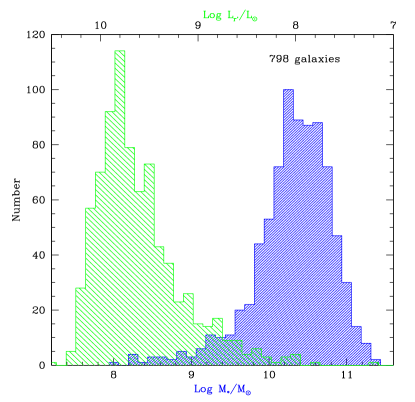
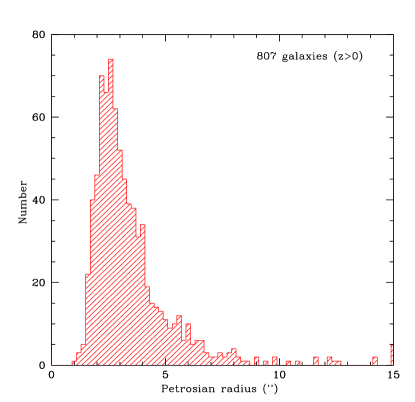
Figure 1 summarizes the principal characteristics of the sample. Galaxies span the redshifts with a median of and have typical luminosities of and total stellar masses (as given by STARLIGHT; see below) of comparable to approximately galaxies, with a longer tail towards lower mass objects. Most objects are resolved and have apparent radii of a few arcsec, typical of galaxies of their luminosity at the appropriate redshift.
Of the 811 galaxies in the Nielsen et al. (2012) sample, we have retrieved spectra from the SDSS database (Abazajian et al., 2009), as well as the associated SDSS photometry in . For these galaxies we then proceeded to obtain multi-wavelength photometry in the far ultraviolet from the GALEX archive (Morrissey et al., 2007), infrared () data from the 2MASS (Skrutskie et al., 2006) and the latest release of the UKIDSS survey222The UKIDSS project is defined in Lawrence et al. (2007). UKIDSS uses the UKIRT Wide Field Camera WFCAM (Casali et al. 2007). The photometric system is described in Hewett et al. (2006), and the calibration is described in Hodgkin et al. (2008). The pipeline processing and science archive are described in and Hambly et al (2008), and finally fluxes at 3.4, 4.6, 12 and 22 m from the WISE dataset (Wright et al., 2010). We also used archival data from the Spitzer Space Telescope for a few galaxies observed as part of other programs (e.g., Lockman Hole, ELAIS).
Given the fact that this study is entirely based on existing archival data, from the outset we were concerned about possible systematic effects due to aperture matching in the photometry. Thus, we carefully inspected the relevant data bases for the measurements that would minimize any systematic difference for the different catalogues.
Our base photometry is the optical from the SDSS, which is measured in Petrosian apertures that are expected to approximate the total flux of galaxies. GALEX photometry is calculated in similar Kron-style apertures, but the resolution () and point spread function ( in the near UV and in the far UV) are such that, given the sizes of most our objects (Figure 1), they are basically star-like as seen by this telescope.
The 2MASS survey provides isophotal and extrapolated magnitudes for objects in the Extended Source Catalog (XSC), comprising 291 of our 811 K+A galaxies. Comparison with UKIDSS Petrosian magnitudes (for 71 of these objects which are in common with the XSC) showed that the isophotal estimates are more stable and closer to a ‘SDSS-style’ total magnitude, and these were adopted. Almost all of our galaxies are also in the 2MASS Point Source Catalog (PSC). For the remaining 620 objects (in the PSC) we also carried out a comparison with the UKIDSS photometry in the appropriate bands and eventually concluded that the 2MASS aperture magnitude yields a closer estimate to the total magnitude and this was therefore employed in our analysis (note that this is comfortably larger than the Petrosian sizes of most of our sample as shown in Figure 1 above).
WISE gives magnitudes within the XSC isophotal apertures if objects are positionally matched to 2MASS and ‘adaptive’ apertures for all other galaxies. We accepted the WISE estimate of the best magnitudes for our galaxies, as provided by their database. As it turned out, 12 of our objects have been observed by IRAC and MIPS24 with SPITZER. The corresponding SPITZER Kron magnitudes compare very well with the WISE values in the and bands, which gives us confidence that the WISE magnitudes are measured through apertures consistent with the rest of the bands.
Table 2 shows the first 10 objects and their photometry; the full table is available on the MNRAS website in machine-readable format. Only for 98 galaxies in our sample we have full FUV(0.15) to MIR (22) SEDs; while for essentially the full sample we have to data.
| GALEX | SDSS | 2MASS or UKIDSS | WISE | |||||||||||||
|---|---|---|---|---|---|---|---|---|---|---|---|---|---|---|---|---|
| Galaxy | FUV | NUV | u’ | g’ | r’ | i’ | z | Y | J | H | Ks | |||||
| 1 | 001027.392-104341.71 | 0.00 | 14.57 | 21.91 | 46.73 | 49.51 | 41.73 | 35.40 | 0.00 | 21.21 | 10.78 | 7.50 | 1.83 | 0.93 | 0.55 | 0.39 |
| 2 | 001551.253-102317.92 | 17.01 | 11.74 | 13.21 | 35.22 | 38.24 | 31.69 | 26.42 | 0.00 | 16.41 | 10.58 | 5.92 | 1.14 | 0.49 | 0.07 | 0.00 |
| 3 | 010823.370-094356.22 | 0.00 | 0.00 | 8.33 | 17.70 | 24.44 | 22.44 | 19.46 | 0.00 | 12.44 | 11.31 | 5.15 | 1.13 | 0.44 | 0.00 | 0.19 |
| 4 | 011942.227+010751.63 | 16.51 | 24.61 | 25.91 | 56.62 | 57.04 | 48.34 | 42.05 | 0.00 | 32.57 | 24.67 | 11.38 | 2.39 | 0.81 | 0.08 | 0.00 |
| 5 | 012015.683-095920.12 | 0.00 | 10.17 | 12.92 | 34.19 | 37.75 | 32.13 | 27.35 | 0.00 | 22.10 | 12.20 | 3.63 | 1.62 | 0.60 | 0.07 | 0.24 |
| 6 | 014327.340-011342.55 | 3.69 | 6.66 | 7.75 | 20.41 | 28.80 | 26.64 | 22.75 | 20.55 | 16.15 | 11.84 | 7.26 | 1.47 | 0.64 | 0.35 | 0.37 |
| 7 | 014838.633-093259.77 | 3.90 | 0.00 | 9.12 | 24.25 | 32.38 | 28.64 | 24.63 | 0.00 | 16.19 | 10.64 | 6.16 | 1.29 | 0.49 | 0.07 | 0.00 |
| 8 | 015107.018-005636.72 | 1.49 | 4.93 | 9.69 | 24.30 | 31.78 | 28.20 | 24.74 | 21.92 | 18.45 | 12.27 | 6.95 | 1.59 | 0.65 | 0.11 | 0.00 |
| 9 | 020505.984-004345.25 | 23.26 | 29.85 | 27.71 | 47.72 | 46.78 | 39.83 | 31.64 | 26.33 | 19.83 | 9.36 | 5.98 | 1.18 | 0.44 | 0.15 | 0.00 |
| 10 | 021007.624-095431.19 | 227.70 | 181.10 | 79.85 | 126.30 | 105.20 | 85.36 | 62.76 | 0.00 | 0.00 | 0.00 | 0.00 | 1.19 | 0.39 | 0.17 | 0.11 |
The table shows the SDSS name (in the form hhmmss.sss and ddmmss.ss) and the fluxes in GALEX (FUV and NUV), SDSS (), 2MASS () or UKIDSS (), and the four WISE bands (in this order) in units of ergs cm-2 s-1 Å-1. Upper limits are shown as zeros in the table. For reasons of clarity and economy of space, Table 2 does not give the measurement errors, which are publicly available from the source web-sites. It should be reiterated here that the magnitudes come from a variety of methods on data and instruments of varying resolution and therefore we assume that these individual measurements adequately approximate the total magnitude of galaxies without distorting their spectral energy distributions (this amounts to saying that the apertures used are reasonably similar and colour gradients weak). The tabulated fluxes have been corrected for extinction as described below.
We will first analyze the stellar populations of these galaxies based on modelling the SDSS spectra and line ratios. This information will then be used to inform our understanding of their spectral energy distributions and the nature of the astrophysical sources contributing to the light in different wavelength regimes.
2.1 Stellar Populations from Spectrum Synthesis Models
Stasinska et al. (2008) have used STARLIGHT to fit simple stellar population (SSP) models to hundreds of thousands of galaxy spectra from the SDSS/DR7 data release. Full details about the modelling process are given by Cid Fernandes et al. (2005). Briefly, the spectral fits are based on the Bruzual & Charlot (2003; BC03) models with the STELIB library (Le Borgne et al., 2003), and the Padova 1994 evolutionary tracks (Bertelli et al., 1994) with a Chabrier (2003) IMF. The data, the model fits for the galaxies in our sample, and the code itself are publicly available from the STARLIGHT website,333http://www.starlight.ufsc.br and many details about the use of these models for studies of galaxies with very weak emission lines are given in the series of papers by the SEAGal collaboration cited by Cid Fernandes et al. (2011).
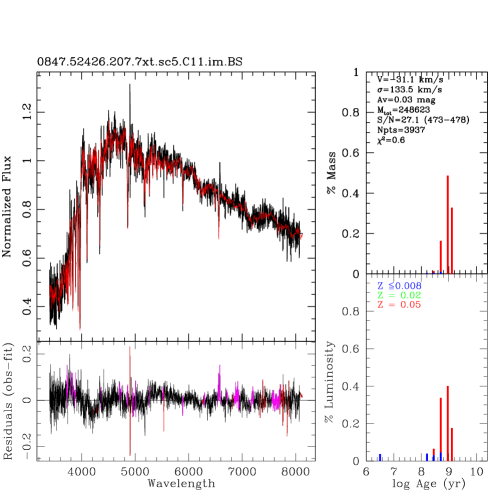
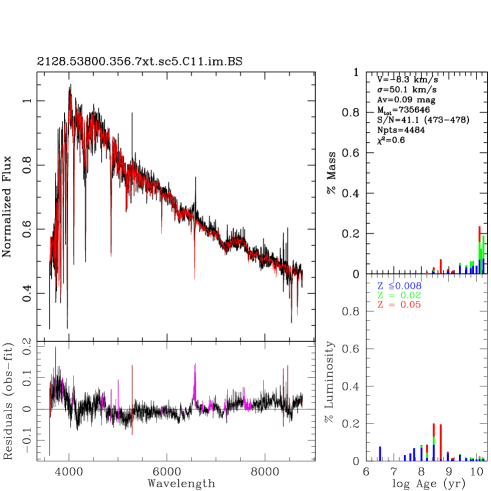
The SDSS STARLIGHT database includes 808 of our 811 galaxies. Therefore, the three missing objects (J103833.180+034930.29; J143852.706+613020.53; and J144332.436+304807.40), for which we do have the SEDs and spectra, will not be included in our study. The SSP models fit the stellar populations using 25 different ages and 6 metallicities. Examples of STARLIGHT fits for two ‘typical’ K+A galaxies are shown in Figure 2 that presents the observed and fitted spectra, the residuals, and the star formation histories resulting from the fit (ages, metallicities).
| Bins | STARLIGHT | MARASTON-mix |
|---|---|---|
| BC03+Chabrier | rhb+Kroupa | |
| Age [Gyr] | ||
| young | ||
| intermediate | ||
| old | ||
| Metallicity | ||
| metal poor | ||
| solar | ||
| metal rich | (0.04+0.07)/2 | |
For a variety of reasons, obtaining reliable estimates of the statistical uncertainties in the stellar populations derived from ssp model fits is a notoriously difficult task (see e.g. González Delgado & Cid Fernandes (2010) for a recent discussion) and in particular STARLIGHT does not provide statistical errors. In a previous investigation (Melnick et al., 2012) we found that using wider age and metallicity bins increases the robustness of the models against statistical and systematic (i.e. variations in the input parameters) fluctuations. Therefore, we binned the populations into 3 broad metallicity () bins and 3 age groups () as indicated in Table 2. The binned populations of the first 10 galaxies are listed in Table 2.1 (the full table is available on the MNRAS website in machine-readable format).
Figure 2 summarizes the star formation histories of K+A galaxies as derived from the STARLIGHT fits:
![[Uncaptioned image]](/html/1301.5325/assets/x6.png)
-
•
On average, the intermediate age stars (formed in the recent star formation episode and contributing to the A spectrum) account for close to 50% of the total stellar mass in K+A galaxies. This strongly suggests that the starburst has involved a very significant portion of the initial mass of the galaxy (Kaviraj et al., 2007; Choi et al., 2009). Analysis of colour gradients for K+A galaxies by Yang et al. (2008) and IFU spectroscopy by Pracy et al. (2012) argues that the starburst tended to take place preferentially in the central regions of galaxies.
-
•
In agreement with the lack of strong [OIII] and H emission, the population of young ( Gyr) stars is negligible; the mean of the sample is 0.3% and only three galaxies have more than 10% young stars.
-
•
The intermediate-age (IA) populations tend to be predominantly metal poor or metal-rich; the median galaxy has close to 80% metal-rich IA stars, while less than 10% of the galaxies have more than 20% IA stars of solar metallicity. This supports our previous point that a rapid starburst took place, involving a large fraction of the pre-existing gas. Minor mergers with gas-rich subsystems are unlikely to provide sufficient material to account for the large fraction of younger stars, and would presumably dilute the existing material with more pristine gas.
-
•
We suggest that K+A galaxies must have therefore experienced a dramatic increase in their star formation rates followed by rapid quenching (Brown et al., 2009), given the lack of current star formation. The abundance pattern observed supports this hypothesis, as we would expect a gentler and more continuous distribution if star formation had been slowly throttled by mechanisms such as ’strangulation’ or ‘harassment’.
-
•
About 15% of the galaxies do not contain an old stellar population. Otherwise, the old stellar population is predominantly metal poor. Close to 50% of the galaxies do not contain old, metal rich stars, while the median fraction of solar abundance stars is 20%. The original galaxies must therefore have appeared as late(r)-type spirals of apparently lower stellar mass. Mendel et al. (2012) suggest that the K+A phenomenon is related to the growth of the galactic bulge, and therefore morphological transformation.
2.2 Emission-line Diagnostic Diagrams
Almost all the K+A galaxies in our sample show weak but clearly visible emission-lines of [NII]6548,6584 and H, and many galaxies also show [OII]3727,3729 and [OIII]5007. It is possible, therefore, to use emission-line diagnostic diagrams to gain further insight into the stellar populations by exploring the photoionization properties of the sample. The SEAGal collaboration (Cid Fernandes et al. 2011; henceforth CFS11 and references therein) have extensively explored this issue on a sample of 700 thousand galaxies from the SDSS with weak emission lines. In particular, they noted that the traditional ‘BPT’ diagnostic diagrams that make use of the [OII], [OIII], and H lines (among others) are not suitable for galaxies with weak emission lines because these lines are usually very weak and, in the case of H, are heavily contaminated by underlying absorption. This is particularly important for K+A galaxies where the emission lines are, by definition, weak while Balmer absorption lines are strong.

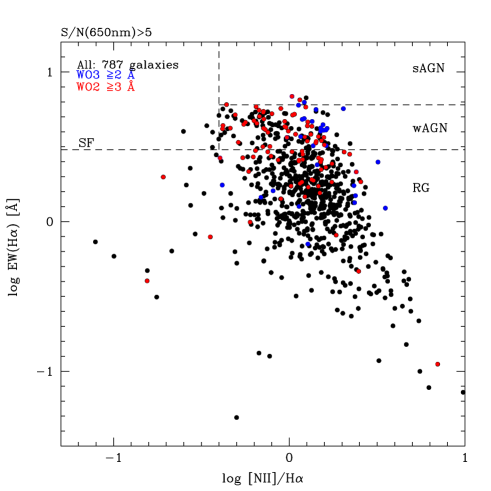
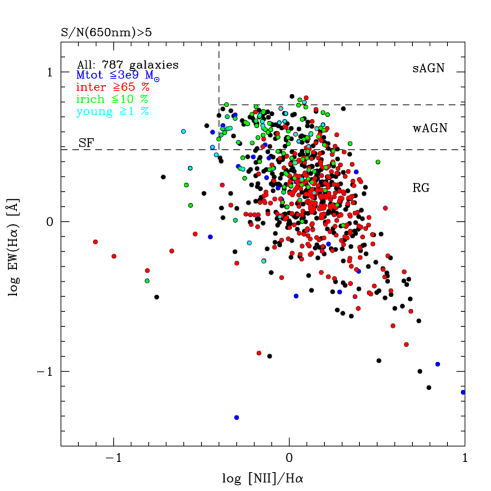
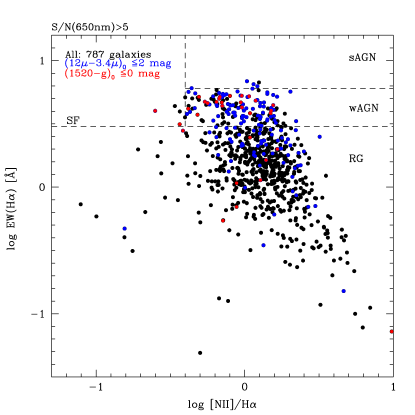
They therefore introduced a new diagnostic diagram, which they call ‘WHAN’, that only uses [NII]6584 and H, which are usually the strongest lines in these types of galaxies. Cid Fernandes et al. (2010) and CFS11 have in fact shown that their EW(H) vs. [NII]/H ‘WHAN’ diagram retains the diagnostic power of the more traditional BPT plots, but also allow to separate ‘true’ from ‘fake’ AGNs as we shall see below, while being less sensitive to reddening.
Figure 4 shows the WHAN diagram for the 787 galaxies in our sample that have in the continuum around [NII] & H (as indicated in the top-label of the figure). The dashed lines separate the regions populated by LINERS, SEYFERTS, and star-forming galaxies (SF) as defined by Kewley et al. (2006) transported to the WHAN plane by Cid Fernandes et al. (2010). The plot shows that, as expected, the overwhelming majority of our K+A galaxies fall in the LINER domain.
2.3 Spectral Energy Distributions (SED) from 0.15 to 22 m
We can now analyze the full UV-optical-infrared spectral energy distributions of K+A galaxies in the light of the information on their stellar populations provided by the analysis of their spectra and the WHAN diagram. Fluxes retrieved from the archives were corrected for foreground Galactic extinction using the AV values of Schlafly & Finkelbeiner (2011) (downloaded for each source using NED) and for internal extinction using the AV given by the STARLIGHT models. In both cases we used the CCM (Cardelli, Clayton, & Mathys, 1989) extinction law for the Milky Way in view of the high metallicity of our galaxies. Figure 5 presents sample SEDs for two of the K+A galaxies with full FUV to MIR data.
The STARLIGHT models use BC03 but one of our aims in this study is to verify whether TP-AGB stars are needed to reproduce the spectral energy distributions of ‘young’ galaxies (whether K+As or objects in the distant universe) and we therefore test our observations against the SSP models of Maraston (2005, hereafter M05), which explicitly treat this stage of stellar evolution (see Introduction). We used the M05 SSP models for the Kroupa IMF, which provide spectral energy distributions for 6 different metallicities ranging from 1/180th to 3.5 times solar (-2.25 to +0.67 dex)444We did not use the [M/H]= models, however, in order to maximize overlap with the STARLIGHT models that stop at [M/H]=-1.35. and two different horizontal-branch (HB) morphologies, chosen heuristically to account for the second parameter problem (bhb for blue and rhb for red horizontal branches).
To simplify the analysis, and because at this stage we are mostly concerned with the ensemble properties of K+A galaxies rather than the detailed modelling of individual objects, we averaged together the models into three age bins and three metallicity bins matching as close as possible the ranges spanned by STARLIGHT as shown in Table 2.
We then used the stellar mass fractions for each STARLIGHT bin to generate our model SEDs as:
| (1) |
where for each galaxy are the STARLIGHT mass fractions for the six age and metallicity bins described in Table 2 (including only the intermediate-age and old populations since the fraction of young stars is negligible); are the corresponding MARASTON bins defined in Table 2.
Notice that since we are not including the young populations, although for 95% of the galaxies the sum is and only for 4 galaxies is the sum . Throughout the paper we will refer to the resulting as the MARASTON-mix for each galaxy, for which the constant A is fixed matching the model to the observed fluxes in the SDSS -band (0.626) at the corresponding redshifts.
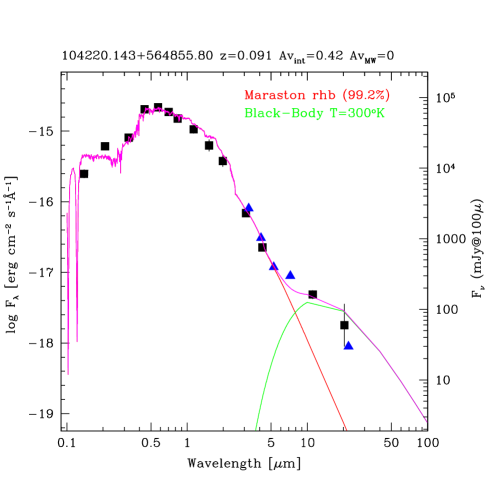
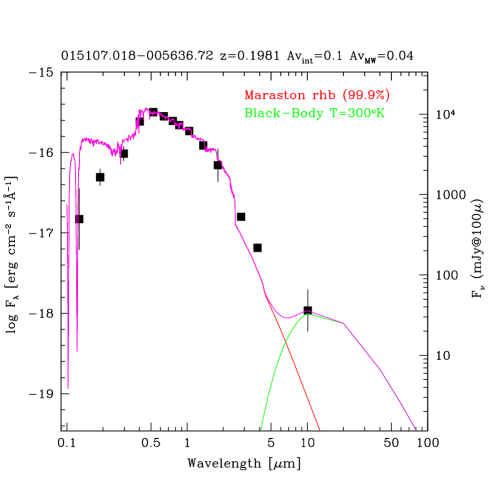
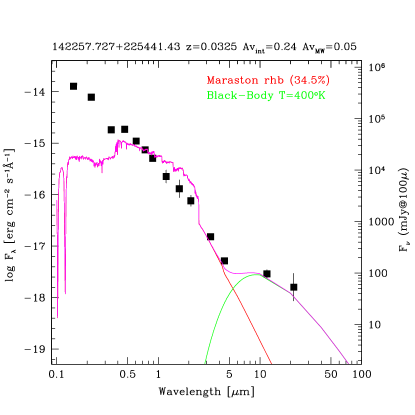
Figure 5 shows examples of a very good fit (left) and a rather poor fit (right). Since the differences in HB morphology are only relevant for old stars, we chose to use the rhb models that cover the full range of ages.555some of the bhb models are tabulated for only two ages 10Gyr and 15Gyr, making them much less convenient to use. The legends also indicate the fraction of the total stellar mass that was included in the composite model spectra for each galaxy.
Figure 5 (see also Figs. 10 and 12) clearly shows that our Maraston-mix SEDs reproduce quite well the observed SEDs from the FUV to the optical (including ), but deviate systematically towards the red; there is a clear excess in the IR, which we ascribe (see later) to the treatment of TP-AGB stars, and a significant excess over the expected blackbody behavior at longer wavelengths, where a hot dust component appears to be needed to account for the observations.
Determining the temperature of this hot dust component on the basis of only the WISE data, however, is rather uncertain so we searched the IRAS and SPITZER data bases to extend the wavelengths coverage in the mid- to far-IR, and found SPITZER data for 12 sources in the range, although only a few of these galaxies have complete wavelength coverage in this range.
The data for one such galaxy are plotted in the left panel of Figure 5 as blue triangles. Using the SPITZER data we found that K provides a good fit to the observations of these 12 galaxies, and we therefore adopted the same temperature for the hot dust component of all the galaxies in our sample, although for individual cases, such as the one shown in the figure, a different temperature (in this case 400K) would have provided a better fit. The uncertainties in the Maraston models discussed below, and the fact that only slightly more that 25% of our galaxies are detected at 12 and 22 microns, however, preclude leaving as a free parameter.
3 Discussion
Analysis of the spectra of K+A galaxies shows that these objects appear to consist of originally late-type galaxies that have experienced a starburst involving a large fraction of their stellar mass. We have modeled their stellar populations on the basis of these spectral fits and we can now compare with the observed SEDs to test models for the origin of the UV flux, the presence of TP-AGB stars, and the contribution from hot dust.
We assume that the stellar populations deduced from the SDSS spectral fibers can be extrapolated to the galaxies as a whole. Only integral field spectroscopy can resolve this difficulty, but it is not generally available for our objects. It seems reasonable to assume that the SDSS spectral fibers are well centered on the brightest parts of our relatively compact galaxies, but we cannot exclude the possibility of radial population gradients (Pracy et al., 2012). However, a significant increase in the young stellar populations in the outskirts of the galaxies, for example, would radically change the FUV to optical SEDs, which are otherwise very well reproduced by our Maraston-mix (which does not include young stars). We are confident, therefore, that the SDSS spectra sample reasonably well the overall stellar populations in K+A galaxies. Barring significant stellar population gradients, the only free parameter in our simple SED fitting approach is the zero point offset between the photometric and spectroscopic fluxes, which we calibrated out by matching the models to the SDSS -band fluxes.
3.1 Emission-line Properties of K+A Galaxies
We have seen that the overwhelming majority of K+A galaxies are LINERs (i.e. “low ionization nuclear emission-line regions”) originally proposed by Heckman (1980) as a distinct class of AGN. However, LINERs are actually a mixed bag of objects with very different ionization mechanisms (e.g Terlevich & Melnick 1985). Thus, some LINERs are genuine AGN whereas most are actually powered by stars: they are ‘fake’ AGN.
CFS11 analyzed the spectra of a sample of several hundred thousand galaxies from the SDSS, more than half of which turned out to be LINERs. This is by far the most comprehensive study of the properties of LINERs we are aware of and contains an excellent up to date review of the ‘LINER problem’. On the basis of extensive modelling, CFS11 showed that ‘true’ and ‘fake’ LINERs can be nicely separated using their WHAN diagram, and therefore proposed a new classification scheme for emission-line galaxies. This new scheme is presented in Figure 6 that plots the WHAN diagram of K+A galaxies as in Figure 4.
The new ‘physically inspired’ classification scheme of CFS11 divides emission-line galaxies into 4 groups as follows: they separate LINERS into two groups, ‘weak AGN’ (wAGN), and ‘retired galaxies’ (RG). Thus, wAGN are objects with Å and , which CFS11 claim to be powered by bona-fide nuclear black-holes. Conversely, RGs are objects with EW(H0.3Å that are not powered by a nuclear engine, but by ‘hot old low-mass evolved stars’ (HOLMES) and therefore were actually ‘fake’ AGNs in the old classification scheme. As expected, the galaxies with strongest [OII] & [OIII] lines lie closest to the AGN boundary as also do galaxies with ‘significant’ (i.e. 1.5%) young stellar populations. In K+A galaxies the strong UV emission from the intermediate age populations may supply the UV flux which (in the HOLMES case) is actually provided by old Helium-burning stars, since the older stellar populations are not very massive in our galaxies.
Although some AGNs are known to exist in K+A galaxies (Liu et al., 2007), Shin, Strauss & Tojeiro (2011) find that there are only a few bona fide AGNs associated with these galaxies and that the AGN is not related to the previous star formation episode. In our previous work, we showed that most K+A galaxies do not show evidence of AGN activity by stacking their 20cm signal (Nielsen et al., 2012). Brown et al. (2009) argue that AGNs are only responsible for quenching the more massive K+A galaxies, although Snyder et al. (2011) presents a model where K+A galaxies are the product of gas-rich mergers, where the K+A phase follows quenching by central AGNs (see also the discussion in Mendel et al. 2012).
It is not obvious to us that most, or even some, of the objects in the wAGN zone are actually not ‘fake’ AGN. In order to probe further into this issue in the left panel of Figure 6 we show with different colors galaxies with particularly ‘strong’ (in this context!) [OII] and [OIII] lines. These ‘strong’ lined galaxies tend to concentrate in the wAGN zone, but many are also RGs, so we can’t use these lines as criteria to distinguish true from fake AGNs.
In the right-hand panel of Figure 6 we have color-coded the data according to some relevant parameters from the STARLIGHT models. The figure clearly shows that galaxies where the intermediate-age stars are predominantly metal-poor concentrate in the wAGN zone, while galaxies where the intermediate-age populations are metal rich tend to avoid that zone and concentrate in the region of RGs. Galaxies with lower stellar masses (, higher internal extinction, and the few galaxies with significant (i.e. 1%!) young stellar populations also tend to concentrate in the SF or wAGN domains. The above argues that the engine of the weak emission lines comes of the UV emission from intermediate age populations, rather than HOLMES as in other RGs studied by CFS11
A priori, if wAGN are ionized by a central engine, we would not expect to find their emission-line properties to be correlated in any way with the stellar populations of their parent galaxies, in particular in the case of K+A galaxies where the populations of young stars are negligible. But we do see a correlation, which leads us to posit that the majority of the K+A galaxies in the wAGN zone may actually be fake AGN.
The strong excess at m observed in all K+A galaxies (e.g. Figures 5 and 12) imply that they have substantial amounts of hot dust, although we do not know where this dust component is physically located within the galaxies (see below for further discussion). The STARLIGHT extinctions tell us that the dust appears to be well mixed with the gas, and that the intermediate-age population appears to be located in regions of lower dust content. This is consistent with the model of Poggianti & Wu (2000) where A stars migrate out of natal dust clouds, and the simulations of Snyder et al. (2011) where the intermediate age population is revealed as dust is cleared by the AGN episode. We will return to this issue in the following sections when we analyze the ensemble properties of the dust as told by the SEDs.
3.2 Gas-phase metallicities
Before we leave the emission-line spectra of K+A galaxies, it seems relevant to examine whether the metallicities of the nebular component are similar or different to those of the dominant stellar populations.
![[Uncaptioned image]](/html/1301.5325/assets/x12.png)
There are several semi-empirical methods to estimate the metallicities of HII regions for cases (such as ours) where the physical conditions of the ionized gas, and in particular the electron temperatures (), are not well known. The most popular of these methods is the so-called originally introduced by Pagel et al. (1979) and later developed by numerous studies (see e.g. Peña, Peimbert, & Peimbert 2012 for a recent review). This method, however, is not well suited for our objects because it is ill-determined for metal rich nebulae, and because it requires the [OII]3727,29 fluxes (=([OII]+[OIII])/H), which lie in the noisiest parts of our K+A spectra.
Fortunately, other empirical methods using the more benign [OIII]5007 and [NII]6584 lines have been extensively studied in the literature (e.g. Pettini & Pagel 2004 henceforth PP04 and references therein), which are much better suited for our purposes, in particular because they are calibrated on a ‘larger’ (but still 10) sample of metal-rich nebulae. Their calibration of these two proxies for metallicity, N2 = [NII]λ6584/Hα O3N2 = [OIII]λ5007/Hβ[NII]λ6584/Hα together with an extensive review of the literature are presented by PP04 and we refer to that paper for further details. A distinct advantage of both methods is that they are independent of extinction, although in K+A galaxies, the H nebular line is heavily contaminated by the stellar absorption from the A-stars, making it difficult to detect, and rather uncertain when actually detected. We are therefore forced to use H instead, and hence to correct the observed fluxes for extinction.
This issue has been extensively discussed by CFS11, who derived an empirical relation between the nebular extinction, A, estimated from the Balmer decrements in their sample of hundreds of thousands of objects, and the extinction of the stellar spectra A resulting from their STARLIGHT models. CFS11 remark, as we do here, that their empirical relation between A and A (probably) overestimates the nebular extinction, which provided them with a suitable upper limit to the parameter space they were interested in exploring.
The opposite is true in our case where we are interested in a conservative lower limit for O3N2, which in any case does not depend very strongly on extinction. We therefore used the A values from STARLIGHT (without attempting to estimate the nebular component) to correct the observed fluxes for extinction. Following CFS11, we assumed Case B recombination for the Balmer decrement (H/H=2.8), thus, O3N2=log(2.8×[OIII]/[NII]) + 0.12×A^*_V for the CCM extinction law. Figure 2 plots in the top panel O3N2 vs. N2 for those galaxies in our sample with S/N5 in the continuum around H, and EW(H (chosen to minimize contamination by spurious features). The dashed lines shows the limits of and corresponding to nebulae with oxygen abundances 12+log(O/H) larger than solar (from Figs. 1&2 of PP04). PP04 also provide analytical fits to estimate abundances as,
12+log(O/H) = 8.90+0.57×N2 and, 12+log(O/H) = 8.73-0.32×O3N2 shown in the bottom panel of Figure 2. Within the uncertainties discussed above, the overwhelming majority of our K+A galaxies are seen to have nebular oxygen abundances well above the solar value (12+log(O/H)=8.66; P04).
Notwithstanding the known discrepancy between the gas and stellar abundances in the Orion region (which is now narrowed to less than 0.1 dex – Simón-Diaz & Stasinska 2011), we are confident that the ionized gas and the intermediate-age stars in K+A galaxies have similar abundance distributions.
3.3 UV fluxes
Rising far-UV flux in early-type galaxies has been known to exist since the 1970s with the first space UV satellites, and it is now commonly attributed to the presence of hot horizontal branch stars (see O’Connell 1999 for a review). Figure 8 presents the colour-colour diagram commonly used in the literature to capture the broad statistical properties of the ultraviolet SEDs of stars and galaxies. The blue points illustrate the locus of elliptical galaxies in Coma (Smith, Lucey, & Carter, 2012). These data have not been corrected for foreground extinction, which for Amag and the CCM extinction law is represented by the arrow (the foreground extinction to Coma is of course much less than one magnitude).
The red lines delimit the area occupied by HB stars in Galactic globular clusters (GC), adapted from the IUE-based diagram of O’Connell (1999) using the GALEX observations of individual HB stars by Schiavon et al. (2012) to transform from IUE to GALEX, and the standard (g’-V) color of blue stars. The red points show the integrated colours of a sample of Galactic GCs from Dalessandro et al. (2012). Finally, the green star shows the average colours from a sample of 1600 SDSS QSOs at for which we downloaded the relevant data from the GALEX and SDSS archives.
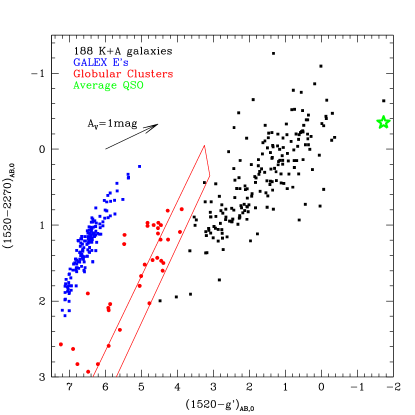
K+A galaxies are not only substantially bluer than passive ellipticals, as expected, but they are also significantly bluer than HB stars in GCs, consistent with the vacuum UV fluxes emerging from Gyr old stars (Kaviraj et al., 2008). K+A’s are however not as blue as QSO’s (green star), which are more than one magnitude bluer than even the bluest galaxies in our sample. There is one galaxy, SDSSJ142257.727+225441.43, however, that has UV colors typical of QSOs. This is actually one of the few galaxies in our sample that falls in the SF region of the WHAN diagram (right panel of Figure 6) and the only one with a significant population of young stars (39.5%). This is also one of the few galaxies in the sample with oxygen abundances lower than solar (Figure 2), fully consistent with its STARLIGHT populations that are dominated by young and intermediate-age metal poor stars, with no traces of an old stellar component. Veron-Cetty & Veron (2006) classify it as a QSO based on the data by Darling & Wegner (1994), but this object shows no broad emission lines and no X-ray detection or radio signal in the FIRST survey. Interestingly, its SED shown in Figure 9 is surprisingly similar to that of average radio-quiet QSOs (e.g. Andreani et al. (2003)), with a prominent mid-IR excess at and a power-law continuum in the blue.
3.4 TP-AGB Stars
Maraston (2005) has suggested that the inclusion of TP-AGB stars in modelling intermediate age populations may dramatically alter their colours, derived ages, and stellar masses. Testing this hypothesis has proved difficult, as these stars contribute most of their light in the infrared that is not easily accessible at high redshifts. However, Tonini et al. (2009) and Tonini et al. (2010) claim that models including TP-AGB stars produce a better match to the colours of distant galaxies, while yielding ages and stellar masses in better agreement with the predictions of theoretical expectations. Milner, Rose & Cecil (2011) obtain a good fit to the (CMD-calibrated) ages of M32 and NGC5102 using indices derived from infrared spectra and models including TP-AGB stars. Eminian et al. (2008) suggest that the infrared colours of star-forming galaxies in the SDSS are better modeled by the Maraston (2005) models including the TP-AGB contribution. Melbourne et al. (2012) claim that TP-AGB stars may contribute as much as 17% of the -band flux in nearby galaxies. However, Kriek et al. (2010) find no evidence that TP-AGB stars are important in their sample of higher redshift post-starburst galaxies, while Zibetti et al. (2012) searched for the spectroscopic indices of TP-AGB stars in 16 z0.2 K+A galaxies and find no strong evidence for their presence. The models by Conroy & Gunn (2010) are in better agreement with the older models by Bruzual & Charlot (2003) and yield a lower contribution from such stars.
Figure 10 displays some of the broad-band colors commonly used in the literature to characterize the SEDs of galaxies. (Notice that several of these colors have been shifted as indicated in the figure legend to minimize overlaps.) For each color we also plot the average color predicted by our best-fit Maraston-mix plus the 300K blackbody (which as discussed above we impose ad hoc to reproduce the observed mid-IR fluxes) shown by the arrows, and the dispersion of these predictions plotted as the horizontal bars on top of each arrow.
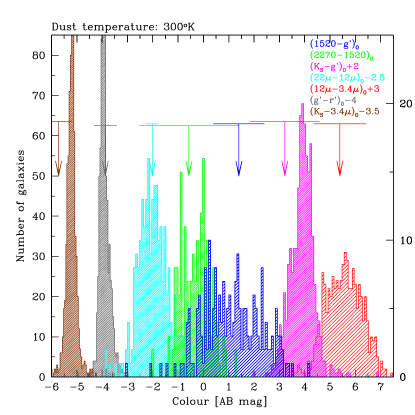
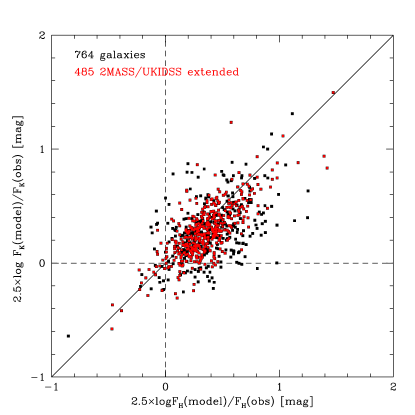
The M05 models are seen in the figure to reproduce remarkably well the FUV to optical colors of K+A galaxies. This demonstrates that the FUV colors of K+A galaxies are bluer than HB stars because the intermediate-age (A) stars are actually quite luminous in the UV. However, the models systematically predict bluer and colors than observed. Figure 11 shows that these discrepancies actually arise because the models overestimate the fluxes in the NIR bands.
As discussed in Section 2, we are confident that our photometric sample is not affected by systematic aperture matching effects. Nevertheless, we have argued that the influence of TP-AGB stars in the near-IR fluxes of high redshift galaxies is a contentious issue, which needs to be treated with extra care. Therefore, in Figure 11 we singled out galaxies classified as extended sources in the 2MASS or UKIDSS catalogues, for which we can be sure that the photometric apertures are ideally matched. The figure shows that extended objects are indistinguishable from the rest of the sample proving that the NIR excess of the models is not due to systematics in the photometry.
Surprisingly, our simplistic MARASTON-mix+BB300K models appear to reproduce remarkably well the mid-iR colors of the sample, indicating that a single-temperature dust component suffices to reproduce the MIR excess in K+A galaxies (but see below).
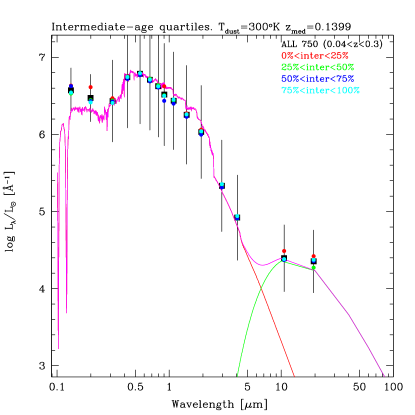
Another way of visualizing the systematic properties of the K+A galaxy SEDs is shown in Figure 12 that presents the averaged SED of K+A galaxies binned in quartiles of the fraction of intermediate-age stars (inter) labelled with different colors. An Ensemble Maraston-mix+BB300K, obtained by averaging the stellar populations of all the galaxies in the sample with redshifts , is seen to overestimate the observed NIR fluxes but underestimate the 3.4 and 4.6 fluxes. This indicates that our models may be too simplistic to fully reproduce the SEDs.
In particular, the discrepancy in the MIR would imply that either the temperature of the hot dust component changes significantly from object-to-object, which would be consistent with the observed dispersion in the WISE colors shown in Fig.10, or that more than one dust component is required to reproduce the observations. However, some of the trends shown by Figure 12 may actually be due to features of the Maraston models for intermediate age stars. These are illustrated in Figure 13 that shows the models averaged for stars between Gyr used in our Maraston-mix, color-coded by metallicity.
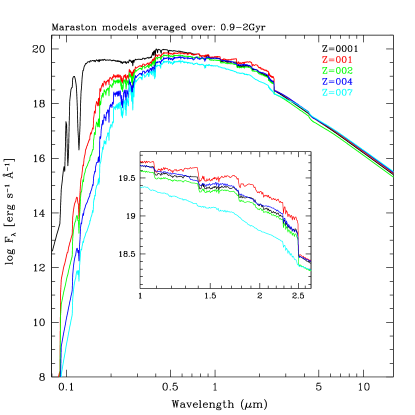
The figure shows that the predicted UV fluxes depend dramatically on metallicity such that at metal poor stars are up to six orders of magnitude more luminous than metal-rich stars. This would predict that galaxies with the highest fractions of (intermediate-age) metal-poor stars should be systematically over-luminous in the UV. Since the models also predict (not shown here) that the UV fluxes of old metal poor stars are much larger than those of old metal-rich stars, reaching up to orders of magnitude at , the UV excess of galaxies with low fractions of intermediate-age stars, represented by the red symbols in Fig.12, could actually be the telltale of HOLMES.
In the NIR (magnified in the figure for clarity) the models also show a significant dependence of metallicity. In particular, for =0.001 and =0.007, which approximately correspond to our metal-poor and metal-rich bins, the metal-poor model is the most luminous in the NIR and shows the strongest molecular bands, while the metal-rich model is the faintest and shows almost no molecular bands. All the other models (including =0.0001) lie in between and are roughly similar to one another.
In the MIR the models systematically underestimate the observations at 3.4 and 4.6 (the point is used to anchor the BB300K component), but the dust temperature cannot be raised too much without compromising the fit at 22. However, the models have a discontinuous step at 2.5, which is a numerical feature introduced to extrapolate the stellar models into the Rayleigh-Jeans regime at MIR wavelengths. As one would expect, this numerical step depends on metallicity, although the =0.001 step is significantly larger than for =0.0001. Figure 13 shows that for stars in our metal-poor bin () the 2.5 step is about 0.5mag, which corresponds almost exactly to the discrepancy between the Ensemble Maraston-mix+BB300K and the observations in the MIR bands.
We must conclude, therefore, that although the models reproduce surprisingly well the FUV-to-optical colors of K+A galaxies, they provide no evidence that TP-AGB stars contribute to the infrared light in these post-starburst galaxies, in agreement with the results of Kriek et al. (2010) and Zibetti et al. (2012). The SDSS spectroscopy and the broad-band SEDs strongly indicate that the older Bruzual & Charlot (2003) and newer Conroy & Gunn (2010) SSP models are adequate and that an increased contribution from TP-AGB stars is not necessary. In turn, this may have important implications for the nature of high redshift galaxies, whose colours and luminosities may then truly reflect their large ages, stellar masses and metallicities (Yan et al., 2004; Cirasuolo et al., 2010).666The new generation of models by Claudia Maraston (private communication) having a smaller 2.5 step will probably provide a better fit in the MIR, but the full models are not yet available for us to check whether they will also provide a better fit in the NIR
3.5 FIR excess
Figure 12 illustrates the fact that all our galaxies show significant excess at MIR wavelengths (in particular and ) compared to the M05 models. We have thus added a Black-Body of K (BB300K) to describe the MIR upturn in the spectra. The temperature of the BB component was defined as discussed in Section 2.3 and the normalization fixed by matching the fluxes as shown in Figure 5. We note here that the cluster objects studied by Dressler et al. (2009) show no significant excess in the MIPS band at 24m, possibly pointing to a real difference between cluster and field K+A galaxies. On the other hand, 6 out of the 18 galaxies they studied in Abell 851 have detectable emission at (rest-frame) 16m, which is consistent with the fraction of K+A galaxies we detect in the reddest WISE band.
There are various possibilities for the source of the mid infrared emission: dusty AGNs, dust enshrouded massive stars and clusters, or circumstellar dust from TP-AGB stars (Kelson & Holden, 2010; Donoso et al., 2012; Chisari & Kelson, 2012). The ‘typical’ -MIR bump observed in K+A galaxies is actually quite similar to the average SED of QSOs, as for example those by Andreani et al. (2003), although the FUV up-turn is significantly steeper in QSOs. Of course the QSO may be so heavily obscured as to depress the UV contribution altogether.
To gain further insight into the source of dust heating in K+A galaxies, Figure 14 shows the MIR excess index (which is also a measure of the dust temperature) plotted as a function of internal extinction, given by STARLIGHT. Note that we also used the STARLIGHT to de-redden the observed fluxes, although we also verified that our main conclusions do not depend on extinction.
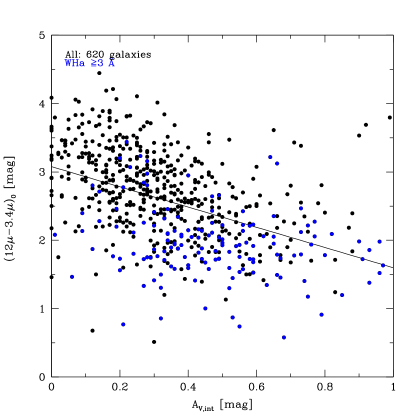

The figure shows a significant correlation between the MIR excess and the extinction seen by the stellar populations. The slope of the correlation is -1.580.006, so the trend is highly statistically significant. The blue points show the galaxies with EW(H3Å, which corresponds (except for just a few SF objects) to the locus of wAGN galaxies. Thus, for a given AV wAGN have more MIR excess than RG. This may be interpreted as evidence that wAGN are enshrouded in dust that is not seen by the dominant stellar populations, and which must be rather hot in order to radiate at .
An important feature of Figure 12 is that on average (black squares) K+A galaxies show a sizable FUV excess relative to the models; The right panel of Figure 14 shows that the UV excess, measured by (), is actually correlated with the temperature of the hot dust component, measured by .777The correlation is actually stronger for () albeit for a much lower number of galaxies
Donoso et al. (2012) argue that excess flux at 12 m may originate from young stars and propose the 4.6-12 color in WISE data as a measure of obscured star formation. Rising far and mid-IR fluxes are observed in obscured massive stars (Whelan et al., 2011) so a plausible interpretation of our results is that K+A galaxies are not truly ‘dead’ but that star formation continues within a dusty starburst. Dusty obscured starbursts have been proposed as the origin of K+A galaxies by Shioya et al. (2001), while limits to on-going star formation have been set by Smail et al. (1999); Miller & Owen (2001); Goto (2004) and Nielsen et al. (2012).
On the other hand, dust heated by AGB stars in circumstellar envelopes may also become quite hot and might explain a mid/far infrared excess, as suggested by Kelson & Holden (2010); Donoso et al. (2012); Chisari & Kelson (2012). Theoretical understanding of this phenomenon does not allow us to fit models but the predictions suggest that the emission would peak at the intermediate ages typical of K+A galaxies.
4 Summary
CFS11 (Cid Fernandes et al., 2011) have commented upon the challenges of conveying the information from large samples of galaxies in an efficient and comprehensible way. Our sample of ‘only’ 808 K+A galaxies pales compared with the mega-studies undertaken by the SEAGal team, but we feel we have faced similar challenges. We have attempted the usual martingales of binning the data, or using plots in technicolor, to convey the ensemble properties of K+A galaxies, but we still feel that it would be useful for the reader to recapitulate here the most important results.
In summarizing these results, we will make an ontological leap of faith and generalize the properties of the 808 galaxies in our sample to K+A galaxies as a whole.
-
1.
K+A galaxies are significantly bluer in the FUV than Horizontal-Branch stars in Globular clusters; The FUV to optical colors of K+A galaxies are well reproduced by the M05 models as mostly arising from the intermediate-age (A) component;
-
2.
The overwhelming majority of K+A galaxies have weak but clearly detectable emission lines. About 75% of K+A galaxies are ‘Retired Galaxies’ where the nebular component is ionized by either intermediate-age stars, or by hot, old, low-mass, evolved stars (HOLMES in the nomenclature of CFS11), or both. The remaining 15% fall in the category of ‘weak AGN’, considered by CFS11 to be genuine AGN;
-
3.
These wAGN have systematically stronger emission lines ([OII], [OIII], H, & [NII]), higher stellar extinction, lower fractions of intermediate-age metal poor stars, higher fractions of old metal poor stars, and higher fractions of young stars;
-
4.
Compared to the M05 models, K+A galaxies do not show the predicted near-IR excess contribution from TP-AGB stars. It is likely that inclusion of these objects, at least at the levels postulated by the models and required to account for the red colors and large masses of high redshift galaxies (Tonini et al., 2009, 2010), is not warranted;
-
5.
At least one hot-dust component is required to reproduce the fluxes at m. The MIR excess correlates with the stellar extinction indicating that at least part of the dust is mixed with the overall stellar populations. At a fixed extinction, wAGN and SF have stronger MIR excess than RG’s indicating hotter dust temperatures.
-
6.
On average K+A galaxies show a significant FUV excess compared to the models. The temperature of the hot dust component (as given by the MIR excess) correlates with the FUV excess, reinforcing our deduction that K+A galaxies host massive dust enshrouded starbursts, which could possibly be the genesis of bulges as recently suggested by Mendel et al. (2012).
Although in the course of this investigation we have learned a great deal about K+A galaxies, we have not provided a definitive answer to the fundamental question of whether K+A galaxies are currently forming stars. We found that the signpost of on-going star formation in these objects is not their blue FUV colors, which are mostly due to the intermediate-age (A) stars, but their MIR excess. In particular, the excess appears to be well correlated with the WHAN type of the galaxies. This is illustrated in Figure 15 that shows the WHAN plot color-coded by the () and () colors. This figure underlines our claim that wAGNs have stronger FUV excesses and hotter dust than RGs, but also, most importantly, that many RGs also share the same properties.
This, and the other ‘technicolor’ figures that we have displayed throughout this paper show that the spectral and photometric properties of K+A galaxies are continuous and not multi-modal, as the WHAN partitioning could lead one to believe. In fact, a comprehensive review of the literature revealed no significant evidence for non-thermal radio or X-ray emission from K+A galaxies. This would support a model for K+A galaxies as having evolved from dusty starbursts in the fashion described by Shioya et al. (2001), which may be continuing in highly obscured regions.
Acknowledgements
We are grateful to Roberto Cid-Fernandes, the father of STARLIGHT, and to André de Amorim for proving us with the STARLIGHT models for our K+A galaxies as well as continuous support in understanding how to use the code. The STARLIGHT project is supported by the Brazilian agencies CNPq, CAPES and FAPES and by the France-Brazil CAPES/Cofecub program.
This research has made use of the NASA/ IPAC Infrared Science Archive, which is operated by the Jet Propulsion Laboratory, California Institute of Technology, under contract with the National Aeronautics and Space Administration.
The initial stages of this publication made use of VOSA (Bayo et al., 2008), developed under the Spanish Virtual Observatory project supported from the Spanish MICINN through grant AyA2008-02156. We are indebted to Amelia Bayo for introducing us to VOSA and for answering our many questions about VOSA.
The entire GALEX Team gratefully acknowledges NASA’s support for construction, operation, and science analysis for the GALEX mission, developed in corporation with the Centre National d’Etudes Spatiales of France and the Korean Ministry of Science and Technology. We acknowledge the dedicated team of engineers, technicians, and administrative staff from JPL/Caltech, Orbital Sciences Corporation, University of California, Berkeley, Laboratoire d’Astrophysique Marseille, and the other institutions who made this mission possible.
Funding for the SDSS and SDSS-II has been provided by the Alfred P. Sloan Foundation, the Participating Institutions, the National Science Foundation, the U.S. Department of Energy, the National Aeronautics and Space Administration, the Japanese Monbukagakusho, the Max Planck Society, and the Higher Education Funding Council for England. The SDSS Web Site is http://www.sdss.org/.
The SDSS is managed by the Astrophysical Research Consortium for the Participating Institutions. The Participating Institutions are the American Museum of Natural History, Astrophysical Institute Potsdam, University of Basel, University of Cambridge, Case Western Reserve University, University of Chicago, Drexel University, Fermilab, the Institute for Advanced Study, the Japan Participation Group, Johns Hopkins University, the Joint Institute for Nuclear Astrophysics, the Kavli Institute for Particle Astrophysics and Cosmology, the Korean Scientist Group, the Chinese Academy of Sciences (LAMOST), Los Alamos National Laboratory, the Max-Planck-Institute for Astronomy (MPIA), the Max-Planck-Institute for Astrophysics (MPA), New Mexico State University, Ohio State University, University of Pittsburgh, University of Portsmouth, Princeton University, the United States Naval Observatory, and the University of Washington.
This publication makes use of data products from the Two Micron All Sky Survey, which is a joint project of the University of Massachusetts and the Infrared Processing and Analysis Center/California Institute of Technology, funded by the National Aeronautics and Space Administration and the National Science Foundation
The UKIDSS project is defined in Lawrence et al. (2007). UKIDSS uses the UKIRT Wide Field Camera WFCAM (Casali et al. 2007). The photometric system is described in Hewett et al. (2006), and the calibration is described in Hodgkin et al. (2008). The pipeline processing and science archive are described in Irwin et al. (2009, in prep) and Hambly et al (2008).
This publication makes use of data products from the Wide-field Infrared Survey Explorer, which is a joint project of the University of California, Los Angeles, and the Jet Propulsion Laboratory/California Institute of Technology, funded by the National Aeronautics and Space Administration.
This research has made use of the NASA/IPAC Extragalactic Database (NED) which is operated by the Jet Propulsion Laboratory, California Institute of Technology, under contract with the National Aeronautics and Space Administration.
References
- Abazajian et al. (2009) Abazajian K. et al. 2009, ApJS, 182, 543
- Andreani et al. (2003) Andreani, P., et al., 2003, AJ, 125, 444.
- Baldry et al. (2006) Baldry I. K., Balogh, M. L., Bower, R. G., Glazebrook, K., Nichol R. C., Bamford S. P., Budavari T 2006, MNRAS, 373, 469
- Bayo et al. (2008) Bayo, A., et al., 2008, A&A 492, 277
- Becker et al. (1995) Becker R. H., White R. L., Helfand D. J. 1995, ApJ, 450, 559
- Bertelli et al. (1994) Bertelli G., Bressan A., Chiosi C., Fagotto F., Nasi E., 1994, A&AS, 106, 275
- Brammer et al. (2009) Brammer G. et al. 2009, ApJ, 706, L173
- Brown et al. (2009) Brown M. J. I. et al. 2009, ApJ, 703, 150
- Bruzual & Charlot (2003) Bruzual, G. & Charlot S., 2003, MNRAS, 344, 1000
- Buyle et al. (2006) Buyle P., Michielsen D., De Rijcke S., Pisano D. J., Dejonghe H., Freeman K. 2006, ApJ, 649, 163
- Cardelli, Clayton, & Mathys (1989) Cardelli J. A, Clayton G. C., and Mathis J. S., 1989, ApJ, 345, 245
- Casali et al. (2007) Casali M. et al. 2007, A&A, 467, 777
- Chabrier (2003) Chabrier, G, 2003, PASP, 115, 763
- Chang et al. (2001) Chang T.-C., van Gorkom J., Zabludoff A. I., Zaristsky D., Mihos J. C. 2001, AJ, 121, 1965
- Chisari & Kelson (2012) Chisari N. E., Kelson D. 2012, ApJ, 753, A94
- Choi et al. (2009) Choi Y., Goto T., Yoon S.-J. 2009, MNRAS, 395, 1776
- Cid Fernandes et al. (2005) Cid Fernandes R., Mateus A., Sodré L., Stasińska G., Gomes J.M., 2005, MNRAS, 358, 363
- Cid Fernandes et al. (2010) Cid Fernandes R., Stasińska G., Schlickmann M. S., Mateus A., Vale Asari N., Schoenell W., Sodré L. 2010, MNRAS, 403, 1036.
- Cid Fernandes et al. (2011) Cid Fernandes R., Stasińska G., Mateus A., Vale Asari N. 2011, MNRAS, 413, 1687.
- Cirasuolo et al. (2010) Cirasuolo M., McLure R. J., Dunlop J. S., Almaini O., Foucaud S., Simpson C. 2010, MNRAS, 401, 1166
- Conroy & Gunn (2010) Conroy C., Gunn J. E. 2010, ApJ, 712, 833
- Couch & Sharples (1987) Couch W. J., Sharples R. M. 1987, MNRAS, 229, 423
- Dalessandro et al. (2012) Dalessandro, E., Schiavon, R.P., Rood, R.T. Ferraro, F.M., Sohn, S.T., Lanzoni, B., O’Connell, R.W., 2012, AJ, 144, 126
- Darling & Wegner (1994) Darling G. W., Wegner G. 1994, AJ, 108, 2025
- Denicoló, Terlevich, & Terlevich (2002) Denicoló, G., Terlevich, R., Terlevich, E., 2002, MNRAS, 330, 69
- Donoso et al. (2012) Donoso E. et al. 2012, ApJ, 748, A80
- Dressler & Gunn (1983) Dressler A., Gunn J. E. 1983, ApJ, 270, 7
- Dressler et al. (2009) Dressler A., Rigby J., Oemler, A., Fritz J., Poggianti B. M.. Rieke G., Bai L. 2009, ApJ, 693, 140
- Duc et al. (2002) Duc P. A. et al. 2002, A&A, 382, 60
- Eminian et al. (2008) Eminian C., Kauffmann G., Charlot S., Wild V., Bruzual G., Rettura A., Loveday J. 2008, MNRAS, 384, 930
- González Delgado & Cid Fernandes (2010) González Delgado R. M, Cid Fernandes, R. 2010, MNRAS, 403, 797
- Goto (2004) Goto T. 2004, A&A, 427, 125
- Goto (2007) Goto T. 2007, MNRAS, 381, 187
- Hambly et al. (2008) Hambly N. et al. 2008, MNRAS, 384, 637
- Heckman (1980) Heckman T. M., 1980, A&A, 87, 142
- Hewett et al. (2006) Hewett P. C., Warren S. J., Leggett S. K., Hodgkin S. T. 2006, MNRAS, 367, 454
- Hodgkin et al. (2009) Hogdkin S. T., Irwin M. J., Hewett P. C., Warren S. J. 2009, MNRAS, 394, 675
- Hopkins et al. (2008) Hopkins P. F., Cox, T. J., Keres D., Hernquist L. 2008, ApJS, 175, 390
- Jarosik et al. (2011) Jarosik N. et al. 2011, ApJS, 192, 14
- Kaviraj et al. (2007) Kaviraj S., Kirkby L. A., Silk J., Sarzi M. 2007, MNRAS, 382, 960
- Kaviraj et al. (2008) Kaviraj S. et al. 2008, MNRAS, 388, 67
- Kelson & Holden (2010) Kelson D., Holden B. P. 2010, ApJ, 713, L28
- Kewley et al. (2006) Kewley, L.J., Groves, B., Kauffnamm, G., Heckman, T., 2006, MNRAS, 372, 961
- Kriek et al. (2010) Kriek M. et al. 2010, ApJ, 722, L64
- Lawrence et al. (2007) Lawrence A. et al. 2007, MNRAS, 379, 1599
- Le Borgne et al. (2003) Le Borgne J.-F. et al. 2003, A&A, 402, 433
- Liu et al. (2007) Liu C. T., Hooper E. J., O’Neil K., Thompson D., Wolf M., Lisker T. 2007, ApJ, 658, L249
- Maraston (2005) Maraston C. 2005, MNRAS, 362, 799
- Melbourne et al. (2012) Melbourne J. et al. 2012, ApJ, 748, A47
- Melnick et al. (2012) Melnick J., Giraud, E., Toledo, I., Selman, Quintana, H., 2012, MNRAS, 427, 47
- Mendel et al. (2012) Mendel J. T., Simard L., Ellison S. L., Patton D. R. 2012, arXiv, 1211.6115
- Miller & Owen (2001) Miller N. A., Owen F. N. 2001, ApJ, 554, L25
- Milner et al. (2011) Milner J. , Rose J. A., Cecil G. 2011, ApJ, 727, L15
- Morrissey et al. (2007) Morrissey P. et al. 2007, ApJS, 173, 682
- Muzzin et al. (2012) Muzzin A. et al. 2012, ApJ, 746, A188
- Nielsen et al. (2012) Nielsen D., Ridgway S., De Propris, R., Goto T. 2012, ApJ 761, L16
- O’Connell (1999) O’Connell, R.W., 1999, ARA&A, 37, 603
- Pettini & Pagel (2004) Pettini, M., Pagel, B.E.J., 2004, MNRAS, 348, L59
- Pagel et al. (1979) Pagel, B. E. J., Edmunds, M. G., Blackwell, D. E., Chun, M. S., Smith, G., 1979, MNRAS, 189, 95
- Peña, Peimbert, & Peimbert (2012) Penña-Guerrero, Peimbert, A., Peimbert, M., 2012, ApJ, 756, L14
- Poggianti & Wu (2000) Poggianti B. M, Wu H. 2000, ApJ, 529, 157
- Pracy et al. (2012) Pracy M. B., Owers M. S., Couch W. J., Kuntschner H., Bekki K., Briggs F., Lah P., Zwaan M. 2012, MNRAS, 420, 2232
- Quintero et al. (2004) Quintero A. D. et al. 2004, ApJ, 602, 190
- Saintonge et al. (2008) Saintonge A., Tran K.-V. H., Holden B. P. 2008, ApJ, 685, L113
- Schiavon et al. (2012) Schiavon, R.P., et al., 2012, AJ, 143, 121.
- Schlafly & Finkelbeiner (2011) Schlafly, E., Finkelbeiner, O., 2011, ApJ, 737, 103
- Shin et al. (2011) Shin M.-S., Strauss M. A., Tojeiro R. 2011, MNRAS, 410, 1583
- Shioya et al. (2001) Shioya Y., Bekki K., Couch W. J. 2001, ApJ, 558, 42
- Skrutskie et al. (2006) Skrutskie M. F. et al. 2006, AJ, 131, 1163
- Smail et al. (1999) Smail I., Morrison G., Gray M. E., Owen F. N., Ivison R. J., Kneib J.-P., Ellis, R. S. 1999, ApJ, 525, 609
- Smith, Lucey, & Carter (2012) Smith R.J., Lucey J.R., Carter D., 2012, MNRAS, 421, 2982
- Simón-Diaz & Stasinska (2011) Simón-Diaz, S, Stasinska, G.,. 2011, A&A, 526, A48
- Snyder et al. (2011) Snyder G. F., Cox T. J., Hayward C. C., Hernquist L., Jonsson P. 2011, ApJ, 741, A77
- Stasinska et al. (2008) Stasinska, G., Vale Asari, N., Cid Fernandes, R., Gomes, J. M., Schlickmann, M., Mateus, A., Schoenell, W., Sodr , L., Jr., 2008, MNRAS, 391, 29L
- Strateva et al. (2001) Strateva I. et al. 2001, AJ, 122, 1861
- Terlevich & Melnick (1985) Terlevich, R.J., Melnick, J., 1985, MNRAS, 213, 841
- Tonini et al. (2009) Tonini C., Maraston C., Devriendt J., Thomas D., Silk J. 2009, MNRAS, 396, L36
- Tonini et al. (2010) Tonini C., Maraston C., Thomas D., Devriendt J., Silk J. 2010, MNRAS, 403, 1749
- Vergani et al. (2010) Vergani S. D. et al. 2010, A&A, 509, A42
- Veron-Cetty & Veron (2006) Veron-Cetty M.-P., Veron P. 2006, A&A, 455, 773
- Whelan et al. (2011) Whelan D. G., Johnson K. E., Whitney B. A., Indebetouw R., Wood K. 2011, ApJ, 729, A111
- Wright et al. (2010) Wright E. L. et al. 2010, AJ, 140, 1868
- Yamauchi et al. (2008) Yamauchi C., Yagi M., Goto T. 2008, MNRAS, 390, 383
- Yan et al. (2004) Yan H. et al. 2004, ApJ, 616, 63
- Yang et al. (2008) Yang Y., Zabludoff A.,I., Zaritsky D., Mihos, J.C., ApJ, 688, 945
- Zibetti et al. (2012) Zibetti S., Gallazzi A., Charlot S., Pierini D., Pasquali A. 2012, arXiv, 1205.4717