TOP QUARK POLARIZATION AND THE SEARCH FOR NEW PHYSICS aaaArgonne preprint ANL-HEP-CP-12-87. Invited paper presented at Beyond the Standard Model of Particle Physics, Quy Nhon, Vietnam, July 15 – 21, 2012. To appear in the Proceedings.
Forward-backward asymmetries and are observed in the top quark rapidity distribution and in the rapidity distribution of charged leptons from top quark decay at the Tevatron proton-antiproton collider, and a charge asymmetry is seen in proton-proton collisions at the Large Hadron Collider (LHC). In this presentation, I summarize research my collaborators and I have done on the interpretation and implications of the Tevatron asymmetries and provide expectations for at the LHC. The two asymmetries and are connected through the spin correlation between the charged lepton and the top quark with different polarization states. The ratio of the two asymmetries provides independent insight into the physics interpretation of the top quark asymmetry. A new physics model which produces more right-handed than left-handed top quarks appears to be indicated by the present Tevatron data, but an improvement in precision is desirable.
1 Introduction
The large mass of the top quark, of order the electroweak scale, suggests that the top quark may be sensitive to electroweak symmetry breaking and to physics beyond-the-standard model. Experimentally, the observation of a larger than expected forward-backward asymmetry in the rapidity of top quarks produced at the Fermilab Tevatron collider continues to hold considerable attention. The asymmetry is defined as
| (1) |
where is the difference between the rapidities of the top quark and the anti-top quark, and () is the number of events with (). The proton beam is chosen as the direction of positive . In the standard model (SM), the asymmetry is induced by perturbative quantum chromodynamics (QCD) processes beyond the leading order.
The enhanced asymmetry is one of few manifestations of a deviation from predictions of the SM. Many models of new physics (NP) have been proposed to explain the data. A lengthly list of references and a discussion of constraints on these models may be found in Berger et al. and in Cvetic et al. . Some of the NP models postulate the existence of new states with right-handed couplings of the top quark.
The large mass of the top quark is important in another respect. Its short lifetime means that the top quark decays as a “bare” quark. Its polarization information is retained in the weak decay , passed to its decay products. The lepton angular distribution in the top quark rest frame is maximally correlated with the top quark spin orientation, providing the opportunity to test non-standard features of NP models such as right-handed couplings. Another method to measure the polarization is based on the lepton momentum distribution and is valuable for use with complex final states in which the top quark rest frame is hard to determine. Of particular interest to us have been the implications of models of new physics for the polarization of the top quark, and methods that can be used to measure the polarization . In the SM, strong production of pairs in quantum chromodynamics (QCD) yields an equal number of positive and negative helicity top quarks, hereafter referred to as and . Electroweak production in single top quark production, for example, yields primarily . Therefore, a demonstration that a significant fraction of top quarks are produced with positive helicity would herald new physics.
In addition to of the top quark, the D0 group reports a positive forward-backward asymmetry of charged leptons from top quark decays. The measurement is done in two ways , both based on data corresponding to an integrated luminosity of . The value is measured in the +jets final states . The second method uses the dilepton final states from production, where the bosons from the and decays both decay leptonically, and the result obtained is %. A combination of the two measurements yields . The combined result may be compared with the values from simulations of the SM or once QCD+EW corrections are included , an excess at the level of 2.2 standard deviations. The fact that and are larger than the SM predictions indicates that the charged lepton strongly prefers to move in the same direction as the top quark from which it originates. Data on the ratio of the two asymmetries tend to favor models in which more than are produced , but confirmation with greater statistical and systematic precision is desirable.
In Sec. 2 the asymmetries measured at the Tevatron are defined and our fits in the framework of , , and axigluon new physics models are discussed. The LHC proton-proton collider offers no preferred direction for the measurement a rapidity asymmetry. Nevertheless, charge asymmetries for top quarks and for leptons can be defined and computed. Using data from the Tevatron, we may obtain expectations for these charge asymmetries, and we compare these expectations with LHC data in Sec. 3. Despite limited statistics, the LHC data on the charge asymmetry are also consistent with a deviation from the SM, although perhaps not as great a deviation as expected from an extrapolation of the Tevatron observations.
The relationship of and is addressed in Sec. 4. The essential starting point is the structure of the matrix element for the decay . We pay particular attention to the positive/negative helicity state of the top quark because the final momentum and angular distributions of leptons in the laboratory frame depend significantly on the top quark’s polarization state. We derive the relationship of the lepton asymmetry and the top quark asymmetry separately for the left- and right-handed polarization states of the top quark. Different models of new physics produce top quarks with different proportions of left- and right-handed polarization. For example, models produce predominantly right-handed top quarks, whereas the axigluon model generates unpolarized top quarks. We use an axigluon model and a model in Sec. 4 to illustrate their different expectations for the ratio of the lepton and top quark asymmetries.
2 Tevatron Data and Interpretations
In Berger et al. , we present fits for three models: flavor-changing exchange, flavor-changing exchange, and axigluon models. The minimal version of the model implies a large rate for same-sign top quark pair production at the LHC, not supported by data . The model is constrained by data on the plus jets final state at the LHC . The absence of pronounced deviations from the SM expectation in the measured invariant mass distribution indicates to us that the axigluon should be heavy and/or broad. Another possibility would be to place it below threshold .
We fit data at the Tevatron to determine the parameters of the three new physics models. under consideration. We scan the parameter space of the models requiring that the predictions fit the total cross section as well as CDF data on for both and within accuracy.
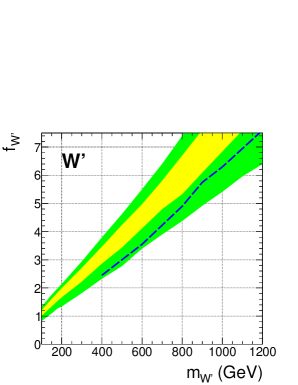
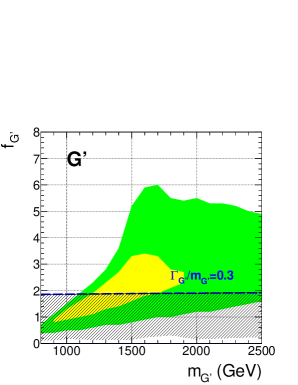
Figure 1 shows the results of our fits for two of the models. The fit for the model may be found in Berger et al. . There is a large region of parameter space in which the model can fit the Tevatron data within and . However, the region above the blue dashed curve is not allowed since too many events would be produced. In the axigluon case, to achieve good agreement with data at the level, the mass of axigluon is required to be in the range of about to . For other axigluon masses, the model can only fit data at the level. Also shown are some bounds on axigluon masses and couplings obtained from a search for resonances in the dijet invariant mass distribution .
3 LHC Data and Expectations
The LHC proton-proton collider is symmetric in rapidity, and it is ambiguous to define a forward or backward region. However, the and parton densities carry, on average, a larger fraction of the momentum of the proton than the and antiquark densities. With the knowledge that there is a forward-backward asymmetry in the perturbative production process for production, we expect that the top quark at the LHC will be boosted in the direction of the incident quark. As a result, top quarks should accumulate in the region of large rapidity and anti-top quarks will be preferentially in the central region. An asymmetry may be defined at the LHC as
| (2) |
Measurements of at the LHC have been published by the CMS and ATLAS collaborations based on data sets with of integrated luminosity . The ATLAS central value is an order of magnitude larger than the CMS value, but they agree within the large uncertainties in both experiments, and they are consistent with the SM prediction.
At the Tevatron, production is driven by the quark-antiquark initial state parton densities, whereas at the LHC, it is dominated by the gluon-gluon initial state which provides no asymmetry. The overall asymmetry is therefore expected to be diluted substantially at the LHC. An approximate estimate for the LHC asymmetry may be obtained by an extrapolation from the Tevatron result:
| (3) |
The first term represents the fraction of the top-quark pair production cross section induced by the initial state which is about in the SM at the LHC at 7 TeV. The second term is the asymmetry induced by the initial state. Given that about of the production cross section in the SM comes from the initial state at the Tevatron, can be extracted from the top quark forward-backward asymmetry observed at the Tevatron; we use , where is the measured top quark asymmetry. The last term in Eq. (3) represents the probability of correct identification of the forward direction, namely how frequently the forward direction represents the direction of the initial state quark. This probability is evaluated in Bergeret al. for both the Tevatron and the LHC.
Combining all terms, we expect that , where is the value measured at the Tevatron. With , an extrapolation from the Tevatron provides a model independent estimate for the LHC of , in reasonable agreement with the central value of the ATLAS measurement but in excess of the central value of the CMS measurement. Setting aside for the moment the still large uncertainties of the LHC data, the agreement of the ATLAS measurement with our extrapolation lends credence to the suggestion that new physics contributions are playing a role in the asymmetry measured at the Tevatron. On the other hand, there is evident tension between the Tevatron asymmetry and the central value of the CMS measurement.
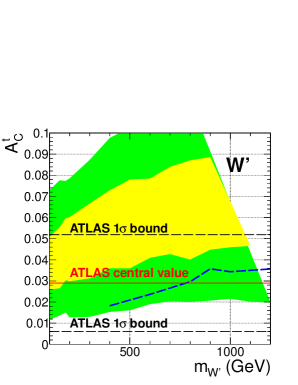
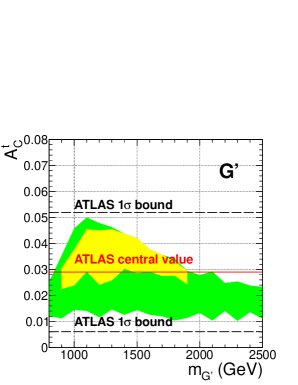
The extrapolation from the Tevatron is admittedly rough as it ignores possibly subtle energy-dependent effects and cancellations between SM and new physics contributions. Turning next to the explicit new physics models discussed in the previous section, we use the allowed parameters for the flavor-changing and axigluon models shown in Fig. 1 and calculate at the LHC. The results are shown in Fig. 2, along with a comparison to the ATLAS data. To obtain the ATLAS predictions we use for the SM prediction, as done by ATLAS. For the CMS comparison, we use the SM value adopted by CMS. The CMS comparison may be found in Berger et al. .
Most of the values of predicted in the model are larger than the ATLAS central value, but they are within the uncertainty band. For the axigluon model, all of the predictions of agree with the ATLAS result within the level. In the axigluon model does not simply increase with the axigluon coupling to SM particles. For , reaches its maximum at about , with coupling . Therefore, the upper boundary of the yellow region (couplings that fit Tevatron data within ) overlaps the green region (couplings that fit Tevatron data within ) for some . The model predicts smaller values of than the model because there is a change of the sign of the s-channel propagator. When the invariant mass of the system is larger than the mass of the axigluon, the contribution to from the interference term is negative. When comparing with the CMS data, we find in Berger et al. that the predicted values of are outside of the band. Unless the central value increases in updated measurements, the CMS data disagree with the simplest new physics models based on or axigluon contributions.
4 The relationship of and
The top quark is the only quark that decays quickly, before hadronization takes place, and its polarization determines the kinematic distribution of its final state decay particles. Therefore, it should be possible to understand the relationship of and based on the kinematics of the charged lepton in the decay of a top quark with different polarization states.
The charged lepton in top quark decay is a powerful analyzer of the polarization of the top quark . Owing to the structure of the charged current in the SM, the angular distribution of a charged lepton from top quark decay () in the top quark rest frame is
| (4) |
where denotes the top quark helicity, and is the angle of with respect to the direction of motion of the top quark in the overall center-of-mass system of the production process. We use the helicity basis in our calculations; denotes a right-handed top quark (), and a left-handed top quark (). Once the top quark is boosted along its spin direction, the angular distribution of the charged lepton relative to the direction of motion of the top quark deviates from , and it becomes sensitive to the energy of the top quark (or equivalently its velocity ). We derive
| (5) |
where , , and is the angle between the charged lepton and the direction of motion of its parent top quark.
To obtain the forward-backward asymmetry in the laboratory frame, we must rotate the angular distribution in Eq. 5 from the top quark direction of motion to the laboratory coordinate axes. We use a function to represent the probability that a lepton with positive charge lands in the forward region when it originates from a top quark with velocity , rapidity , and polarization . Formally,
| (6) |
where () denotes the number of leptons in the forward (backward) region in the laboratory. Moreover,
| (7) |
It is noteworthy that an explicit analytic expression can be obtained in closed form for in the laboratory frame. The derivation is somewhat lengthy, and it is presented in the Appendix of Berger et al. .
The functions in Eq. 6 and in Eq. 7 are functions of the top quark momentum. To obtain the numbers of leptons in the forward and backward regions, we must convolve with the top quark momentum spectrum, i.e.
| (8) | |||||
| (9) | |||||
| (10) |
where labels the differential production cross section for a top quark with specific kinematics (, , ), and stands for the total production cross section.
The observed positive top-quark asymmetry indicates that more top quarks are produced in the forward region than in the backward region of rapidity. Both and can generate a positive lepton asymmetry from a positive . However, a would need a large boost along the proton beam line (i.e. in the large forward rapidity region) to overcome the fact that most of the charged leptons from its decay move against it in its rest frame. A right-handed top quark can yield a positive even for top quarks near the threshold region. Therefore, the large positive top quark and lepton asymmetries and observed by the D0 collaboration indicate that the top quark polarization and the kinematics of the top quarks, and , may be playing a non-trivial role.
The correlation between the charged lepton asymmetry and the top quark asymmetry is significantly different for different polarization states of the top quark, and it may therefore shed light on the nature of the physics that causes the forward-backward asymmetries at the Tevatron. We choose the and axigluon models as two reference models to examine the correlation at the Tevatron and the LHC.
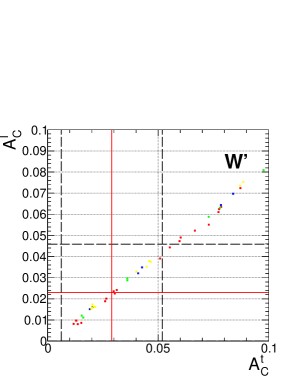
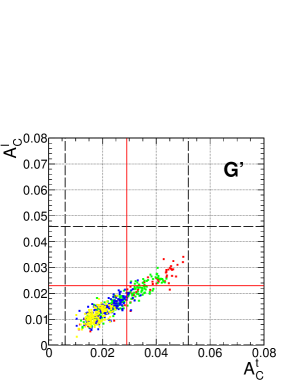
The axigluon and models admit good fits to at the Tevatron, but they provide distinct predictions for the polarization and kinematics of the final state top quark. The model produces dominantly while the axigluon model generates an equal number of and with more energetic top quarks since the quarks come from the decay of a heavy axigluon. In Fig. 3, we show the results of our calculation of the charged lepton asymmetry at the LHC using the parameters determined in our fits to the total cross section and the most recent CDF data on . Figure 3 shows charged lepton asymmetry for the LHC together with the top quark charge asymmetry . The results for the Tevatron are shown in Berger et al. . There are vertical red lines in Fig. 3 at to show the central values of the asymmetries measured by ATLAS, and two black dashed lines show the extent of the quoted experimental uncertainty bands. The horizontal red line shows the central value of measured by ATLAS, and the horizontal black dashed lines show the uncertainty values.
The predicted charged lepton asymmetries stretch out over a range of values depending on the values of the axigluon or masses used in the fits to the Tevatron data. At the LHC, there are parameters in both models (obtained from the Tevatron fits) that can reproduce the values of and measured by ATLAS, shown by the fact that the intersection of the vertical and horizontal red lines passes through the scattering of dots. On the other hand, there is a wide range of dots in the model that are above the central values of and , and out of the uncertainty band. In the axigluon model, all the values of and are consistent with ATLAS measurements within the bands. The LHC and Tevatron data together could reduce the allowed parameter spaces of the two models.
The size of the top quark asymmetry, in excess of SM expectations, is one indication that new physics may be playing a role. The charged lepton asymmetry provides a second and independent indication of the presence of new physics since it points to the possibility that more right- than left-handed top quarks are being produced. It is important to confirm the charged lepton asymmetry. This goal could be realized with an analysis of the full data set in D0. It would be valuable also to have a measurement of the charged lepton asymmetry from the CDF collaboration.
Acknowledgments
The work reported here was done in collaboration with Qing-Hong Cao, Chuan-Ren Chen, and Hao Zhang. The High Energy Physics Division at Argonne is supported by the U.S. DOE under Grant No. DE-AC02-06CH11357.
I am pleased to commend Marc Besancon for his very professional and self-effacing organization of the excellent scientific program of this conference on Beyond the Standard Model of Particle Physics in Quy Nhon, Vietnam in July 2012. I am glad to have had this opportunity to make his acquaintance.
This conference was the most recent in of the “Rencontres du Vietnam” series established by Jean Tran Thanh Van. Van has contributed much over the years to fostering international scientific collaboration, and to facilitating interactions among experimenters and theorists, through his establishment of the ongoing “Rencontres de Moriond” series begun in 1966 and the “Rencontres de Blois” series started in 1989. During this visit to Vietnam, conference participants had the opportunity to learn first-hand of the ambitious International Center for Interdisciplinary Science and Education that he is creating in Quy Nhon, Vietnam and to visit the sea-side construction site. Once operational, the intent is that the Center will host high-level national, regional, and international meetings in basic and applied science, medicine, the humanities, and social sciences.
References
References
- [1] T. Aaltonen et al. [CDF Collaboration], Phys. Rev. D 83, 112003 (2011) [arXiv:1101.0034 [hep-ex]].
- [2] V. M. Abazov et al. [D0 Collaboration], Phys. Rev. D 84, 112005 (2011) [arXiv:1107.4995 [hep-ex]].
- [3] E. L. Berger, Q. -H. Cao, C. -R. Chen and H. Zhang, arXiv:1209.4899 [hep-ph].
- [4] M. Cvetic, J. Halverson and P. Langacker, arXiv:1209.2741 [hep-ph].
- [5] E. L. Berger, Q. -H. Cao, J. -H. Yu and H. Zhang, Phys. Rev. Lett. 109, 152004 (2012) [arXiv:1207.1101 [hep-ph]].
- [6] V. M. Abazov et al. [D0 Collaboration], arXiv:1207.0364 [hep-ex].
- [7] W. Bernreuther and Z. -G. Si, Nucl. Phys. B 837, 90 (2010) [arXiv:1003.3926 [hep-ph]]; J. A. Aguilar-Saavedra, W. Bernreuther and Z. -G. Si, arXiv:1209.6352 [hep-ph].
- [8] E. L. Berger, Q. -H. Cao, C. -R. Chen, J. -H. Yu and H. Zhang, Phys. Rev. Lett. 108, 072002 (2012) [arXiv:1201.1790 [hep-ph]].
- [9] E. L. Berger, Q. -H. Cao, C. -R. Chen, C. S. Li and H. Zhang, Phys. Rev. Lett. 106, 201801 (2011) [arXiv:1101.5625 [hep-ph]].
- [10] G. Aad et al. [ATLAS Collaboration], JHEP 1204, 069 (2012) [arXiv:1202.5520 [hep-ex]].
- [11] S. Chatrchyan et al. [CMS Collaboration], JHEP 1208, 110 (2012) [arXiv:1205.3933 [hep-ex]].
- [12] S. Chatrchyan et al. [CMS Collaboration], Phys. Lett. B 717, 351 (2012) [arXiv:1206.3921 [hep-ex]].
- [13] S. Knapen, Y. Zhao and M. J. Strassler, Phys. Rev. D 86, 014013 (2012) [arXiv:1111.5857 [hep-ph]].
- [14] D. Duffty, Z. Sullivan and H. Zhang, Phys. Rev. D 85, 094027 (2012) [arXiv:1203.4489 [hep-ph]].
- [15] C. Gross, G. M. Tavares, C. Spethmann and M. Schmaltz, arXiv:1209.6375 [hep-ph].
- [16] G. Aad et al. [ATLAS Collaboration], New J. Phys. 13, 053044 (2011) [arXiv:1103.3864 [hep-ex]].
- [17] S. Chatrchyan et al. [CMS Collaboration], CMS-PAS-TOP-11-030 (2012).
- [18] G. Aad et al. [ATLAS Collaboration], ATLAS-CONF-2012-057 (2012).
- [19] G. Mahlon and S. J. Parke, Phys. Rev. D 81, 074024 (2010) [arXiv:1001.3422 [hep-ph]].