A Kine-Chemical Investigation of the AB Dor Moving Group “Stream”
Abstract
The AB Dor Moving Group consists of a “nucleus” of 10 stars at 20 pc, along with dozens of purported “stream” members distributed across the sky. We perform a chemical and kinematic analysis of a subsample of AB Dor stream stars to test whether they constitute a physical stellar group. We use the NEMO Galactic kinematic code to investigate the orbits of the stream members, and perform a chemical abundance analysis using high resolution spectra taken with the Magellan Clay 6.5-m telescope. Using a test with the measured abundances for 10 different elements, we find that only half of the purported AB Dor stream members could possibly constitute a statistically chemically homogeneous sample. Some stream members with 3D velocities were hundreds of parsecs from the AB Dor nucleus 108 yr ago, and hence were unlikely to share a common origin. We conclude that the published lists of AB Dor moving group stream members are unlikely to represent the dispersed remnant of a single star formation episode. A subsample of the stream stars appears to be both statistically chemically homogeneous and in the vicinity of the AB Dor nucleus at birth. Their mean metallicity is [Fe/H] = 0.02 0.02 dex, which we consider representative for the AB Dor group. Finally, we report a strong lower limit on the age of the AB Dor nucleus of 110 Myr based on the pre-MS contraction times for K-type members which have reached the main sequence.
1 Introduction
It has long been recognized that the solar neighborhood contains a population of young stars with ages and velocities similar to the Pleiades, including the famous star AB Dor (e.g. Jeffries, 1995). More recently, Zuckerman et al. (2004) identified a concentration of stars associated with AB Dor at 20 pc of apparently similar age and velocity. Using galactic 3D space velocities and youth indicators such as H emission, strong Li absorption, strong X-ray emission, fast rotation, and color-magnitude diagram position, they identified 37 candidate member systems of the “AB Dor Moving Group”, 9 of which appear to comprise a “nucleus,” including AB Dor itself. A detailed examination of the age indicators for AB Dor and its group members by Luhman et al. (2005) convincingly demonstrated that the color-magnitude diagram and Li depletion pattern for the group is suggestive of coevality with the Pleiades open cluster (hence a probable age of 125 Myr). In the years since, additional members of the AB Dor moving group have been proposed (Torres et al., 2008; Viana Almeida et al., 2009; Schlieder et al., 2010; Zuckerman et al., 2011). da Silva et al. (2009) have tested the membership of these stars, and proposed new members, using an iterative method involving the proximity of candidate stars to each other in UVWXYZ space and to an adopted isochrone in absolute visual magnitude (see also Torres et al., 2006).
If the stars in a moving group are to have shared a common origin, then like open clusters, they should exhibit not only similar space velocity, but also similar chemical composition. De Silva et al. (2007a) and Bubar & King (2010) examined the HR 1614 and Wolf 630 moving groups, respectively, and have shown that using kinematics alone to group stars can be unreliable. These studies found that stars previously identified as group members based solely on their kinematics did not match the abundance patterns exhibited by the other stars in the group. Moving groups such as these with larger velocity spread (usually called “superclusters”) are now believed to be created by dynamical perturbations caused by, e.g., the Galactic bar. They clearly have a wide ranges of ages (Famaey et al., 2008; Bovy & Hogg, 2010), and hence are not useful samples for age-related studies of stars. When adopting ages for stars based on their membership to a kinematic group, it is important to know whether the group is consistent with being co-eval and co-chemical.
Considering the utility of moving groups for understanding galactic kinematic and chemical evolution, and their interest as targets for planet imaging and circumstellar disk evolution surveys, we have started a project to “chemically tag” some of the young, nearby stellar groups. In this contribution, we test whether purported members of the AB Dor moving group could have a shared origin. We present a detailed kinematic and spectroscopic study of 10 stars identified by Torres et al. (2008) and da Silva et al. (2009) as AB Dor members. These authors have already demonstrated that these stars have Li abundances consistent with other AB Dor members, so we do not discuss Li further. The 10 stars are a subsample of the “stream” members with low projected rotational velocity ( sin 20 km s-1) that are outside of the “nucleus” identified by Zuckerman et al. (2004).
2 Observations and Reduction
High resolution optical echelle spectra of the AB Dor stream stars listed in Table 1 were obtained on the nights of June 25-26, 2010 with the MIKE spectrograph at the 6.5m Clay telescope at Las Campanas Observatory. Data was reduced using standard procedures in the IRAF echelle package. These include bias correction, flat fielding, scattered light removal and wavelength calibration. The tilted slits were dealt with using the IRAF mtools package. In order to assure measurement of clean, unblended spectral features, we limited our abundance analysis to the red CCD, therefore the resultant spectra have wavelength coverage from 4850-8500 Å, with a resolution of R 60,000 and typical S/N 200-300 per res. element. For reference, our analysis was carried out with respect to an extremely high S/N solar spectrum from reflected light from the asteroid Ceres, measured with the same telescope and setup.
3 Analysis
3.1 Spectroscopic Analysis
We followed a standard excitation/ionization balance approach to determine basic physical parameters from our stellar spectra (Bubar & King, 2010). For our initial guesses of these parameters, we used photometric temperatures using the calibrations of Casagrande et al. (2010) and gravities from the tracks of Baraffe et al. (1998). Our input metallicity was assumed to be solar, and we calculated using equation 2 from Allende Prieto et al. (2004).
The largest sources of error in our abundances were uncertainties in the final physical parameters and uncertainties in the line measurements themselves. Other sources of error, such as the log() values used in the line lists are eliminated (to first order) by our use of a differential abundance analysis. Uncertainties in and the other physical parameters of each star were found using the method described in Bubar & King (2010). Because this method gave us unrealistically large uncertainties in log(), we adopted the log() uncertainties using the Baraffe et al. (1998) evolutionary tracks. The physical parameters are given in Table 1. In addition, we include measurements of the equivalent widths of the lithium doublet at 6707Å. Our measurements agree with those from da Silva et al. (2009).
We also measured lines of Na I, Mg I, Al I, Si I, Ca I, Cr I, Mn I, Ni I, and Ba II. Using the temperature, gravity, microturbulence, and metallicity solution for each star, we determined the abundances relative to the Sun, line by line. We used the mean abundance as our final value for each element and the standard error of the different line abundances as our uncertainty. When a single line was available, we adopted a conservative uncertainty of 0.10 dex. If more than one line was available, but all lines gave the same value (standard error of 0), we adopted a conservative uncertainty of 0.05 dex. The abundances are listed in Table 2.
| Photometric | Spectroscopic | Activity | |||||||
|---|---|---|---|---|---|---|---|---|---|
| Teff | log() | Teff | log() | EW(Li) | log(Lx/L | EW(H) | |||
| Star | (K) | (dex) | (km s-1) | (K) | (dex) | (km s-1) | (mÅ) | (dex) | (Å) |
| BD -03 4778 | 5045102 | 4.470.08 | 1.110.04 | 522065 | 4.310.08 | 1.800.11 | 261 | -3.38 | -4.46 |
| HD 6569 | 508087 | 4.600.07 | 1.100.03 | 517059 | 4.610.07 | 1.370.12 | 141 | -3.79 | -3.36 |
| HD 189285 | 5685119 | 4.320.07 | 1.400.06 | 553756 | 4.460.07 | 1.510.09 | 136 | -3.86 | -0.58 |
| HD 199058 | 564793 | 4.200.05 | 1.430.05 | 573771 | 4.620.05 | 1.050.12 | 152 | -3.93 | -0.48 |
| HD 207278 | 5615101 | 4.450.06 | 1.320.04 | 571060 | 4.560.06 | 1.700.10 | 188 | -3.96 | -0.63 |
| HD 217343 | 576199 | 4.430.06 | 1.380.04 | 583059 | 4.590.06 | 1.700.10 | 165 | -4.12 | -0.90 |
| HD 218860A | 548891 | 4.540.07 | 1.240.04 | 554349 | 4.590.07 | 1.450.08 | 216 | -3.61 | 0.40 |
| HD 224228 | 487679 | 4.630.06 | 1.030.02 | 495352 | 4.560.06 | 1.110.13 | 70 | -4.36 | -3.02 |
| HD 317617 | 4570142 | 4.500.10 | 0.940.05 | 487063 | 4.490.10 | 1.100.15 | 109 | -3.92 | 0.19 |
| TYC 486-4943-1 | 4680271 | 516081 | 4.870.10 | 2.500.21 | 178 | -3.12 | -6.64 | ||
Note. — EW(Li) is the equivalent width of the Li I doublet feature at 6707Å. EW(H) is the residual chromospheric H emission measured by subtracting a template spectrum of an inactive star of similar Teff and approximately solar composition (see §4).
| Star | [Na/H] | [Mg/H] | [Al/H] | [Si/H] | [Ca/H] | [Cr/H] | [Mn/H] | [Ni/H] | [Ba/H] | [Fe/H] |
|---|---|---|---|---|---|---|---|---|---|---|
| BD -03 4778 | -0.03(5) | -0.16(6) | -0.05(4) | -0.15(3) | 0.06(4) | 0.10(6) | -0.14(2) | -0.18(2) | 0.03(3) | -0.09(4) |
| HD 6569 | -0.05(5) | -0.02(6) | 0.01(2) | -0.04(3) | 0.04(2) | 0.20(2) | 0.02(3) | 0.00(3) | 0.22(2) | 0.06(3) |
| HD 189285 | -0.12(5) | -0.11(7) | -0.05(3) | -0.07(3) | 0.03(3) | 0.00(10) | -0.12(2) | -0.12(3) | 0.11(1) | -0.03(4) |
| HD 199058 | -0.08(3) | -0.15(12) | -0.14(1) | -0.06(3) | 0.01(4) | 0.00(10) | -0.09(4) | -0.13(2) | 0.19(2) | -0.03(5) |
| HD 207278 | 0.01(2) | -0.14(10) | 0.01(3) | 0.02(4) | 0.09(3) | 0.18(15) | -0.07(1) | -0.06(2) | 0.25(3) | 0.02(5) |
| HD 217343 | -0.08(4) | -0.15(4) | 0.08(10) | -0.04(3) | -0.01(3) | 0.17(18) | -0.18(4) | -0.11(3) | 0.18(3) | -0.04(4) |
| HD 218860A | -0.06(4) | 0.00(8) | 0.02(6) | 0.02(2) | 0.09(4) | 0.14(5) | -0.01(3) | -0.02(2) | 0.26(2) | 0.05(3) |
| HD 224228 | -0.08(8) | -0.12(3) | -0.14(10) | -0.09(3) | 0.07(8) | 0.07(1) | -0.04(1) | -0.09(2) | 0.12(2) | -0.04(3) |
| HD 317617 | 0.01(9) | -0.04(7) | -0.04(4) | -0.10(3) | 0.11(9) | 0.10(5) | -0.09(1) | -0.08(1) | 0.10(5) | -0.03(3) |
| TYC 486-4943-1 | 0.05(10) | 0.07(2) | -0.39(9) | 0.04(8) | 0.06(7) | -0.14(1) | -0.12(5) | 0.00(5) | -0.10(5) |
Note. — Values in parentheses are 1 uncertainties in final digits. A recent study by D’Orazi et al. (2012) measured [BaII/Fe] = 0.100.15 dex for HD 189285 (TYC 5155-1500-1), and [BaII/Fe] = 0.200.15 dex and HD 218860 (HIP 114530), consistent with the supersolar [Ba/H] values that we measured.
3.2 Kinematics
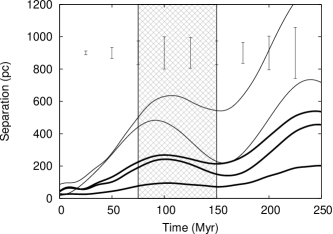
For 5 of the 10 stars we studied spectroscopically, we calculated 3D velocities using published astrometry and radial velocities and the matrices of Johnson & Soderblom (1987). The other 5 stars are lacking Hipparcos trigonometric parallaxes (van Leeuwen, 2007). The velocities111We follow the usual convention where U is the velocity towards the galactic center, V is the velocity in the direction of galactic rotation, and W is the velocity in the z-direction out of the galactic plane. and references are summarized in Table 3. We also include the mean velocity of the AB Dor nucleus stars as calculated by Mamajek (2010) and Mamajek (in prep.) which combines astrometry from van Leeuwen (2007) with the radial velocities of Gontcharov (2006) for the AB Dor nucleus members from Zuckerman et al. (2004). Mamajek (2010) and Mamajek (in prep.) estimate the mean velocity of the AB Dor nucleus to be (U, V, W) = (-7.6 0.4, 27.3 1.1, -14.9 0.3) with a 1D velocity dispersion of 1.0 0.4 km s-1. We then used the software package NEMO (Teuben, 1995) and the Galactic potential (model 2) of Dehnen & Binney (1998) to calculate the past orbits of our stream stars, and their separations from the nucleus as a function of time over the past 250 Myr (roughly twice the likely age). Though our stars are currently within tens of pc of the nucleus, they disperse in the past, and two are 400 pc away from the AB Dor nucleus for any reasonable published estimate of its age (see Fig. 1). If the AB Dor group is indeed coeval with the Pleiades (125 Myr), then 2 of our 5 stream stars with 3D velocities were 400-600 pc away from the AB Dor nucleus when it was born (where the separation uncertainties are 190 pc 125 Myr ago). The density of the AB Dor nucleus is too low222The AB Dor nucleus contains roughly 8 M⊙ of stars within a volume of 2500 pc3, for a density of 0.003 M⊙ pc-3 (Mamajek, 2010), which is a factor of 40 lower than the local disk density ( 0.12 M⊙ pc-3; van Leeuwen, 2007). It is unclear whether this subset of members constitutes a true “nucleus” or whether it is a chance over-density of stream members. to have influenced the orbits of the stream members during this time. At these past separations, at least two of the five stream stars are unlikely to have formed in the same molecular cloud as the AB Dor nucleus.
| Star | U | V | W | Ref. |
|---|---|---|---|---|
| … | km s-1 | km s-1 | km s-1 | … |
| HD 6569 | -7.91.2 | -28.91.2 | -10.01.2 | 1,4 |
| HD 207278 | -8.33.0 | -30.22.5 | -12.81.6 | 2,4 |
| HD 217343 | -3.20.4 | -25.40.4 | -13.60.3 | 1,5 |
| HD 218860A | -8.31.2 | -28.30.9 | -10.30.7 | 3,5 |
| HD 224228 | -7.50.4 | -27.70.3 | -13.50.3 | 1,4 |
| AB Dor nuc. | -7.60.4 | -27.31.1 | -14.90.3 | 6 |
| Pleiades | -6.80.6 | -28.10.6 | -14.10.4 | 7 |
Note. — All velocities calculated using parallaxes from van Leeuwen (2007). Proper motion and radial velocity references: (1) van Leeuwen (2007), (2) UCAC3 (Zacharias et al., 2010), (3) PPMX (Röser et al., 2008), (4) Torres et al. (2006), (5) Nordström et al. (2004), (6) Mamajek (2010) and Mamajek (in prep.). (7) Velocity for the Pleiades was calculated using the mean cluster proper motion from van Leeuwen (2007), parallax from Soderblom et al. (2005), and radial velocity from Robichon et al. (1999).
3.3 An Age Constraint on AB Dor
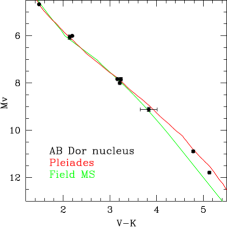
One can constrain the age of the AB Dor nucleus by searching for the main sequence turn-on point (e.g. Pecaut et al., 2012). Using the Zuckerman et al. (2004) sample of nucleus stars, we constructed a V-Ks vs. MV color-magnitude diagram (Fig. 2) using V magnitudes from Perryman & ESA (1997), Ks photometry from 2MASS (Skrutskie et al., 2006), and parallaxes from van Leeuwen (2007). We compare the positions of the AB Dor nucleus stars to the dereddened Pleiades color-magnitude sequence from Stauffer et al. (2007), and a main sequence constructed using the relations of Wright (2005) and a custom B-V vs. V-Ks color-color fit for field stars333http://www.pas.rochester.edu/emamajek/EEM_dwarf_UBVIJHK_colors_Teff.dat.
The Pleiades and field star main sequence are in remarkable agreement for stars blueward of V-Ks 3.4 (Teff 4000 K; using calibration of Casagrande et al., 2008) and MV 8.3 (log(L/L⊙) -1.02). Using the Baraffe et al. (1998) tracks, this turn-on ZAMS position corresponds to a 0.65 M⊙ star. It takes such a star 120 Myr to contract as a pre-MS star before reaching within 0.01 dex luminosity of the ZAMS. This agrees remarkably well with other modern turnoff and Li depletion ages for the Pleiades (125 Myr; e.g. Stauffer et al., 1998; Barrado y Navascués et al., 2004; Kharchenko et al., 2005).
For the AB Dor nucleus, there is a well-defined clump of late K-type members which appear to be on the ZAMS: including HIP 25283 ((), MV = 3.16, 7.84), HIP 26369 ((), MV = 3.23, 7.92) & HIP 31878 ((), MV = 3.21, 8.00). The color magnitude diagram is sparse redward of this, however the known nucleus members redward of V-Ks 4.78 (Teff 3180 K; HIP 22738A, B, AB Dor Ba/Bb) are certainly pre-MS. Considering its color-magnitude position with respect to other nucleus members, AB Dor itself is clearly ZAMS, not pre-MS, as commonly quoted ((), MV = 2.26, 6.05)444Based on the multidecadal V-band photometry presented in Fig. 2 of Innis et al. (2008), we adopt an average V magnitude of AB Dor of 6.95.. Hence the use of pre-MS evolutionary tracks for AB Dor A is inappropriate. The stars blueward of V-Ks 3.25 (Teff 4140 K) and brighter than MV 8.0 (log(L/L⊙) -0.96) are definitely on the MS. Using the Baraffe et al. (1998) tracks, this corresponds to stars of mass 0.67 M⊙. It takes a 0.67 M⊙ star 110 Myr to contract to the ZAMS, hence we can take 110 Myr as a strong lower limit on the age of the AB Dor nucleus.
The cooler AB Dor nucleus members HIP 22738 A (V-Ks = 4.78, MV = 10.89) and HIP 22738 B (V-Ks = 5.13, MV = 11.79) have color-magnitude positions nearly coincident with the single-star Pleiades sequence of Stauffer et al. (2007), when one adopts the HST Pleiades distance from Soderblom et al. (2005). The location of ZAMS stars with V-Ks 3.2 is at odds with previous younger age estimates (50-70 Myr; Zuckerman et al., 2004; Torres et al., 2008; da Silva et al., 2009), and with recent age estimates for the AB Dor system itself of 40-50 Myr (Guirado et al., 2011)555However these authors conceded that “Older ages are not completely excluded by our data” and 50-100 Myr (Janson et al., 2007). Our results further corroborate the findings of Luhman et al. (2005) that the AB Dor group is coeval with the Pleiades (125 Myr).
4 Discussion
A stellar group that formed simultaneously within a molecular cloud is expected to be chemically homogeneous, except for elements potentially depleted as the stars age (e.g. Li, Be). To test for chemical homogeneity within our sample, we developed an abundance test. We calculated a value for each star individually, using where is the measured abundance of the th element, is the uncertainty in this measurement, and is the expected abundance of the star, obtained by a weighted linear least squares fit to the abundance vs. Teff trend for each element. The values of the individual stars were then summed to obtain a total , . We compared to the 95%-significance critical values. If our stars constitute a chemically homogeneous sample, should be less than the critical value. If was too high, we rejected the star with the highest individual , and repeated the above calculations with the remaining stars. We continued this iterative procedure until a statistically homogeneous sub-sample was found. Out of our original sample of 10 stars, we found only 5 to be consistent with being chemically homogeneous: HD 189285, 224228, 217343, 199058 and 317617 (Table 4). Our results suggest that roughly half of the purported AB Dor stream stars have dissimilar chemical compositions.
| HD | Teff (K) | [Na/H] | [Mg/H] | [Al/H] | [Si/H] | [Ca/H] | [Cr/H] | [Mn/H] | [Ni/H] | [Ba/H] | [Fe/H] | |
|---|---|---|---|---|---|---|---|---|---|---|---|---|
| 317617 | 4870(63) | 0.01(9) | -0.04(7) | -0.04(4) | -0.10(3) | 0.11(9) | 0.10(5) | -0.09(1) | -0.08(1) | 0.10(5) | -0.03(3) | 8.6 |
| 224228 | 4953(52) | -0.08(8) | -0.12(3) | -0.14(10) | -0.09(3) | 0.07(8) | 0.07(1) | -0.04(1) | -0.09(2) | 0.12(2) | -0.04(3) | 11.3 |
| 217343 | 5830(59) | -0.08(4) | -0.15(4) | 0.08(10) | -0.04(3) | -0.01(3) | 0.17(18) | -0.18(4) | -0.11(3) | 0.18(3) | -0.04(4) | 8.9 |
| 199058 | 5737(71) | -0.08(3) | -0.15(12) | -0.14(1) | -0.06(3) | 0.01(4) | 0.00(10) | -0.09(4) | -0.13(2) | 0.19(2) | -0.03(5) | 7.2 |
| 189285 | 5537(56) | -0.12(5) | -0.11(7) | -0.05(3) | -0.07(3) | 0.03(3) | 0.00(10) | -0.12(2) | -0.12(3) | 0.11(1) | -0.03(4) | 9.7 |
Note. — Values in parentheses are 1 uncertainties in final digits.
To quantify the degree of chemical heterogeneity of the stream sample, we also calculated the intrinsic abundance scatter necessary to generate the observed scatter for each element in our sample. We mirrored the approach of De Silva et al. (2006), in that , where is our observed standard deviation from the mean abundance of each element, is the average measurement uncertainty we have for the abundance of each element, and is the intrinsic scatter we are solving for. We find intrinsic 1 dispersions of 0.02 (Na, Mg), 0.03 (Fe), 0.04 (Cr, Ni), 0.06 (Al, Mn), 0.08 (Ba), and 0.11 (Si). The observed scatter in the Ca abundances is consistent with no intrinsic dispersion for the sample. De Silva et al. (2006) found that the intrinsic dispersion (rms) in abundances for Hyades cluster members was typically 0.03 dex, and most notably only 0.014 dex for Ba (compared to 0.08 dex seen for AB Dor stream stars) and scatter consistent with no intrinsic dispersion for Si (compared to 0.11 dex seen for AB Dor stream stars). This scatter is also consistent with the HR diagram for the Hyades, which Quillen (2002) found yields an intrinsic scatter in [Fe/H] of 0.03 dex rms. The intrinsic scatter in abundances for AB Dor stream stars is larger than that for a typical open cluster like the Hyades.
We also compare our abundance results to abundances of field stars within 15 pc of the Sun from the S4N survey of Allende Prieto et al. (2004). In Fig. 3, we plot [Fe/H] vs. [Ba/H] for our stars and the S4N field stars. Our stars qualitatively match the abundance trends of the field stars. The other elements our sample has in common with the S4N survey show similar results. Our results are suggestive that the AB Dor stream stars comprise a sample of young stars with a range of chemical compositions.

One possible explanation for the observed scatter in our abundances is stellar activity (e.g. Schuler et al., 2010). All of the stars have X-ray counterparts in the ROSAT All-Sky Survey (Voges et al., 1999), so we calculate X-ray fluxes following Fleming et al. (1995) and quote the coronal activity of the stars as log(Lx/L in Table 1. We calculate Spearman correlation coefficients for coronal activity (log(Lx/L) vs. abundances for the 10 elements we investigated among the AB Dor stream stars (see Table 5). None of the trends are statistically significant (adopting = 0.05 significance level), as determined using a critical value table (Zar, 1972). We also test whether abundance trends exist vs. chromospheric activity as quantified using H emission. We calculate residual H equivalent widths by subtracting normalized spectra of similar resolution of stars of similar temperature and approximately solar metallicity from the Montes & Martin (1998) library of echelle spectra. These residuals are listed in Table 1. In Table 6, we list the Spearman rank order correlation cofficients for residual H emission equivalent widths versus elemental abundances. [Mg/H] and [Fe/H] show 2 correlations, while our other abundances show no significant correlations with H residuals.
| log(Lx/L | |
|---|---|
| vs. | |
| Na/H | 0.48 |
| Mg/H | -0.10 |
| Al/H | 0.28 |
| Si/H | -0.30 |
| Ca/H | 0.12 |
| Cr/H | -0.12 |
| Mn/H | -0.10 |
| Ni/H | -0.18 |
| Ba/H | -0.33 |
| Fe/H | -0.06 |
Note. — For two-tailed test and sample of 10 objects, the = 0.05 level of significance corresponds to = 0.648 (Zar, 1972).
| Full Sample | TYC 486-4943-1 and BD-03 4778 removed | ||
|---|---|---|---|
| EW(H) vs. | EW(H) vs. | ||
| Na/H | -0.30 | Na/H | 0.05 |
| Mg/H | 0.62 | Mg/H | 0.26 |
| Al/H | -0.12 | Al/H | -0.07 |
| Si/H | 0.45 | Si/H | 0.07 |
| Ca/H | 0.27 | Ca/H | 0.43 |
| Cr/H | -0.04 | Cr/H | -0.40 |
| Mn/H | 0.30 | Mn/H | -0.19 |
| Ni/H | 0.25 | Ni/H | -0.14 |
| Ba/H | 0.50 | Ba/H | 0.02 |
| Fe/H | 0.58 | Fe/H | 0.12 |
Note. — EW(H) is the estimated chromospheric H emission (see Table 1 & §4). For two-tailed test and sample of 10 objects, the = 0.05 level of significance corresponds to = 0.648 (Zar, 1972). Whether or not the two active stars TYC 486-4943-1 and BD-03 4778 are included in the sample, none of the activity vs. abundance correlations have significance beyond = 0.05.
However, before making conclusions regarding the intrinsic scatter in the elemental abundances and trends of abundances vs. activity, we note that two stars (BD-03 4778 and TYC 486-4943-1) are substantially more active than the other stars in our sample (both in terms of coronal X-ray emission and chromospheric H emission; see Table 1). When these stars are removed from calculation of the Spearman correlation coefficients for H emission vs. abundance, we do not see any statistically significant correlations. To examine the influence of these two stars on our results, we repeat our calculation of the intrinsic elemental abundance scatters without these two stars. We find intrinsic 1 dispersions of 0.01 dex (Fe, Mg), 0.02 dex (Si), 0.04 dex (Ni), 0.05 dex (Cr), 0.06 dex (Mn, Ba), 0.07 dex (Al), and again negligible scatter for the Ca and Na abundances. The intrinsic scatter for [Si/H] dropped significantly when the two active stars are removed from the sample. While the scatter is negligible for some elements, it is measurably higher for others (e.g. Cr, Mn, Ba, Al) than one would expect for a cluster sample. We thus conclude that activity alone is unlikely to explain the observed heterogeneity in abundances among the AB Dor stream stars.
| HD | Teff (K) | [Na/H] | [Mg/H] | [Al/H] | [Si/H] | [Ca/H] | [Cr/H] | [Mn/H] | [Ni/H] | [Ba/H] | [Fe/H] | |
|---|---|---|---|---|---|---|---|---|---|---|---|---|
| 224228 | 4953(52) | -0.08(8) | -0.12(3) | -0.14(10) | -0.09(3) | 0.07(8) | 0.07(1) | -0.04(1) | -0.09(2) | 0.12(2) | -0.04(3) | 5.0 |
| 218860A | 5543(49) | -0.06(4) | 0.00(8) | 0.02(6) | 0.02(2) | 0.09(4) | 0.14(5) | -0.01(3) | -0.02(2) | 0.26(2) | 0.05(3) | 7.5 |
| 6569 | 5170(59) | -0.05(5) | -0.02(6) | 0.01(2) | -0.04(3) | 0.04(2) | 0.20(2) | 0.02(3) | 0.00(3) | 0.22(2) | 0.06(3) | 17.5 |
| Wt. Mean | …………. | -0.06(3) | -0.09(3) | 0.01(2) | -0.02(1) | 0.05(2) | 0.10(1) | -0.03(1) | -0.04(1) | 0.20(1) | 0.02(2) | …….. |
Note. — Values in parentheses are 1 uncertainties in final digits.
Besides the five stars listed in Table 4, we found that another subsample of 3 stars (HD 6569, HD 224228, and HD 218860A) is also consistent with chemical homogeneity. Interestingly, these 3 stars also stay within 200 pc of each other in the past (well closer than any other pairs of stars). These 3 stars, displayed in Table 7 and shown in bold in Fig. 1, are also the 3 closest stars to the AB Dor nucleus in the past. This combination of chemical and kinematic homogeneity indicates that these 3 stars could have formed together in the same birthsite, along with AB Dor. Their weighted mean metallicity is [Fe/H] = 0.02 0.02 dex, and if one places the 10 elements on equal footing, one derives a mean metallicity of [M/H] = 0.01 0.02 dex. This is nearly identical to a previous mean estimate for the AB Dor group by Ortega et al. (2007) ([Fe/H] = -0.02 0.02 dex), and the average quoted metallicity [Fe/H] for the Pleiades (+0.04 0.02 dex; Soderblom et al., 2009). Our combined chemical and kinematic results suggest that these values are most representative of the true AB Dor group. Thus, we find that a subsample of the AB Dor stream stars may constitute a kinematically and chemically coherent population, but that one should not assume that all stream stars have a common origin with one another or the AB Dor nucleus.
The nature of the group of 5 chemically homogeneous stars666It is more correct to say that they are statistically consistent with constituting a chemically homogeneous subsample within the levels of our abundance uncertainties. in Table 4 is more difficult to determine. Only 2 of these stars have Hipparcos parallaxes, so we could not run all 5 through our kinematic tests. It is possible that some or all of these stars could represent their own stream, distinct from AB Dor, but we cannot say this definitively without more precise kinematic data.
5 Summary
We have obtained high-resolution spectra of 10 purported AB Dor moving group “stream” members. Using measured abundances for 10 elements (including Fe) we show that our sample of stream stars is statistically inconsistent with being chemically homogeneous. The abundance trends of these stars are consistent with field star trends, and our results suggest that perhaps half of the stream stars can be considered statistically chemically homogeneous, whereas the other half show slightly different chemical compositions which could reflect birth in regions other than AB Dor’s birthsite. Due to the lack of statistical correlations between stellar activity indicators (log(Lx/L and H emission) and the individual stellar abundances, we surmise that stellar activity alone is unable to explain the observed spread in abundances. Kinematically, only 5 of our stars have well determined 3D velocities, but we find that 2 of these were 400-600 pc away from the AB Dor nucleus when it was born, whereas 3 of them (which also appear to be statistically chemically homogeneous) could have formed in AB Dor’s vicinity at the group’s birth. This kinematically and chemically coherent group has mean metallicity of [Fe/H] = 0.02 0.02 dex, which we think is representative of the AB Dor group. While there does appear to be an AB Dor “nucleus” (Zuckerman et al., 2004), it appears that a significant fraction of the outlying stream members found in Torres et al. (2008) and da Silva et al. (2009) do not constitute a chemically homogeneous or kinematically coherent sample.
We also demonstrate that the AB Dor nucleus must be 110 Myr based on the presence of 3 late K-type members which are clearly on the zero-age main sequence. This disagrees with the often-cited ages for the AB Dor group and AB Dor multiple system of 40-100 Myr. Taking into account the findings of Luhman et al. (2005), the data are strongly in favor of coevality of the AB Dor nucleus with the Pleiades (125 Myr).
Our survey shows that kinematics, color-magnitude positions, and stellar youth indicators alone are not necessarily sufficient for testing whether a kinematic group of stars actually shares a common origin. Chemical tagging of purported members of moving groups provides an additional diagnostic for testing group membership, and holds promise for piecing together the recent chemo-kinematic history of star-formation in the solar vicinity.
References
- Allende Prieto et al. (2004) Allende Prieto, C., Barklem, P. S., Lambert, D. L., & Cunha, K. 2004, A&A, 420, 183
- Barrado y Navascués et al. (2004) Barrado y Navascués, D., Stauffer, J. R., & Jayawardhana, R. 2004, ApJ, 614, 386
- Baraffe et al. (1998) Baraffe, I., Chabrier, G., Allard, F., & Hauschildt, P. H. 1998, A&A, 337, 403
- Bensby et al. (2007) Bensby, T., Oey, M. S., Feltzing, S., & Gustafsson, B. 2007, ApJ, 655, L89
- Bertelli et al. (2009) Bertelli, G., Nasi, E., Girardi, L., & Marigo, P. 2009, A&A, 508, 355
- Bovy & Hogg (2010) Bovy, J., & Hogg, D. W. 2010, ApJ, 717, 617
- Bubar & King (2010) Bubar, E. J., & King, J. R. 2010, AJ, 140, 293
- Burke et al. (2004) Burke, C. J., Pinsonneault, M. H., & Sills, A. 2004, ApJ, 604, 272
- Casagrande et al. (2008) Casagrande, L., Flynn, C., & Bessell, M. 2008, MNRAS, 389, 585
- Casagrande et al. (2010) Casagrande, L., Ramírez, I., Meléndez, J., Bessell, M., & Asplund, M. 2010, A&A, 512, A54
- da Silva et al. (2009) da Silva, L., Torres, C. A. O., de La Reza, R., et al. 2009, A&A, 508, 833
- De Silva et al. (2006) De Silva, G. M., Sneden, C., Paulson, D. B., et al. 2006, AJ, 131, 455
- De Silva et al. (2007a) De Silva, G. M., Freeman, K. C., Bland-Hawthorn, J., Asplund, M., & Bessel, M. S. 2007a, AJ, 133, 694
- De Silva et al. (2007b) De Silva, G. M., Freeman, K. C., Asplund, M., et al. 2007b, AJ, 133, 1161
- Dehnen & Binney (1998) Dehnen, W., & Binney, J. 1998, MNRAS, 294, 429
- D’Orazi et al. (2012) D’Orazi, V., Biazzo, K., Desidera, S., et al. 2012, MNRAS, 423, 2789
- Famaey et al. (2008) Famaey, B., Siebert, A., & Jorissen, A. 2008, A&A, 483, 453
- Fleming et al. (1995) Fleming, T. A., Schmitt, J. H. M. M., & Giampapa, M. S. 1995, ApJ, 450, 401
- Gontcharov (2006) Gontcharov, G. A. 2006, Astronomy Letters, 32, 759
- Guirado et al. (2011) Guirado, J. C., Marcaide, J. M., Martí-Vidal, I., et al. 2011, A&A, 533, A106
- Innis et al. (2008) Innis, J. L., Budding, E., Olah, K., et al. 2008, Information Bulletin on Variable Stars, 5832, 1
- Janson et al. (2007) Janson, M., Brandner, W., Lenzen, R., et al. 2007, A&A, 462, 615
- Jeffries (1995) Jeffries, R. D. 1995, MNRAS, 273, 559
- Johnson & Soderblom (1987) Johnson, D. R. H., & Soderblom, D. R. 1987, AJ, 93, 864
- Kharchenko et al. (2005) Kharchenko, N. V., Piskunov, A. E., Röser, S., Schilbach, E., & Scholz, R.-D. 2005, A&A, 438, 1163
- Luhman et al. (2005) Luhman, K. L., Stauffer, J. R., & Mamajek, E. E. 2005, ApJ, 628, L69
- Mamajek (2010) Mamajek, E. E. 2010, BAAS, 42, #455.05
- Montes & Martin (1998) Montes, D., & Martin, E. L. 1998, A&AS, 128, 485
- Nordström et al. (2004) Nordström, B., Mayor, M., Andersen, J., et al. 2004, A&A, 418, 989
- Ortega et al. (2007) Ortega, V. G., Jilinski, E., de La Reza, R., & Bazzanella, B. 2007, MNRAS, 377, 441
- Pecaut et al. (2012) Pecaut, M. J., Mamajek, E. E., & Bubar, E. J. 2012, ApJ, 746, 154
- Perryman & ESA (1997) Perryman, M. A. C., & ESA 1997, ESA Special Publication, 1200
- Pinsonneault et al. (2000) Pinsonneault, M. H., Terndrup, D. M., & Yuan, Y. 2000, Stellar Clusters and Associations: Convection, Rotation, and Dynamos, 198, 95
- Quillen (2002) Quillen, A. C. 2002, AJ, 124, 400
- Robichon et al. (1999) Robichon, N., Arenou, F., Mermilliod, J.-C. & Turon, C. 1999, A&A, 345, 471
- Röser et al. (2008) Röser, S., Schilbach, E., Schwan, H., et al. 2008, A&A, 488, 401
- Schuler et al. (2010) Schuler, S. C., Plunkett, A. L., King, J. R, & Pinsonneault, M. H. 2010, PASP, 122, 766
- Schlieder et al. (2010) Schlieder, J. E., Lépine, S., & Simon, M. 2010, AJ, 140, 119
- Skrutskie et al. (2006) Skrutskie, M. F., Cutri, R. M., Stiening, R., et al. 2006, AJ, 131, 1163
- Sneden (1973) Sneden, C. A. 1973, Ph.D. Thesis, The University of Texas at Austin
- Soderblom et al. (2005) Soderblom, D. R., Nelan, E. Benedict, G. F., et al. 2005, AJ, 129, 1616
- Soderblom et al. (2009) Soderblom, D. R., Laskar, T., Valenti, J. A., Stauffer, J. R., & Rebull, L. M. 2009, AJ, 138, 1292
- Stauffer et al. (1998) Stauffer, J. R., Schultz, G., & Kirkpatrick, J. D. 1998, ApJ, 499, L199
- Stauffer et al. (2007) Stauffer, J. R., Hartmann, L. W., Fazio, G. G., et al. 2007, ApJS, 172, 663
- Teuben (1995) Teuben, P. 1995, Astronomical Data Analysis Software and Systems IV, 77, 398
- Torres et al. (2006) Torres, C. A. O., Quast, G. R., da Silva, L., et al. 2006, A&A, 460, 695
- Torres et al. (2008) Torres, C. A. O., Quast, G. R., Melo, C. H. F., & Sterzik, M. F. 2008, Handbook of Star Forming Regions, Volume II, 757
- van Leeuwen (2007) van Leeuwen, F. 2007, Astrophysics and Space Science Library, 350
- Viana Almeida et al. (2009) Viana Almeida, P., Santos, N. C., Melo, C., et al. 2009, A&A, 501, 965
- Voges et al. (1999) Voges, W., Aschenbach, B., Boller, T., et al. 1999, A&A, 349, 389
- Wright (2005) Wright, J. T. 2005, AJ, 129, 1776
- Zacharias et al. (2010) Zacharias, N., Finch, C., Girard, T., et al. 2010, AJ, 139, 2184
- Zar (1972) Zar, J. H. 1972, Journal of the American Statistical Association, 67, 578
- Zuckerman et al. (2004) Zuckerman, B., Song, I., & Bessell, M. S. 2004, ApJ, 613, L65
- Zuckerman et al. (2011) Zuckerman, B., Rhee, J. H., Song, I., & Bessell, M. S. 2011, ApJ, 732, 61