Metallization of Magnesium Polyhydrides Under Pressure
Abstract
Evolutionary structure searches are used to predict stable phases with unique stoichiometries in the hydrogen–rich region of the magnesium/hydrogen phase diagram under pressure. MgH4, MgH12 and MgH16 are found to be thermodynamically stable with respect to decomposition into MgH2 and H2 near 100 GPa, and all lie on the convex hull by 200 GPa. MgH4 contains two H- anions and one H2 molecule per Mg2+ cation, whereas the hydrogenic sublattices of MgH12 and MgH16 are composed solely of H molecules. The high–hydrogen content stoichiometries have a large density of states at the Fermi level, and the of MgH12 at 140 GPa is calculated to be nearly three times greater than that of the classic hydride, MgH2, at 180 GPa.
pacs:
71.20.Dg, 74.62.Fj, 62.50.-p, 63.20.dkI Introduction
In 1935, Wigner and Huntington predicted that hydrogen, which exists in the paired molecular state at ambient pressures and temperatures, would become an alkali–metal–like monoatomic solid when compressed to pressures exceeding 25 GPa Wigner and Huntington (1935). This turned out to be a bit of an underestimate. Structure searches based upon density functional theory calculations have identified a number of molecular ( GPa) Pickard and Needs (2007) and quasi–molecular or atomic ( TPa) Liu et al. (2012a); McMahon and Ceperley (2011a) structures in the cold phase diagram, and experiments in diamond anvil cells show that the insulating phase III with paired hydrogens is stable over a broad temperature range and up to at least 360 GPa Zha et al. (2012). Recent experimental work at room temperature above 220 GPa, which showed a pronounced softening of one of the Raman active molecular vibrons upon compression Howie et al. (2012), and potential conductivity Eremets and Troyan (2011) has generated much excitement Amato (2012). The newly discovered phase IV of hydrogen is thought to be a mixed structure composed of layers of molecular units, as well as weakly bonded graphene–like sheets Liu et al. (2012b); Pickard et al. (2012). Superconductivity at pressures of 450 GPa and temperatures up to 242 K has been predicted in the molecular phase Cudazzo et al. (2008), whereas the superconducting transition temperature, , may approach 764 K for monoatomic hydrogen near 2 TPa McMahon and Ceperley (2011b).
What are the structural motifs that compressed hydrogen adopts when doped with an electropositive element? Theoretical work has predicted the presence of hydridic H- atoms, H molecules, motifs, symmetric H molecules, polymeric (H)∞ chains, and sodalite cage structures, with the nature of the hydrogenic sublattice depending upon the identity of the alkali or alkaline earth metal, and the pressure Zurek et al. (2009); Baettig and Zurek (2011); Hooper and Zurek (2012a, b); Shamp et al. (2012); Hooper et al. (2012a); Zhou et al. (2012); Wang et al. (2012). The latter clathrate–like cage which encapsulated the calcium cation in CaH6 was shown to be susceptible to a Jahn–Teller distortion, giving rise to a remarkable electron–phonon coupling parameter of 2.69 at 150 GPa with a concomitant of 225 K Wang et al. (2012).
Herein, evolutionary structure searches are used to seek out the stoichiometries and structures of magnesium polyhydrides, MgHn with , under pressure. MgH4 is predicted to become stable with respect to decomposition into MgH2 and H2 near 100 GPa, and it remains the most stable stoichiometry until at least 200 GPa. –MgH4 contains two hydridic hydrogens and one hydrogen molecule per Mg2+ cation, and it becomes metallic as a result of pressure–induced band overlap. However, due to the low density of states at the Fermi level, the estimated at 100 GPa is only 10 K higher than that of –MgH2 at 180 GPa. Two other stoichiometries, MgH12 and MgH16, are calculated as being thermodynamically stable at higher pressures. Because these hydrogen rich phases exhibit an “H belt” surrounding the Mg2+ cations, and do not contain any hydridic hydrogens, they have a high density of states at the Fermi level. Assuming typical values of the Coulomb pseudopotential, the of MgH12 is calculated as being between 47-60 K at 140 GPa. Phases with a greater ratio of H:H- tend to have a larger density of states at the Fermi level, and a higher .
II Computational Methods
The structural searches were performed using the open–source evolutionary algorithm (EA) XtalOpt release 8 along with the default parameter set Lonie and Zurek (2011). Evolutionary runs were carried out on the MgH2 stoichiometry at 0, 25, 50, 100, 150, 200 and 250 GPa with cells containing 2, 3, 4 and 8 formula units (FU). At 200 GPa additional searches on cells with 5 and 6 FU were performed. Only the known , and –phases were recovered, with the structure remaining the most stable up to the highest pressures considered. Exploratory searches at 200 GPa revealed that MgHn with were noticeably less stable than those with even . Thus, a more refined search was carried out at 100 and 200 GPa which was restricted to even ranging from 4-16 with 2-4 FU for MgH4 and MgH6, 2-3 FU for MgH8 and 2 FU otherwise. Additional searches for and were carried out with 8 and 5 FU at 100 and 200 GPa, respectively. Duplicate structures were detected using the XtalComp Lonie and Zurek (2012) algorithm. The spglib package Spglib was used to determine space–group symmetries.
Geometry optimizations and electronic structure calculations were performed using using density functional theory (DFT) as implemented in the Vienna ab-initio simulation package (VASP) Kresse and Hafner (1993). The exchange and correlation effects were treated using the Perdew-Burke-Ernzerhof (PBE) functional Perdew et al. (1996) with plane–wave basis sets and a kinetic energy cutoff of 600 eV. The hydrogen 1s1 and magnesium 2p63s2 electrons were treated explicitly and the projector-augmented wave (PAW) method Blöchl (1994) was used to treat the core states. The –point grids were chosen using the –centered Monkhorst–Pack scheme. The number of divisions along each reciprocal lattice vector was chosen such that the product of this number with the real lattice constant was 40 Å for the final geometry optimizations, as well as at least 50 Å for the electronic densities of states (DOS) and band structures.
In situations where band gap closure occurs as a result of pressure induced broadening, and eventual overlap of the valence and conduction bands, standard density functionals predict too low metallization pressures. For this reason we have calculated the DOS of select structures using the HSE06 screened hybrid functional, which has been shown to give good accuracy for band gaps Krukau et al. (2006). Due to the immense computational expense involved in hybrid calculations, the geometries employed have been optimized with PBE. Recently, it has been shown that inclusion of Hartree–Fock exchange in functionals such as HSE06 or PBE0 can have a significant impact upon the calculated transition pressures between different phases Liu et al. (2012c); Teweldeberhan et al. (2012). Moreover, a study considering liquid nitrogen at pressures up to 200 GPa (and finite temperatures) has shown that the structural relaxations with a hybrid functional can lead to large Peierls distortions (which inevitably have an impact on the band gap) Boates and Bonev (2011). It has been proposed that nontrivial exchange correlation effects can become quite important at extreme pressures, in particular when electron localization occurs (“electride” behavior Pickard and Needs (2009)), and/or when the semicore electrons interact Teweldeberhan et al. (2012). Since we do not observe significant broadening of the Mg bands at the pressures considered here, it may be that structural relaxation with a hybrid functional will yield similar results as PBE. This will be considered in future studies. However, as expected, our calculations show that hybrid functionals increase the pressures at which band gap closure is predicted to occur.
Phonon calculations were performed using VASP combined with the phonopy package Phonopy on supercells of 288 (MgH2), 160 (MgH4), 351 (MgH12) and 272 (MgH16) atoms. The electronic densities of states and phonon band structures obtained with VASP for MgH2, MgH4 and MgH12 at 180, 100 and 140 GPa showed good agreement to those computed using the Quantum Espresso (QE) program Giannozzi et al. (2009), and the computational settings described below.
In the QE calculations the H and Mg pseudopotentials, obtained from the QE pseudopotential library, were generated by the method of von Barth and Car with 1 and 33 valence configurations, along with the Perdew–Zunger local density approximation Perdew and Zunger (1981). We choose this particular Mg pseudopotential as it has been employed in numerous lattice dynamical studies of materials under pressure, see for example Ref. Karki et al. (2000). Plane wave basis set cutoff energies, which gave an energy convergence to better than 0.3 mRy/atom were 55, 75 and 90 Ry for MgH2, MgH4 and MgH12, respectively, and a Brillouin–zone sampling scheme of Methfessel–Paxton Methfessel and Paxton (1989) with a smearing factor of 0.02 Ry was employed. Density functional perturbation theory, which is implemented in QE, was used for the phonon calculations. The electron–phonon coupling matrix elements were calculated using a –mesh and –mesh for MgH2 and MgH4, along with a –mesh and –mesh for MgH12. The electron phonon coupling (EPC) parameter, , was calculated using a set of Gaussian broadenings in steps of 0.005 Ry. The broadening for which was converged to within 0.005 was 0.035, 0.025 and 0.040 Ry for MgH2, MgH4 and MgH12, respectively. The superconducting transition temperature, , has been estimated using the Allen–Dynes modified McMillan equation Allen and Dynes (1975) as:
| (1) |
where is the logarithmic average frequency and is the Coulomb pseudopotential, often assumed to be between 0.1-0.13.
The molecular calculations on H and MgH12 were performed using the ADF software package adf and the revPBE gradient density functional. The band structures of select phases (see the Supporting Information, SI) were calculated using the tight–binding linear muffin–tin orbital (TB-LMTO) method Andersen and Jepsen (1984), the VWN local exchange correlation potential along with the Perdew–Wang GGA.
III Results and Discussion
III.1 Squeezing MgH2
The potential for reversible hydrogen storage has resulted in much interest not only in crystalline MgH2, but also in nanoparticles based on the structure of the various phases of this solid Vajeeston et al. (2012a, b); Reich et al. (2012); Koukaras et al. (2012); Buckley et al. (2012). At 1 atm -MgH2 assumes a TiO2–rutile–type geometry and it undergoes a series of structural transitions, , at 0.39, 3.84, 6.73 and 10.26 GPa Vajeeston et al. (2006, 2002). At around 165 GPa the phase slightly distorts to a higher symmetry Ni2In–type configuration, -MgH2, see Fig. 1, which was shown to be dynamically stable at 180 GPa. At lower pressures BaH2 Tse et al. (2009); Chen et al. (2010), CaH2 Tse et al. (2007), and SrH2 Smith et al. (2009) also adopt this structure. However, whereas the heavier alkaline earth dihydrides with symmetry are insulating, in MgH2 metallization is predicted to occur by 170 GPa at the PBE–level of theory Zhang et al. (2010). Our evolutionary runs did not reveal any other phases of MgH2 up to 300 GPa, a pressure at which the metallicity in -MgH2 persists. Calculations using the HSE06 screened hybrid functional Krukau et al. (2006) confirm the metallicity at 180 GPa (see the SI).
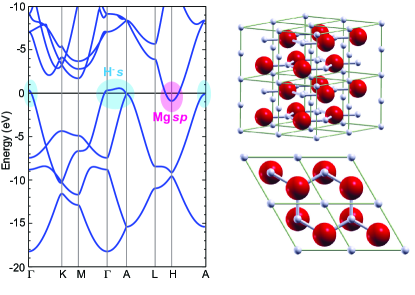
-MgH2 is metallic as a result of the closure of an indirect band gap. A flat band displaying H- –character rises above the Fermi level, , around , and a steep band that boasts primarily Mg and a little bit of Mg –character falls below around the –point, as illustrated in Fig. 1. -MgH2 contains half the number of valence electrons per formula unit as does MgB2, which becomes superconducting at 39 K Nagamatsu et al. (2001). The B – and H –bands are comparable, in particular the “holes” at the top of the band spanning from to . However, whereas MgB2 consists of hexagonal boron sheets with Mg2+ intercalated in the hexagonal holes, the hexagonal network in -MgH2 is made up of alternating Mg2+ and H- ions, with the second set of hydrides located in the hexagonal holes. So the Fermi surfaces arising from the B – Choi et al. (2002) and the H –bands Zhang et al. (2010) are not identical. We also noticed some similarities between -MgH2 and the most stable CsH phase above 160 GPa Hooper et al. (2012b). Whereas the former can be thought of as layers of graphitic sheets of alternating Mg2+ and H- ions arranged in an ABABA… stacking with H- sandwiched in between the two layers, in CsH half of the H- have been removed so that only layers of Cs+ and H- are found.
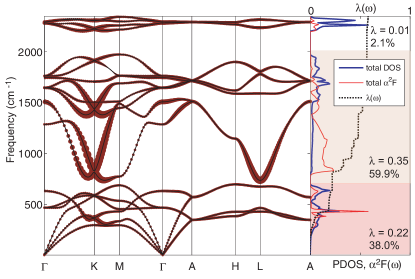
The density of states at the Fermi level, , of -MgH2 is 0.01 eV -1/electron at 170 GPa and by 300 GPa it decreases only slightly, see the SI. Despite the relatively low we were intrigued in the possibility of superconductivity in this system. Fig. 2 plots the phonon band structure and densities of states, phonon linewidths (), Eliashberg spectral function (), and of -MgH2 at 180 GPa. 38% of the total EPC parameter, , is a result of the low–frequency modes below 700 cm-1 which are associated primarily with the motions of the heavier Mg ions, whereas the region between 750-2400 cm-1, which is mostly due to motions of the H- anions, contributes 62% towards the total with the modes along and playing a dominant role. The modes above 2100 cm-1 are primarily caused by the set of H- anions which are closer to the Mg2+ cations (the Mg–H distances at 180 GPa measure 1.58 and 1.81 Å). Despite the modest the total EPC parameter is calculated as being 0.58, and along with an of 1111 K gives rise to a of 16-23 K for ranging from , respectively, via the Allen–Dynes modified McMillan equation. For comparison, the EPC parameter and for BaH2 in the simple hexagonal structure at 60 GPa have been calculated as being 0.22 and 780 K, respectively, giving rise to on the order of only a few mK Tse et al. (2009).
Given the recent interest in compressed hydrogen–rich solids as potential superconductors, we began to wonder if H2 may mix with MgH2 under pressure and what other metallic systems may be found. As will be shown in a moment, while the phase is preferred for MgH2 above 165 GPa, it is not the most stable point on the hydrogen–rich Mg/H phase diagram at these pressures.
III.2 Stabilization of the Polyhydrides
The first ionization–potential of magnesium is 2 eV larger than that of lithium, suggesting that stabilization of the magnesium polyhydrides will occur at a somewhat higher pressure than the lithium polyhydrides (that is, above 100 GPa Zurek et al. (2009)). The ionic radius of Mg2+ is about 30% smaller than that of Ca2+, and since CaH4 was found to be the most stable stoichiometry at GPa and CaH6 at 200 GPa Wang et al. (2012), we may expect that the most favorable MgHn combination has . How do these predictions — based upon chemical intuition that was developed by analyzing computational studies of compressed polyhydrides Zurek et al. (2009); Baettig and Zurek (2011); Hooper and Zurek (2012a, b); Shamp et al. (2012); Hooper et al. (2012a); Zhou et al. (2012); Wang et al. (2012) — compare with the results from our evolutionary structure searches?
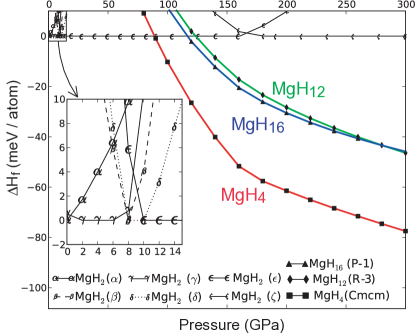
The calculated enthalpies of formation, , of the important MgHn structures found in our searches are provided in Fig. 3 (see the SI for the plot of vs. H2 composition). At 100 GPa only MgH4 is predicted to resist decomposition into MgH2 and H2. In fact, MgH4 persists as having the most negative as the pressure is increased. By 200 GPa all stoichiometries except for MgH2.5, MgH3 and MgH3.5 have a negative . Because MgH4, MgH12 and MgH16 lie on the convex hull at 200 GPa, which is provided in the SI, they are thermodynamically stable with respect to decomposition into other phases and MgH2/H2. Fig. 3 illustrates that whereas the of MgH4 starts to become negative near 92 GPa, for MgH12 and MgH16 this occurs at 122 and 117 GPa, respectively. Comparison of these findings with the predictions based upon our newly developed chemical intuition under pressure illustrates that we did reasonably well in predicting the stabilization pressures and most stable stoichiometry without performing any computations. Now, let us begin our exploration of the structural peculiarities and electronic structures of the magnesium polyhydrides falling on the convex–hull.
III.3 MgH4: H2 molecules and hydridic atoms
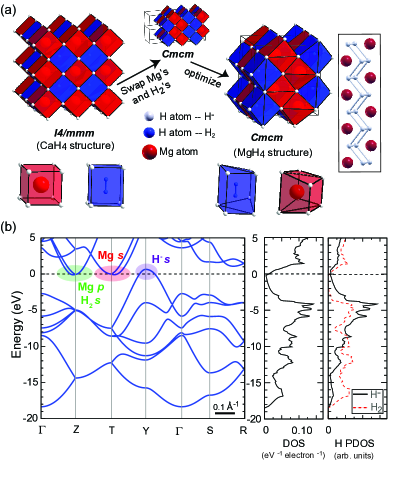
The phase with the most negative enthalpy of formation throughout the pressure range studied, –MgH4, forms a distorted CsCl bcc lattice with H- atoms taking up the vertex positions of the underlying cube–like cages. The body–centered positions are occupied by a 1:1 mix of Mg2+ cations and H2 molecules with slightly elongated bonds, as highlighted by the red and blue polyhedra in Fig. 4(a). The size mismatch between the two results in the hydrides forming different sized cages around them. The same –MgH4 structure was discovered in evolutionary runs carried out at 100 and 200 GPa, and phonon calculations at 100 GPa showed it was dynamically stable.
Interestingly, the lowest enthalpy –symmetry CaH4 structure found using the particle–swarm optimization technique Wang et al. (2010) in a recent study Wang et al. (2012) can be described the same way as –MgH4. The difference between the two is the manner in which the cations and the H2 molecules are distributed: in CaH4 they are dispersed homogeneously, but in MgH4 they are arranged into interwoven zig–zag chains. Additionally, the hydride cages are more distorted in the MgH4 structure with the smallest face which surrounds an Mg2+ being the one which links one magnesium cation to another. Actually, the structure can also be viewed as sheets of MgH2 with H2 molecules trapped in the larger gaps between the sheets, one such sheet is shown at the right of Fig. 4(a).
Within PBE the total density of states of –MgH4 at 100 GPa is quite small; in fact it is lower than that of the analogue. The former is 42 meV/atom more stable than the latter at this pressure, but the volume of –MgH4 is 0.04 Å3 per atom smaller than that of –MgH4. The formation of the zig–zag like chains illustrated in Fig. 4(a) must therefore have a substantial impact on the electronic contribution to the enthalpy.
As the pressure increases from 100 to 300 GPa, the shortest distance between the metal cations decreases from 2.56 Å to 2.32 Å, and the Mg core bands broaden from 0.19 to 0.58 eV due to core overlap. The shortest Mg–H- distance decreases from 1.74 Å to 1.55 Å, as does the Mg–H2 separation (1.92 Å/1.68 Å). The molecular H2 bonds lengthen somewhat from 0.78 Å to 0.79 Å. This is slightly longer than the intramolecular distance in pure compressed H2 at these pressures, 0.73 Å and 0.75 Å, respectively.
Since MgH4 contains H- units, it becomes metallic as a result of pressure induced band broadening and eventual overlap, like LiH2 and NaH9. Metallization occurs within PBE already by 20 GPa, even though –MgH4 is not stable with respect to decomposition into H2 and MgH2 at this pressure. A band displaying H- –character rises above at the –point, whereas bands exhibiting predominantly Mg and a little bit of H2 –character fall below it at the and –points (see Fig. 4(b), and the “fat bands” in the SI). Calculations using the HSE06 functional increase the metallization pressure to 150 GPa (see the SI).
III.4 MgH12 and MgH16: the H belt
The absence of H- anions in the other structures lying on the convex hull at 200 GPa, MgH12 and MgH16, has important consequences for their electronic structure. The hydrogenic sublattices of these phases are composed solely of H molecules with slightly stretched bonds, just like the CaH12 structure predicted in a previous study Wang et al. (2012). The presence of hydridic hydrogens in systems with a small mole fraction of hydrogen, and their absence in phases with a high hydrogen content was rationalized by Wang and co–workers by considering the formal number of ‘effectively added electrons’ (EAE) which are donated from the alkaline earth metal valence bands into the H2 –bands Wang et al. (2012) for various CaHn stoichiometries. If the EAE is small, the dihydrogen bond simply stretches as a result of the population of H2 , and hydridic hydrogens are not formed. If the EAE is large enough, the molecule dissociates into two H- units.
The most stable MgH12 structure found in our evolutionary searches had –symmetry and was shown to be dynamically stable at 140 GPa. The hexagonal building block for this phase consists of an Mg2+ cation surrounded by six H molecules, as illustrated in Fig. 5(a). The dihydrogen molecules in these hexagons appear to arrange in a ‘belt’ around the metal cation in a side–on fashion. The hexagons are tiled in parallel sheets forming an ABCABC… close–packed structure. This description is, however, somewhat misleading as the distance between Mg2+ and a hydrogen atom within the MgH12 building block is comparable to the shortest distance between the metal ion and a hydrogen atom in a different building block. For example, the intra– and inter–building block Mg–H measurements are 1.76 and 1.81 Å, respectively, at 140 GPa. The dihydrogen bonds in MgH12 are substantially elongated to 0.82 and 0.81 Å at 140 and 300 GPa, when compared with the typical bond lengths of pure H2 at these pressures (0.74/0.75 Å). A gas phase geometry optimization on a H molecule at 1 atm showed that the bond stretched from 0.75 to 0.79 Å. So the expansion of the H–H bond observed in MgH12 is consistent with the partial filling of the H2 –bands.
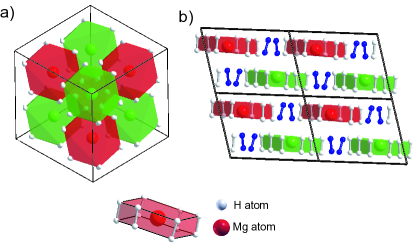
The lowest enthalpy MgH16 configuration we found, which exhibited symmetry and was dynamically stable at 130 GPa, could be thought of as being made up of similar MgH12 units with excess H molecules stuffed between the hexagons, as illustrated in Fig. 5(b). These ‘interstitial’ dihydrogens lie on top of the Mg2+ cations in the MgH12 building blocks. The intramolecular distance in H at 1 atm was calculated as being 0.78 Å, whereas the bond lengths of the dihydrogens in MgH16 range from 0.76 to 0.85 Å at 130 GPa, with the interstitial hydrogen molecules being shorter (0.76-0.78 Å) than those in the belt (0.79-0.85 Å). The unequal bond lengths in the H units may be a result of different charge states, or be due to their local bonding environments, or both Labet et al. (2012). As the pressure increases, the intramolecular H–H bond lengths decrease, with the interstitial and belt hydrogens measuring 0.74-0.76 Å and 0.78-0.84 Å, respectively, at 300 GPa.
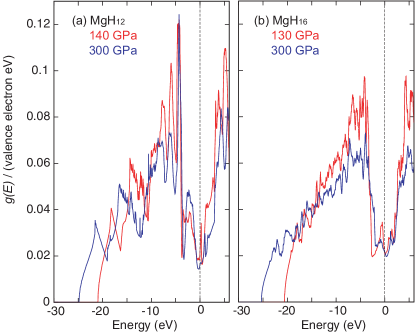
Since MgH12 and MgH16 are metallic as a result of the partial filling of the H2 –bands like LiH6, they have a high density of states at , see Fig. 6. Both phases remain good metals upon compression up to at least 300 GPa, and the Mg bands broaden only slightly to 0.15-0.2 eV at 300 GPa as a result of core overlap. A comparison of the DOS of MgH12 at 140 GPa calculated with PBE and the HSE06 screened hybrid functional showed that latter valence DOS was slightly broader (as expected for metallic systems Biller et al. (2011); Paier et al. (2006)), and the core Mg bands shifted to lower energies. However, the computed with the two functionals was essentially the same (see the SI). This is in–line with our previous results which showed that is relatively insensitive to the choice of the functional in sodium polyhydrides that did not contain hydridic hydrogens Baettig and Zurek (2011). The nearly free–electron like valence bands of MgH12 and MgH16 exhibit primarily H –character, with a little bit of Mg spanning throughout (see the fat bands in the SI). Nonetheless, the computed DOS of these structures match quite well with a hypothetical system where the metal cations have been removed, the (H12)2- and (H16)2- lattices (see the SI), suggestive of almost full ionization of the Mg valence electrons into the H2 –bands.
III.5 The MgH12 Building Blocks
A number of MH12 clusters, where M is a transition metal atom, have been predicted as being stable in the gas phase by quantum chemical calculations Gagliardi and Pyykkö (2004). Moreover WH4(H2)4, which contains four hydridic hydrogens and four dihydrogens bonded to the metal center in a side–on fashion, has been made in a neon matrix Wang et al. (2008). Unsurprisingly, molecular calculations on both the optimized MgH12 building blocks as well as (MgH12)2+ with symmetry revealed numerous imaginary frequencies, so these clusters will not be stable at 1 atm. Nonetheless, it is instructive to compare the electronic structure of the MgH12 building block with the DOS computed for –MgH12 at various pressures.
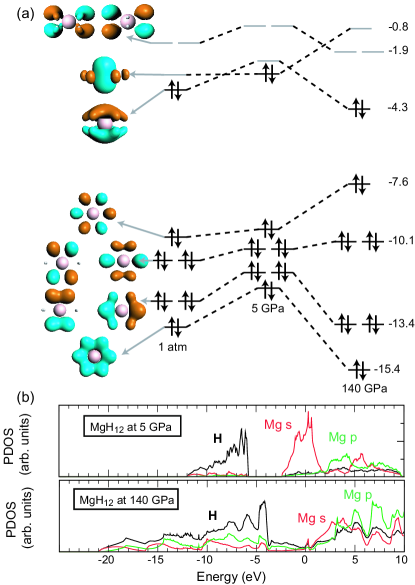
Whereas in an optimized MgH12 cluster the Mg–H and intramolecular H–H distances were calculated as being 2.20 and 0.79 Å, these values measure 2.34-2.58/1.76-1.78 Å and 0.79/0.82 Å in –MgH12 at 5/140 GPa. So the gas phase cluster is actually a little bit more ‘compressed’ than the building block within the solid at 5 GPa. The energy level diagrams and canonical molecular orbitals (MOs) of these clusters are illustrated in Fig. 7(a). The six MOs lowest in energy resemble the canonical MOs of benzene, except that they do not contain a node which bisects the dihydrogen molecules. A large gap is found between the highest occupied molecular orbital (HOMO) and HOMO-1 of the optimized cluster, but a small gap separates the HOMO and lowest unoccupied molecular orbital (LUMO). The HOMO–HOMO-1 gap decreases as the cluster is compressed, as do the analogous sets of bands in the extended system, as illustrated in Fig. 7(b).
The frontier orbitals of the 1 atm cluster contain substantial character arising from H, and the HOMO also has an important contribution from the Mg and the LUMO from the Mg orbitals. Our fragment orbital analysis te Velde et al. (2001) shows that the LUMO+1 contains primarily H–character with less than 4% of Mg states mixed in. In the ‘less–compressed’ cluster extracted from the solid at 5 GPa the frontier orbitals swap positions so that the HOMO displays Mg and the LUMO Mg –character. This is in–line with the projected densities of states which illustrate that the predominant contribution around the Fermi level is due to Mg at 5 GPa. At 140 GPa the gap between the hydrogenic and the metallic bands between -6 to -3 eV closes in the solid, and the HOMO and HOMO-1 orbitals in the cluster come closer together in energy. Moreover, as a result of the pressure induced transition in Mg, the states around the Fermi level contain about an equal amount of Mg and –character. In the cluster the energy ordering of the molecular orbitals also changes, so that the HOMO is more Mg –like, and the LUMO displays primarily H character. So the gas phase clusters are able to mimic some of the essential features of the projected DOS of the solid at different pressures.
III.6 Superconductivity in the polyhydrides
Our computations have estimated the of the classic alkaline earth hydride, –MgH2, as being 20 K at 180 GPa. We wondered what the of the aforementioned hydrogen–rich phases would be in comparison, and if would be influenced by the hydrogenic sublattice of the polyhydride. Computations have been carried out on –MgH4 and –MgH12 at 100 and 140 GPa, respectively, since these are pressures slightly larger than when was computed as becoming negative, and since both systems were found to be metallic within PBE at these pressures.
Within PBE the density of states at the Fermi level of –MgH4 at 100 GPa is comparable to the one calculated for -MgH2 at 180 GPa. The total EPC parameter is nearly 28% larger, however. In both phases the low–frequency modes which are mostly due to the vibrations of the Mg atoms contribute 0.2 to the total ; compare Fig. 8 and Fig. 2. The main reason why the overall EPC parameter is larger for the polyhydride than the classic hydride is a result of the total coupling provided by the modes between 500-2500 cm-1, which are primarily due to the motions of the hydrogen atoms. Whereas the classic hydride contains only hydridic hydrogens, there is an equal number of H2 and H- hydrogens in MgH4. The H2 vibron, located around 3500 cm-1 contributes only 1.5% to the total coupling strength in the polyhydride. This is not surprising, since the bands crossing the Fermi level displayed only a small amount of H2 –character. Despite the higher that MgH4 has as compared to MgH2, the prefactor in the modified McMillan equation, , is calculated as being 15% smaller so the total of MgH4 is estimated as being 14 K higher than that of the classic alkaline earth hydride.
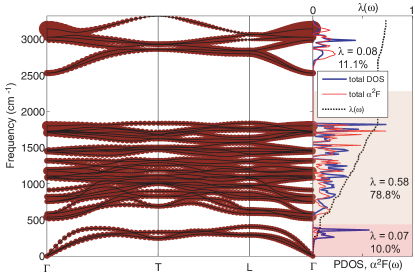
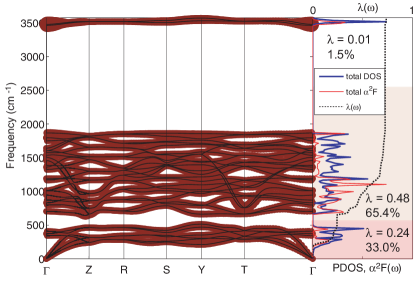
Despite the increased hydrogen content and higher density of states at the Fermi level, the total EPC parameter of –MgH12 at 140 GPa is almost the same as of –MgH4 at 100 GPa. However, a comparison of the in Fig. 9 and Fig. 8 shows that the relative contributions to the overall are quite different in the two polyhydrides. MgH12 does not contain any hydridic hydrogens, and is metallic because of the partial filling of the H2 –bands. In contrast to what was found for MgH4, the H2 vibron contributes about 11.1% to the total . This corresponds quite well to the 11.3% calculated for a compressed KH6 phase Zhou et al. (2012) whose hydrogenic sublattice only contained H motifs. The EPC associated with the low–frequency modes below 400 cm-1, which are dominated by the motions of the heavier metal atoms, is about a third of the amount calculated for the phases containing H- units. The main contribution to , 79%, arises from the intermediate frequency regime, which is primarily due to the H2 motions. The reason why the of MgH12 is estimated as being 20 K higher than that of MgH4 is due to the larger . Unfortunately, the computational expense precluded us from calculating the EPC parameter of compressed –MgH16, or from exploring the pressure dependence of .
The values we calculate for the total EPC parameter and the of the magnesium polyhydrides falls within the range of 0.5-1.6 and 10-139 K, respectively, computed for a number of hydrogen–rich systems Wang et al. (2012). We show that comparable values may be obtained for polyhydrides with very different hydrogenic sublattices, but their and therefore may differ. The magnesium polyhydrides are predicted to have a larger than MgH2 under pressure, and phases with a larger mole percent ratio will likely have a higher .
IV Conclusions
Evolutionary structure searches coupled with density functional theory calculations are used to predict the most stable structures and stoichiometries of the magnesium polyhydrides, MgHn with , under pressure. The thermodynamically stable structures found in this study have a hydrogenic sublattice containing H- anions and H2 units (MgH4), or H2 molecules which are less strongly bonded than those found in pure molecular hydrogen at 1 atm (MgH12 and MgH16).
Metallization in –MgH2 occurs as a result of an H- –band rising above, and a Mg band falling below the Fermi level. is estimated as being between 16-23 K at 180 GPa, with a sizable contribution to the total electron phonon coupling parameter arising from vibrations related to both the hydrogen and magnesium atoms.
MgH4, which starts to become thermodynamically stable with respect to decomposition into MgH2 and H2 near 100 GPa is found to contain one H2 molecule and two hydridic hydrogens per Mg2+ cation. Metallization occurs as a result of pressure–induced band gap closure, but the density of states at the Fermi level is quite low. Around 120 GPa other stoichiometries, whose hydrogenic sublattices contain only H molecules with slightly stretched bonds, emerge as being thermodynamically stable. MgH12 and MgH16 are metallic in part as a result of the partial filling of the H2 –bands and have a high density of states at the Fermi level. Their electronic structure at various pressures can be traced back to the molecular orbital diagram of their building block, the MgH12 cluster. Despite the very different hydrogenic sublattices, both MgH4 and MgH12 are found to have similar electron phonon coupling parameters. The main reason why the of MgH12 at 140 GPa is calculated as being larger than that of MgH4 at 100 GPa, 47-60 K vs. 29-37 K assuming typical values of , is because of the larger average logarithmic frequency computed for MgH12.
Acknowledgements.
We acknowledge the NSF (DMR-1005413) for financial support, and the Center for Computational Research at SUNY Buffalo for computational support. B.A. was supported by a postdoctorate scholarship of CoHE (Turkish Council of Higher Education), and acknowledges ULAKBIM-TR-Grid for computational time.References
- Wigner and Huntington (1935) E. Wigner and H. B. Huntington, J. Chem. Phys. 3, 764 (1935).
- Pickard and Needs (2007) C. J. Pickard and R. J. Needs, Nat. Phys. 3, 473 (2007).
- Liu et al. (2012a) H. Liu, H. Wang, and Y. Ma, J. Phys. Chem. C 116, 9221 (2012a).
- McMahon and Ceperley (2011a) J. M. McMahon and D. M. Ceperley, Phys. Rev. Lett. 106, 165302 (2011a).
- Zha et al. (2012) C. S. Zha, Z. Liu, and R. J. Hemley, Phys. Rev. Lett. 108, 146402 (2012).
- Howie et al. (2012) R. T. Howie, C. L. Guillaume, T. Scheler, A. F. Goncharov, and E. Gregoryanz, Phys. Rev. Lett. 108, 125501 (2012).
- Eremets and Troyan (2011) M. I. Eremets and I. A. Troyan, Nat. Mater. 10, 927 (2011).
- Amato (2012) I. Amato, Nature 486, 174 (2012).
- Liu et al. (2012b) H. Liu, L. Zhu, W. Cui, and Y. Ma, J. Chem. Phys. 137, 074501 (2012b).
- Pickard et al. (2012) C. J. Pickard, M. Martinez-Canales, and R. J. Needs, Phys. Rev. B 85, 214114 (2012).
- Cudazzo et al. (2008) P. Cudazzo, G. Profeta, A. Sanna, A. Floris, A. Continenza, S. Massidda, and E. K. U. Gross, Phys. Rev. Lett. 100, 257001 (2008).
- McMahon and Ceperley (2011b) J. M. McMahon and D. M. Ceperley, Phys. Rev. B 84, 144515 (2011b).
- Zurek et al. (2009) E. Zurek, R. Hoffmann, N. W. Ashcroft, A. R. Oganov, and A. O. Lyakhov, Proc. Natl. Acad. Sci. 106, 17640 (2009).
- Baettig and Zurek (2011) P. Baettig and E. Zurek, Phys. Rev. Lett. 106, 237002 (2011).
- Hooper and Zurek (2012a) J. Hooper and E. Zurek, Chem–Eur. J. 18, 5013 (2012a).
- Hooper and Zurek (2012b) J. Hooper and E. Zurek, J. Phys. Chem. C 116, 13322 (2012b).
- Shamp et al. (2012) A. Shamp, J. Hooper, and E. Zurek, Inorg. Chem. 51, 9333 (2012).
- Hooper et al. (2012a) J. Hooper, B. Altintas, A. Shamp, and E. Zurek, J. Phys. Chem. C p. doi:10.1021/jp311571n (2012a).
- Zhou et al. (2012) D. Zhou, X. Jin, X. Meng, G. Bao, Y. Ma, B. Liu, and T. Cui, Phys. Rev. B 86, 014118 (2012).
- Wang et al. (2012) H. Wang, J. S. Tse, K. Tanaka, T. Iitaka, and Y. Ma, Proc. Natl. Acad. Sci. USA 109, 6463 (2012).
- Lonie and Zurek (2011) D. C. Lonie and E. Zurek, Comput. Phys. Commun. 182, 372 (2011).
- Lonie and Zurek (2012) D. C. Lonie and E. Zurek, Comput. Phys. Commun. 183, 690 (2012).
- (23) Spglib, URL http://spglib.sourceforge.net/.
- Kresse and Hafner (1993) G. Kresse and J. Hafner, Phys. Rev. B 47, 558 (1993).
- Perdew et al. (1996) J. P. Perdew, K. Burke, and M. Ernzerhof, Phys. Rev. Lett. 77, 3865 (1996).
- Blöchl (1994) P. Blöchl, Phys. Rev. B 50, 17953 (1994).
- Krukau et al. (2006) A. V. Krukau, O. A. Vydrov, A. F. Izmaylov, and G. E. Scuseria, J. Chem. Phys. 125, 224106 (2006).
- Liu et al. (2012c) H. Liu, W. Cui, and Y. Ma, J. Chem. Phys. 137, 184502 (2012c).
- Teweldeberhan et al. (2012) A. M. Teweldeberhan, J. L. DuBois, and S. A. Bonev, Phys. Rev. B 86, 064104 (2012).
- Boates and Bonev (2011) B. Boates and S. Bonev, Phys. Rev. B 83, 174114 (2011).
- Pickard and Needs (2009) C. J. Pickard and R. J. Needs, Phys. Rev. Lett. 102, 146401 (2009).
- (32) Phonopy, URL http://phonopy.sourceforge.net/.
- Giannozzi et al. (2009) P. Giannozzi, S. Baroni, N. Bonini, M. Calandra, R. Car, C. Cavazzoni, D. Ceresoli, G. L. Chiarotti, M. Cococcioni, I. Dabo, et al., Journal of Physics: Condensed Matter 21, 395502 (2009).
- Perdew and Zunger (1981) J. P. Perdew and A. Zunger, Phys. Rev. B 23, 5048 (1981).
- Karki et al. (2000) B. B. Karki, R. M. Wentzcovitch, S. de Gironcoli, and S. Baroni, Phys. Rev. B. 62, 14750 (2000).
- Methfessel and Paxton (1989) M. Methfessel and A. T. Paxton, Phys. Rev. B 40, 3616 (1989).
- Allen and Dynes (1975) P. B. Allen and R. C. Dynes, Phys. Rev. B 12, 905 (1975).
- (38) Amsterdam Density Functional Program Package, URL http://www.scm.com/.
- Andersen and Jepsen (1984) O. K. Andersen and O. Jepsen, Phys. Rev. Lett. 53, 2571 (1984).
- Vajeeston et al. (2012a) P. Vajeeston, S. Sartori, P. Ravindran, K. D. Knudsen, B. Hauback, and H. Fjellvag, J. Phys. Chem. C (2012a).
- Vajeeston et al. (2012b) P. Vajeeston, P. Ravindran, M. Fichtner, and H. Fjellvag, J. Phys. Chem. C 116, 18965 (2012b).
- Reich et al. (2012) J. M. Reich, L. L. Wang, and D. D. Johnson, J. Phys. Chem. C 116, 20315 (2012).
- Koukaras et al. (2012) E. N. Koukaras, A. D. Zdetsis, and M. M. Sigalas, J. Am. Chem. Soc. 134, 15914 (2012).
- Buckley et al. (2012) A. C. Buckley, D. J. Carter, D. A. Sheppard, and C. E. Buckley, J. Am. Chem. C 116, 17985 (2012).
- Vajeeston et al. (2006) P. Vajeeston, P. Ravindran, B. C. Hauback, H. Fjellvag, A. Kjekshus, S. Furuseth, and M. Hanfland, Phys. Rev. B 73, 224102 (2006).
- Vajeeston et al. (2002) P. Vajeeston, P. Ravindran, A. Kjekshus, and H. Fjellvag, Phys. Rev. Lett. 89, 175506 (2002).
- Tse et al. (2009) J. S. Tse, Z. Song, Y. Yao, J. S. Smith, S. Desgrenniers, and D. D. Klug, Solid State Communications 149, 1944 (2009).
- Chen et al. (2010) C. Chen, F. Tian, L. Wang, D. Duan, T. Cui, B. Liu, and G. Zou, J. Phys: Condens. Matter 22, 225401 (2010).
- Tse et al. (2007) J. S. Tse, D. D. Klug, S. Desgreniers, J. S. Smith, R. Flacau, Z. Liu, J. Hu, N. Chen, and D. T. Jiang, Phys. Rev. B 75, 134108 (2007).
- Smith et al. (2009) J. S. Smith, S. Desgrenniers, D. D. Klug, and J. S. Tse, Solid State Communications 149, 830 (2009).
- Zhang et al. (2010) C. Zhang, X. J. Chen, R. Q. Zhang, and H. Q. Lin, J. Phys. Chem. C 114, 14614 (2010).
- Nagamatsu et al. (2001) J. Nagamatsu, N. Nakagawa, T. Muranaka, Y. Zenitani, and J. Akimitsu, Nature 410, 63 (2001).
- Choi et al. (2002) H. J. Choi, D. Roundy, H. Sun, M. L. Cohen, and S. G. Louie, Nature 418, 758 (2002).
- Hooper et al. (2012b) J. Hooper, P. Baettig, and E. Zurek, J. Appl. Phys. 111, 112611 (2012b).
- Wang et al. (2010) Y. Wang, J. Lv, L. Zhu, and Y. Ma, Phys. Rev. B 82, 094116 (2010).
- (56) Pictures created using Endeavour 1.7, Crystal Impact, Bonn, Germany (2012); http://www.crystalimpact.com/endeavour [www.crystalimpact.com], E-mail: info@crystalimpact.com.
- Labet et al. (2012) V. Labet, R. Hoffmann, and N. W. Ashcroft, J. Chem. Phys. 136, 074502 (2012).
- Biller et al. (2011) A. Biller, I. Tamblyn, J. B. Neaton, and L. Kronik, J. Chem. Phys. 135, 164706 (2011).
- Paier et al. (2006) J. Paier, M. Marsman, K. Hummer, G. Kresse, I. C. Gerber, and J. G. Angyan, J. Chem. Phys. 124, 154709 (2006).
- Gagliardi and Pyykkö (2004) L. Gagliardi and P. Pyykkö, J. Am. Chem. Soc. 126, 15014 (2004).
- Wang et al. (2008) X. Wang, L. Andrews, I. Infante, and L. Gagliardi, J. Am. Chem. Soc. 130, 1972 (2008).
- te Velde et al. (2001) G. te Velde, F. M. Bickelhaupt, E. J. Baerends, C. Fonseca Guerra, S. J. A. van Gisbergen, J. G. S nijders, and T. Ziegler, J. Comput. Chem. 22, 931 (2001).