Transparency effect in the emergence of monopolies in social networks
Abstract
Power law degree distribution was shown in many complex networks. However, in most real systems, deviation from power-law behavior is observed in social and economical networks and emergence of giant hubs is obvious in real network structures far from the tail of power law. We propose a model based on the information transparency (transparency means how much the information is obvious to others). This model can explain power structure in societies with non-transparency in information delivery. The emergence of ultra powerful nodes is explained as a direct result of censorship. Based on these assumptions, we define four distinct transparency regions: perfect non-transparent, low transparent, perfect transparent and exaggerated regions. We observe the emergence of some ultra powerful (very high degree) nodes in low transparent networks, in accordance with the economical and social systems. We show that the low transparent networks are more vulnerable to attacks and the controllability of low transparent networks is harder than the others. Also, the ultra powerful nodes in the low transparent networks have a smaller mean length and higher clustering coefficients than the other regions.
I Introduction
Power law degree distribution of different kinds of complex networks, were issued by many researchers in recent years 3 ; 4 ; newman ; namaki ; Amir . Barabasi-Albert model was a basic attempt to describe this phenomena. The main concern of this model was the preferential attachment. The model showed that preferential attachment in a growing network leads to a power law degree distribution, as well as a random attachment that leads to an exponential degree distribution. In recent years, there were many different variations of this model 3 ; 4 . For describing the behavior of real systems, the main focus of these models is to reproduce the growth process in real networks. In essence, they describe the dynamical mechanisms that produce the network. The Dorogovtsev-Mendes-Samukian model is a complete form of BA model that premises the presence of the initial number of nodes 6 . Krapivsky et.al introduced a model with a nonlinear preferential attachment probability 7 . Klemm-Eguiluz (KE) proposed a model known as structured scale-free model that describes the dynamic growth of the networks based on the memory of the nodes 8 .
Despite these models, there are other methods for describing the growth process of real networks 9 ; 10 ; 11 ; 12 ; 13 ; 14 ; 15 . However, in some social structures, we observe that power (an interpretation of the effects on total network) condensates in some nodes which breaks the scale free behavior a1 ; a2 . The deviation from scale free behavior can be explained by applying some modifications to the BA model a3 ; a4 ; a5 . Such deviations were shown in Sornette’s works on power law’s distributions which he called them ”dragon kings” 16 ; 17 .
In sociology, there is a phenomenon called the Matthew effect which describes the behavior of those nodes who have power. In economy the dragon nodes are called economical power whilst in the society is called political power. The Matthew effect is the phenomenon where ”the rich get richer and the poor get poorer” 18 ; 19 ; 20 . In the networks, power can be realized by the nodes’ degree, betweenness or closeness power . In the BA model, everyone has full information about the other nodes, so information is available for them to attach to nodes with high degree. However, in social networks this kind of information, diffuses through the network itself. The information diffusion, like all other diffusions, can be subjected to some restrictions. These restrictions will cause uncomplete and non-accurate information. The rate of this diffusion can affect the structure of our network as the system grows. In the case of social networks, we found out that this rate has a crucial role that directly reflects in the structure of power in a society. Also, in economic networks, this diffusion rate has a close connection for describing the competitiveness of the economic environment.
In this paper, we propose a definition of information transparency for nodes degree distribution. Then, we make the modified preferential attachments based upon this definition. The properties of these networks based on their different diffusion rates, are also studied.
II Modified Model
The assumption of the preferential attachment in BA model is based on adding a new vertex which attaches to vertex i with a probability that depends on the degree , so:
| (1) |
The BA model assumes the availability of the nodes degree information for each new node introduced to the system. However, in the modified model, we consider that the new vertex first connects to node randomly without any prior information about the degree of that node. Then, it finds out about other nodes’ degree through the node . Since the degree known by node has passed through several edges, it does not express the exact degree of the other nodes. This is because the information about the nodes’ degree changes ”” times, each time if passes an edge. We call this an information diffusion. Hence, we introduce the term which is the degree of node viewed by (the node ’s degree has been diffused through the network before reaching node ). is that has diffused times:
| (2) |
which is the shortest path length between nodes and and the new node connects according to connectivity (Usually, most reliable information obtained from a node, are information which have come from the shortest path). So the probability that a new node which is connected randomly to node can make a connection to node as:
| (3) |
Then each new node makes new edges to remain in the network. With the aid of this model, various deviations from scale free behavior can be explained by different values of diffusion rate. It is obvious that, r= will result in a randomly growing graph and r= represents the BA model. All above steps could be summerize as follows:
1) Start with a small core network. (In our simulation we
start with a -clique which is the edge number that connects
the new node to the network.)
2) Choose a random node .
3) Calculate the , which is the node
degree’s viewed by node .
4) Connect a new node with edges to the other nodes, with
preferential attachment according to .
5) Refresh s and s.
6) Return to step (2).
A schematic example is presented to clarify this model. A new person in town does not have accurate information about important (well-known) people of the city. He may come to a person randomly and ask him about the others. His judgment about the others is crucially dependent on how accurateness of the information he had gathered from the people he had met. If we have a perfect transparency in information, i.e. (), then accurate information to make connections throughout the network is available. This network growth follows BA model where the degree distribution posses a power-law behavior. However, with perfect non-transparency in networks’ information delivery, i.e. , he has no useful information about anyone and connects randomly to another node in the network, which means random growth and exponential behavior in nodes’ degree distribution. Our results show that, between these two limits, there are rates that the networks with these rates have nodes with amazingly high degree which is interpreted as emergence of ultra powerful hubs in social networks. We consider edges between nodes to be homogenous which means they are all as of the same kind with the same diffusion rates.
III Results & discussion
The main purpose of this paper is to study the effect of information distortion in the construction of networks. Based on the above model, we can construct different networks in respect to different diffusion rates (””) where is the parameter that makes this distortion in information delivery. If changes from 1 to 0, it makes the nodes’ degree to show lesser than the actual nodes degree. On the other hand, if changes from 1 to higher values, it causes exaggeration and overestimation of the nodes degree.
In Fig.(1), we have developed networks based on this modified model for some different diffusion rates. It is obvious that for the network is a random graph and for it is the same as the BA model. In some powerful hubs emerge and in observe random behavior again.
In Fig.(2) we have depicted the degree distribution for different diffusion rates, based on the assumption of growing the network by adding one by one nodes with number of new edges, which are added for each new node. We have added nodes till (Fig.2 a, d, b, e)and for showing that the finite size effect is not an important matter in our growing process, we have shown results for (Fig.2 c, f).
It is observed by increasing the diffusion rates form zero to one, the degree distribution moves from a random exponential network to a Barabasi-Albert power law model. Between these two points, there are some diffusion rates in which the networks with these rates have nodes with a high degree that cause deviation in the networks degree distributions from the power law behavior. is the state of no transparency in information delivery. This is equivalent to the state of random growing network with exponential degree distribution.
is the state with a complete and accurate transfer of information throughout the network which reproduces the BA model with power law degree distribution.
In the low diffusion rates, lower than , we still observe exponential behavior for the majority of nodes with lower degree. Even though we have random behavior in the rest of the network with maximum degree about , the emergence of nodes with amazingly high degree about is a noticeable fact, as the rate goes above . As the diffusion rate increases to , the network starts to show a power-law behavior while the nodes with ultra high degrees are still present. As it is obvious, there is a power law behavior in the beginning of some distributions (by eliminating the powerful nodes from the distribution), where the slope is in , and by increasing to , it decreases to . Either every where the distributions do not have the power-law behavior.
If we continue to increase the diffusion rate, the model gets more and more closer to the BA model. After that, we studied the networks with . If we continue to increase the diffusion rate above as shown in Fig.2 (b, e), it can be seen that the powerful hub is disappearing as the rate goes up, and the whole system shifts towards an exponential behavior in a connectivity structure. In other words, the system shifts to the random growth as the diffusion rate increases above . In social interpretation, the network has experienced exaggeration of information which results in a random behavior. So, this shows that the fake information in systems is equivalent with no information.
In essence, there are four distinct parts for the proposed model: non-transparent, low transparent, perfect transparent and exaggerated regions.
By considering different information diffusion rates, different social, economical and political situations involved in information delivery of societies can be modeled. The emergence of high degree nodes is interpreted as the emergence of powerful hubs (high power nodes which are dominant in size and importance) in social networks as a result of low-transparency in information delivery.
Information is not only a tool for being dominant, but is the power itself. In some cases, information sources, adjust the diffusion rate on purpose in favor of a party. These are societies with the power, condensed in these monopoles as they try to maintain the power with the aid of censorship or supportive actions from government. Some famous examples of these structures are undemocratic governments, where power condensates in the hands of a powerful political elite group. Also, because of the low-transparent competitive environment, sometimes firms emerge as central nodes in economic networks. With total transparency in information delivery, which leads to societies without monopolies, it can be considered as an ideal model. This is the perfect case and most of the times, real phenomena are deviated from this ideal model.
As the diffusion rate increases to values above one, the new in town is in a situation of information overflow, which will lead him to the same result of having no or less accurate information. In other words, having no information is the same as having huge amount of information which is not accurate or is exaggerated. In real cases, societies are sometimes bombard with propaganda which can totally restructure power systems to other random structures, the case that happens in some government structures. Some firms such as medias, which controll the amount of informal statements in societies, can restructure the power system to their desirable shape by controlling the amount or accuracy of the information.
In order to have a better sense about the model, we have plotted Fig.(3a) which shows the maximum degree of developed networks by the model for different diffusion rates and the average of this maximum degree perceived by the other nodes. This perception shows what is the opinion of the other nodes about the maximum degree in the network on average or what is their estimation of the size of the powerful hub. The figure is in logarithmic scale, and the vertical error bars show the diversity of opinion about the size of this hub.
III.1 General network properties
The emergence of nodes with high degree, will decrease the mean length, and increase the clustering coefficients of low degree nodes connected to them as shown in Fig.(3b,c). The decrease in the mean length, as a result of emergence of ultra powerful hubs, is explained as a consequence of connection of most nodes to one or more nodes with ultra high degree which act like bridges in the network (Fig.(3b)). In economic and social networks, the mean length can show the speed of diffusion of crises among nodes of the system. Where this item is very small, it shows that the crisis can diffuse very fast in the network. As we can see in low transparent region, the mean length is much smaller than the other regions and we expect that the diffusion of any event among nodes has high speed. The increase in the average of the clustering coefficient of the nodes, even in nodes with low degree, is the result of the connectivity to powerful hubs as a dense core. The mean clustering coefficient of the economic and social networks, shows the remaining probability of the crisis in different groups of clusters for a long time. In the low transparent region, it is obvious that the mean clustering coefficient is much larger than the other regions in Fig.(3c).
III.2 Network robustness
Here comes a peculiar question that whether a controlled censorship really works in keeping the powerful hubs from falling down. If these ultra powerful hubs encounter failure for any reason, will the network face a serious break down? To answer this question, we made attacks on the networks with different diffusion rates. Attack means removing nodes from the network due to some defined rules. There are several types of attacks attack . We attack network nodes on their degree ranks. We eliminate nodes from the top degree to the bottom, and after each step, evaluate the giant component size and the mean size of the other components in the network attack . Results have been depicted in Fig.(3d) and Fig.(3e) for networks with different diffusion rates. As we can see, the giant component size and the average size of the other components are more sensitive to the attacks in the low transparent networks. It is well known that a random network is more robust than a scale free one against targeted attacks attack . But, the main finding is that the low transparent networks (), are more fragile, in comparison to both random and scale-free networks.
The giant component size decreases rapidly in the low transparent networks, compared to other networks. In other words, in scale free models, the society is less dependent to a special person or node. But in low transparent systems, networks are highly dependent on special nodes which are the center of connectivity.
In economic networks, there are some powerful hubs that are considered to be ”too big to fail” taleb ; stern ; wesel . In essence, emergence of these hubs is the result of low transparent competitive environments. These financial institutions are so large and so interconnected that their failure will be harmful to the economy. This concept results in the belief that these firms should become recipients of beneficiary financial policies from governments or central banks to keep them alive. It is thought that these firms have high-risk and are able to leverage these risks based on the supportive actions. This term has emerged as an important concept since in global financial crisis, that bankruptcy of some giant companies has systemic effects on the total economy.
III.3 Controllability
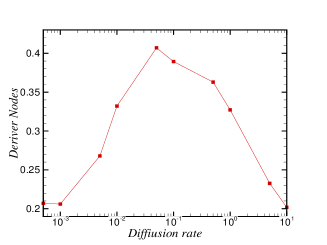
In real world, if we want to control a system, one method is to control the set of driver nodes, which driving them by an external signal results to control the systems’ dynamic. Liu et. al used a method, that was named maximum matching, for finding the minimum number of driver nodes to attain full control of a complex network with a dynamic behavior in its nodes liu . In this paper, we assume that our proposed networks are directed from the previous to the latest nodes. Fig.(3f) shows that the number of the driver nodes that must be controlled in low transparent region is much more than the other regions, and in essence this makes more cost for controlling the network.
In low transparent networks, the social capital comes from the powerful hubs and the other nodes do not have common perceptions about each other. So, controlling these networks forces more cost to the powerful hubs. In low transparent societies, sometimes social cohesion has different structures based on relationships between powerful hubs and the other nodes in the social network. Most of the cohesion is because of the existence of the hubs. So in these networks, structural cohesion (the minimum number of members who, if removed from a group, would collapse the group m ) is smaller than the other networks.
IV Conclusion
In this paper we have presented a new method for generating social networks. In this modified model, we have emphasized on the diffusion rates as a mean for measuring the information transparency in social and economical systems. The main interesting features of the model is symmetry breaking of nodes degree due to both exponential and power law distributions, despite of homogeneous primary conditions. This model shows the emergence of different groups of networks based on the different types of diffusion rates. This view can model the reality of the social and economical systems. In these systems, there are ultra powerful hubs that leads to deviation from power law behavior and scale free concept. We have computed the mean length and the clustering coefficients of the networks based on different diffusion rates. It can be seen that there are indirect relations between the diffusion rates and the mean lengths, but there are direct relations between the clustering coefficients and the diffusion rates. Also, we investigated the behavior of the networks’ structures with respect to the attack on the powerful hubs, and was seen that the networks with low diffusion rates are more sensitive to the attacks. Then, we investigated the controllability of the networks. Our results showed that the networks in low transparency region have more driver nodes and are harder to control than the other regions.
Acknowledgements.
The authors would like to thank Shahin Rouhani for his very helpful comments and discussions, and Sara Zohoor and Soheil Vasheghani Farahani for helping to edit the manuscript.References
- (1) Barabási A, Albert R (1999) Emergence of scaling in random networks. Science 286: 509 512.
- (2) Albert R, Barabási A (2002) Statistical mechanics of complex networks. Rev. Mod. Phys. 74: 47 97.
- (3) A. Namaki, A. H. Shirazi, R. Raei, G. R. Jafari, Network analysis of a financial market based on genuine correlation and threshold method, Physica A 390, 3835-3841 (2011).
- (4) Roohi A. A., Shirazi A. H.,Kargaran A.,Jafari G. R., Local Model of a Scientific Collaboration in Physics Network Compared with the Global Model, Physica A 389 (2010) 5439-5446.
- (5) Newman MEJ (2003) The structure and funtion of complex networks. SIAM Review 45: 167-256.
- (6) Dorogovtsev,S.N., Mendes,J.F.F., Samukhin,A.N., (2000) Structure of growing networks with preferential linking. Phys. Rev. Lett. 85: 4633.
- (7) Krapivsky PL, Redner S, Leyvraz F (2000) Connectivity of growing random networks. Phys. Rev. Lett. 85: 4629.
- (8) Klemm, K., Eguiluz, V.M., (2002) Highly clustered scale-free networks. Phys. Rev. E 65: 36123.
- (9) Vazquez A, Flammini A, Maritan A, Vespignani A (2003) Modeling of Protein Interaction Networks. Complexus 1: 38-44.
- (10) Holme, P., Kim, B.J., (2002) Growing scale-free networks with tunable clustering. Phys. Rev. E 65: 26107.
- (11) Jin, E.M., Girvan, M., Newman, M.E.J., (2001) Structure of growing social networks. Phys. Rev. E 64: 46132.
- (12) Davidsen, J., Ebel, H., Bornholdt, S., (2002) Emergence of a Small World from Local Interactions: Modeling Acquaintance Networks. Phys. Rev. Lett. 88: 128701.
- (13) Sole RV, Pastor-Satorras R, Smith E, Kepler TB (2002) A model of large-scale proteome evolution. Advances in Complex Systems 5: 43-54.
- (14) Ferrer i Cancho, Sol RV (2003) Optimization in complex networks. Statistical Mechanics of Complex Networks. Lecture Notes in Physics, Springer (Berlin) 625: 114-125.
- (15) Valverde S, Cancho RF, Sole RV (2002) Mixing patterns in networks. Europhys. Lett. 60: 512 517.
- (16) Bianconi G and Barabasi AL, Bose-Einstein condensation in complex networks, Phys. Rev. Lett. 86, 5632 (2001)
- (17) Lambiotte R and Ausloos M, Growing network with j-redirection, Europhys. Lett., 77 (2007) 58002.
- (18) Krapivsky PL and Redner S, Network Growth by Copying, Phys. Rev. E 71, 036118 (2005).
- (19) Valverde S and Solé RV, Logarithmic growth dynamics in software networks, Europhys. Lett. 72, 858-64 (2005).
- (20) Evans TS and Saramaki JP, Scale Free Networks from Self-Organisation, Phys.Rev.E 72, 026138 (2005).
- (21) Sornette D (2009) Dragon-Kings: Black Swans and the Prediction of Crises. International Journal of Terraspace Science and Engineering 2(1): 1-18.
- (22) Sornette D (2002) Predictability of catastrophic events: material rupture, earthquakes, turbulence, financial crashes and human birth. Proceedings of the National Academy of Sciences USA 99: 2522-2529.
- (23) Merton R (1968) The matthew effect in science. Science 159: 56-63.
- (24) R. Merton (1988) The matthew effect in science, II: Cumulative advantage and the symbolism of intellectual property 79: 606-623.
- (25) Gladwell, Malcolm, Outliers: The Story of Success (2008). Little, Brown and Company.
- (26) Robert A. Hanneman and Mark Riddle (2005) Introduction to social network methods, Chapter 10, online version.
- (27) Albert R, Jeong H, Barab si AL (2000) Error and attack tolerance of complex networks. Nature 406: 378-482.
- (28) Taleb N, Tapiero C (2010) Risk externalities and too big to fail. Physica A 389: 3503-3507.
- (29) Stern Gary H, and Feldman Ron J (2004) Too big to fail. Washington, DC: Brookings Institution Press.
- (30) Wessel David (2009) Three Theories on Solving the ’Too Big To Fail’ Problem. The Wall Street Journal, October 28.
- (31) liu Y, Soltine J, Barabasi A (2011) Controllability of complex networks. Nature 473: 167-173.
- (32) Moody J, Douglas R (2003) Structural Cohesion and Embeddedness: A Hierarchical Concept of Social Groups. American Sociological Review 68(1): 103 127.
- (33) NWB Team. (2006). Network Workbench Tool. Indiana University, Northeastern University, and University of Michigan, http://nwb.slis.indiana.edu
a) 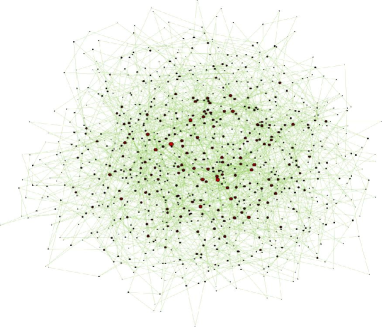 b)
b)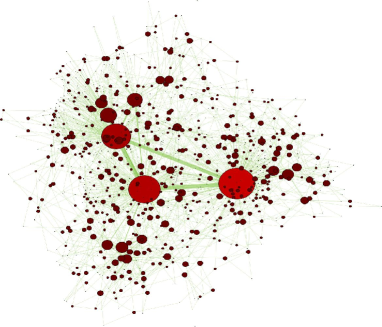
c) 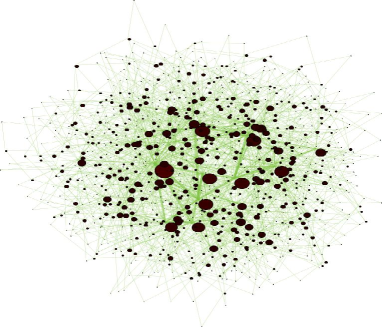 d)
d) 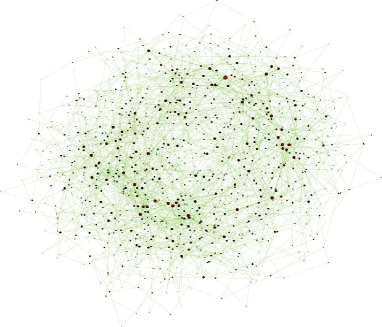
a)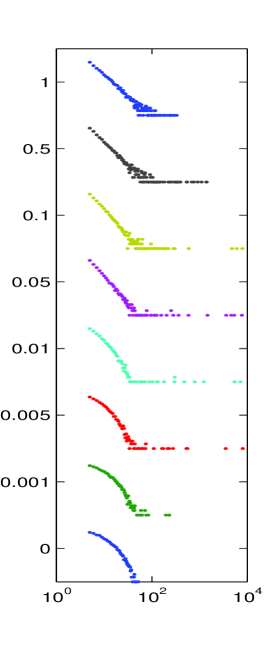 b)
b)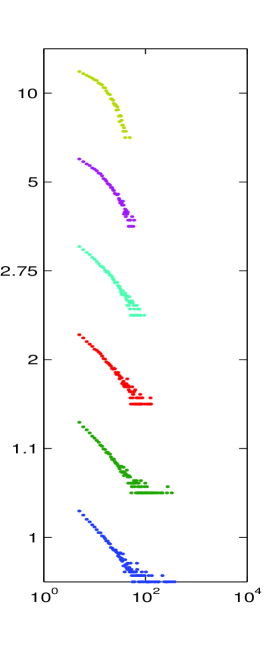 c)
c)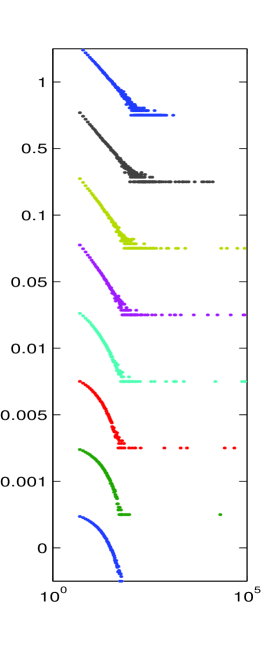
d)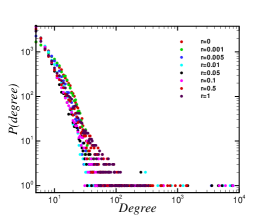 e)
e)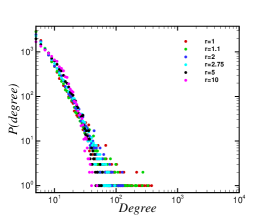 f)
f)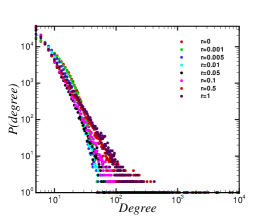
a) 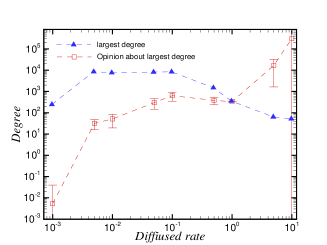 b)
b)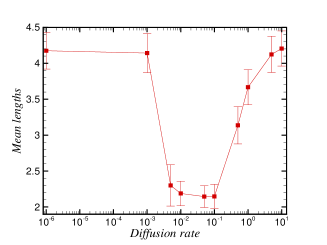 c)
c)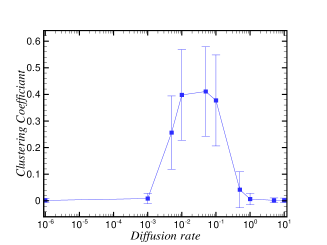 d)
d)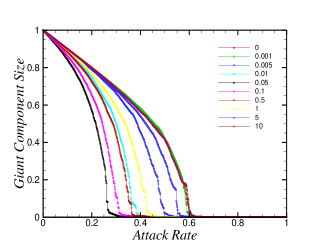 e)
e)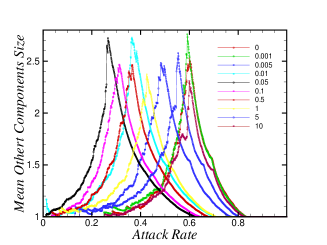 f)
f)