The ACS Nearby Galaxy Survey Treasury XI. The Remarkably Undisturbed NGC 2403 Disk
Abstract
We present detailed analysis of color-magnitude diagrams of NGC 2403, obtained from a deep (m28) Hubble Space Telescope (HST) Wide Field Planetary Camera 2 observation of the outer disk of NGC 2403, supplemented by several shallow (m26) HST Advanced Camera for Surveys fields. We derive the spatially resolved star formation history of NGC 2403 out to 11 disk scale lengths. In the inner portions of the galaxy, we compare the recent star formation rates (SFRs) we derive from the resolved stars with those measured using GALEX FUV + Spitzer 24 fluxes, finding excellent agreement between the methods. Our measurements also show that the radial gradient in recent SFR mirrors the disk exponential profile to 11 scale lengths with no break, extending to SFR densities a factor of 100 lower than those that can be measured with GALEX and Spitzer ( M⊙ yr-1 kpc-2). Furthermore, we find that the cumulative stellar mass of the disk was formed at similar times at all radii. We compare these characteristics of NGC 2403 to those of its “morphological twins,” NGC 300 and M 33, showing that the structure and age distributions of the NGC 2403 disk are more similar to those of the relatively isolated system NGC 300 than to those of the Local Group analog M 33. We also discuss the environments and Hi morphologies of these three nearby galaxies, comparing them to integrated light studies of larger samples of more distant galaxy disks. Taken together, the physical properties and evolutionary history of NGC 2403 suggest that the galaxy has had no close encounters with other M 81 group members and may be falling into the group for the first time.
Subject headings:
galaxies: individual (NGC 2403) — galaxies: stellar populations — galaxies: spiral — galaxies: evolution1. Introduction
Most of the star formation occurring in the present epoch takes place in galaxy disks (e.g., Williams et al., 2011), but most disks are difficult to study in detail due to the complexities of their bulges (e.g., Byun & Freeman, 1995). However, some spirals are nearly bulgeless, making them excellent laboratories for the study of star formation and disk growth in relatively undisturbed disks. While theoretical models suggest that post-merger galaxies can have disk fractions of up to 90% (Hopkins et al., 2009a, b), the delicate construction of these bulgeless galaxies is consistent with long-term evolution that lacks strong recent tidal interactions or mergers, which tend to disturb such structure (Barnes & Hernquist, 1992).
While bulgeless disks appear to be ideal for studying undisturbed disk evolution, most are too distant to study in great detail. While integrated color or spectral profiles (e.g., MacArthur et al., 2003; Yoachim et al., 2012) provide large samples and have yielded great insight, significant additional knowledge can be gained by studying nearby systems. In the nearby universe (D4 Mpc), there are three nearly identical bulgeless systems (M 33, NGC 300 and NGC 2403) whose stellar populations can be resolved well below the tip of the red giant branch (TRGB). With resolved photometry of these systems, we can compare the detailed evolution of these star-forming disks. Such comparative studies offer the opportunity to search for clues to the processes which drive the secular evolution of galaxy disks.
NGC 2403 is a SAB(s)cd galaxy (de Vaucouleurs et al., 1991) with an inclination of 63∘ (Fraternali et al., 2002), position angle of 124∘ (de Blok et al., 2008), a distance modulus of 27.5 (3.2 Mpc, Tammann & Sandage, 1968; Freedman & Madore, 1988; Dalcanton et al., 2009; Radburn-Smith et al., 2011), and scale length of 2 kpc (Cepa et al., 1988; Barker et al., 2012, hereafter B12). It lies on the outskirts of the M 81 group of galaxies, more than a Mpc away (projected distance) from M 81.
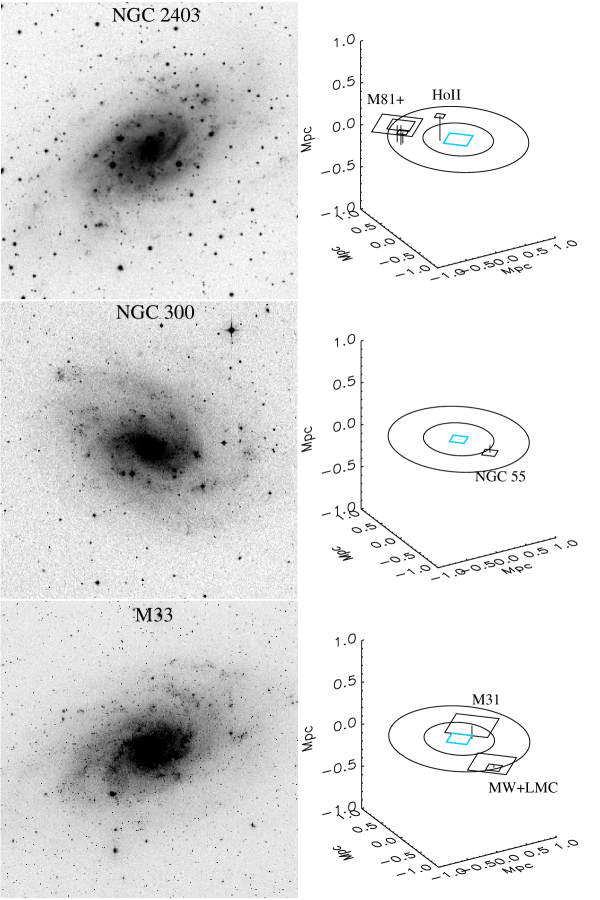
In spite of their similarities to NGC 2403 in morphology, metallicity, star formation rate (SFR), gas content, and luminosity (summarized in Table 1), M 33 and NGC 300 display some interesting differences. The data in the table show that NGC 300 is a somewhat scaled-down version of the other two, with a smaller scale length and lower luminosity. However, the most noticeable differences are in their environments, which we show in Figure 1. M 33 is relatively close to M 31, with which it has likely interacted in the past (e.g., McConnachie et al., 2010; Bernard et al., 2012); M 33 also shows evidence for recent weak tidal interactions (tidal index = 2.0, Karachentsev et al., 2004), consistent with its warped Hi disk (Rogstad et al., 1976; Deul & van der Hulst, 1987; Corbelli & Schneider, 1997). NGC 300 is in the foreground of the Sculptor Group (Karachentsev et al., 2003), and is relatively isolated compared to M 33. Still, it does form a gravitationally bound pair with the dIrr galaxy NGC 55 (Tully et al., 2006) which is comparable in luminosity. In addition, its Hi disk shows a severe warp in its outer parts (Puche et al., 1990) which may be due to the proximity of NGC 55. Of the three morphologically analogous galaxies, NGC 2403 is the most isolated as it is an outlying member of the M 81 group, with no nearby massive neighbors. The Hi distribution and velocity field of NGC 2403 is extremely symmetric (Fraternali et al., 2001, 2002; de Blok et al., 2008), showing no evidence of recent interactions. Herein, we explore the possibility that these environmental differences may be responsible for differences not only in their disk structures, but also in their detailed formation histories.
The properties of the three nearby bulgeless systems suggest that local environment may play an important role in the formation of disk breaks, although the role of environment in the formation and evolution of disk breaks is a complex problem. Empirical studies of breaks in field and cluster samples find no differences between the two (Maltby et al., 2012; Erwin et al., 2012). If the environment is responsible for disk breaks, it is unclear why there would be many unbroken disks in galaxy clusters. However, comparing the cluster environment to the field environment may not be as sensitive as comparing the local environments of individual field galaxies. In our sample, the disk with the closest massive companion (M 33) has a clear break, while those without a massive companion do not show such a break (Bland-Hawthorn et al., 2005; Ferguson et al., 2007; B12). Thus, among these three field galaxies, local interactions may play a significant role in the production of breaks. The influence of a large cluster may still work to smooth over disk breaks. The cluster environment clearly has profound effects on the evolution of disks, as ram pressure stripping may prematurely truncate the outer disk gas supply, inducing late-type disks to transform into S0 disks.
At the same time, the effects of radial migration of stars due to internal dynamics can significantly affect the production of disk breaks (Roškar et al., 2008). The lack of disk breaks in NGC 2403 and NGC 300 is not a sensitive indicator of the presence or absence of radial migration. As seen in the simulations presented by Radburn-Smith et al. (2012, see their Figure 2), dynamical effects such as radial migration together with ongoing star formation in the outer disk can act to smooth out an initial disk break on short timescales. Thus we cannot distinguish between a slight break that has been quickly smoothed over by radial migration, or no break with little radial migration. This intricate interplay of processes is also explored in the recent study of Roediger et al. (2012), who show that no single model of radial migration, gas accretion, or warping can account for the radial distribution of stellar populations and luminosity in the disk galaxies in Virgo. Thus, the current picture is complex, with no single dominant process responsible for the appearance of the disk break, or its subsequent evolution. Our comparison of local disks will add some detailed constraints to this difficult problem.
Furthermore, there is a possible environmental dependence on the relationship between the gas disk structure and disk breaks within our sample. Studies of larger samples of disks show evidence that breaks are associated with Hi warps. Edge-on disks that show breaks also tend to have warped Hi disks, whereas those without breaks tend to have undisturbed Hi disks (van der Kruit, 2007). Therefore, the formation of Hi warps and stellar breaks may be related. Specifically, they could both be the result of the outer disk forming from late infall of high angular momentum gas or the result of gravitational interactions with other galaxies (van der Kruit, 2007). The most isolated pure disk in the Local Volume (NGC 2403) shows no break and no warp in Hi. The disk with a single relatively distant low-mass companion (NGC 300) shows no break, but has a warped Hi disk. The disk with the most nearby massive companions has a clear break and a warped Hi disk. This sequence is consistent with disk breaks being induced by tidal interactions that are strong enough to strip outer gas and/or funnel it to smaller radii. It will be of interest to check the agreement of this sequence with a larger sample when more pure disks have detailed constraints on their evolution and environment, including precise TRGB distances and reliable star formation histories (SFHs), as the galaxies included here.
Finally, differences in the evolutionary history of the disks show hints of environmental effects. Detailed studies of M 33 and NGC 300 reveal significant differences in SFH derived from resolved stellar photometry (Barker et al., 2007; Williams et al., 2009a; Barker et al., 2011; Gogarten et al., 2010). In M 33, the stellar populations show an age inversion at the M 33 disk break (Williams et al., 2009a), while the NGC 300 populations show no significant trends with radius (Gogarten et al., 2010). Existing studies of NGC 2403 hint that its history may be more similar to that of NGC 300 than to that of M 33, possibly indicating a mostly isolated past. Recent stellar populations studies suggest that star formation is present out to at least 6 scale lengths (Davidge, 2007), but these studies have been mainly from the ground (Davidge & Courteau, 2002; Davidge, 2003, 2007; B12), although B12 augment their ground-based data with a few ACS archival fields. B12 found no evidence for a metallicity gradient in the old stellar population. This detailed study also found evidence for a very extended stellar component in the far outer disk, beginning at 8 scale lengths.
Herein, we focus on HST observations to probe the disk evolution of NGC 2403 in spatial and temporal detail similar to HST studies of M 33 (Barker et al., 2007; Williams et al., 2009a) and NGC 300 (Gogarten et al., 2010). Recently, the ACS Nearby Galaxy Survey Treasury (ANGST, Dalcanton et al., 2009), and the GHOSTS Surveys (Radburn-Smith et al., 2011) obtained significant amounts of HST imaging of the outer disk of NGC 2403. These observations, along with archival imaging of the inner disk, provide the deepest resolved stellar photometry ever obtained in NGC 2403. We analyze all of these HST data sets homogeneously to measure the SFH as a function of radius in NGC 2403. With this new information, we can now compare the structural evolution of NGC 2403, NGC 300, and M 33, and explore the role that environment may have played in producing their differences. We assume the distance, inclination angle, and position angle reported above for all conversions between location and galactocentric radius.
2. Data Acquisition and Reduction
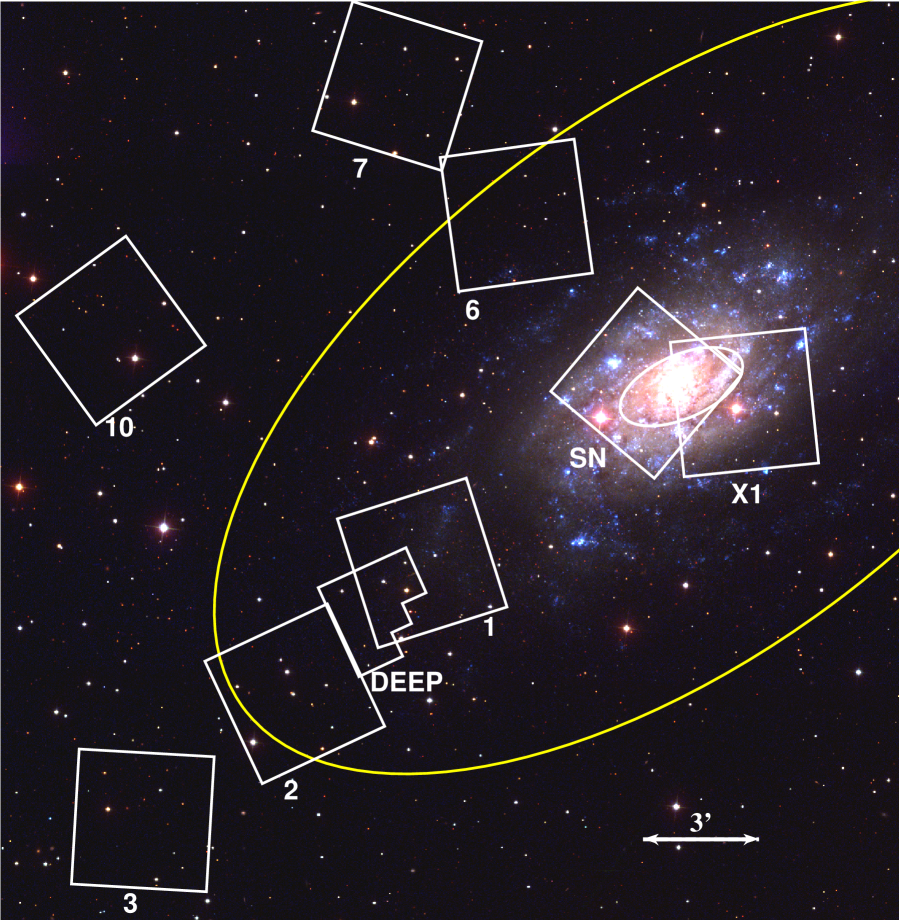
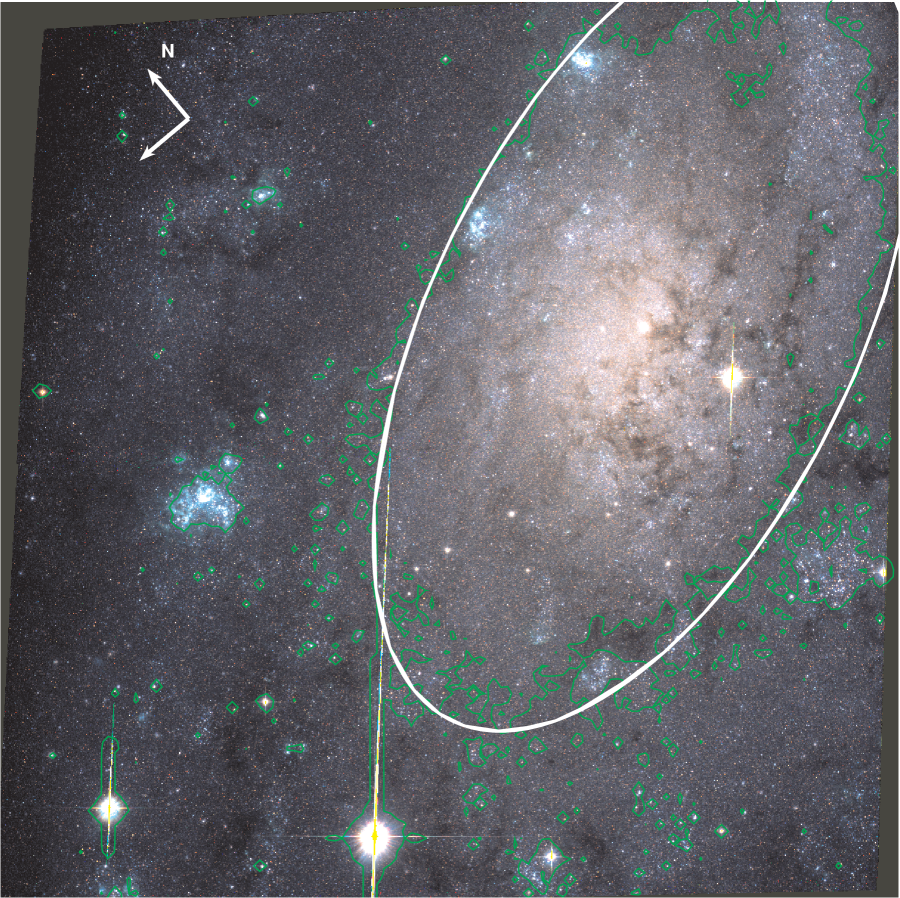
We observed a field at large radius along the major axis of NGC 2403 as part of the ANGST survey from 2007-11-26 to 2007-12-01. The field was observed with WFPC2 after the failure of ACS. The telescope was pointed to R.A.(J2000)=114.528667, decl.(J2000)= 65.504639 with PA_V3 fixed at 69.995∘. The footprint of the field (DEEP) is shown on a color image produced from Sloan Digital Sky Survey data in Figure 2. To maximize the depth, full-orbit exposures were obtained. We took 12 such exposures through the F606W filter and 23 such exposures through the F814W filter. These totaled 32400 s of exposure in F606W and 62100 s of exposure in F814W.
We have also analyzed all relevant archival HST observations, which included several GHOSTS (PI: de Jong; PID: 11613; Radburn-Smith et al., 2011) fields along the major and minor axes, as well as the 2 fields near the center of the galaxy (SN-NGC2403-PR, PID: 10182, PI: Filippenko, Filippenko, 2004; NGC2403-X1, PID: 10579, PI: Roberts, Roberts, 2005). The exposure times, filters, and depths of these data are given in Table 2 (in order of increasing distance from the galaxy center), and their footprints are shown in Figure 2 (and labeled with a shortened version of their name).
2.1. Photometry
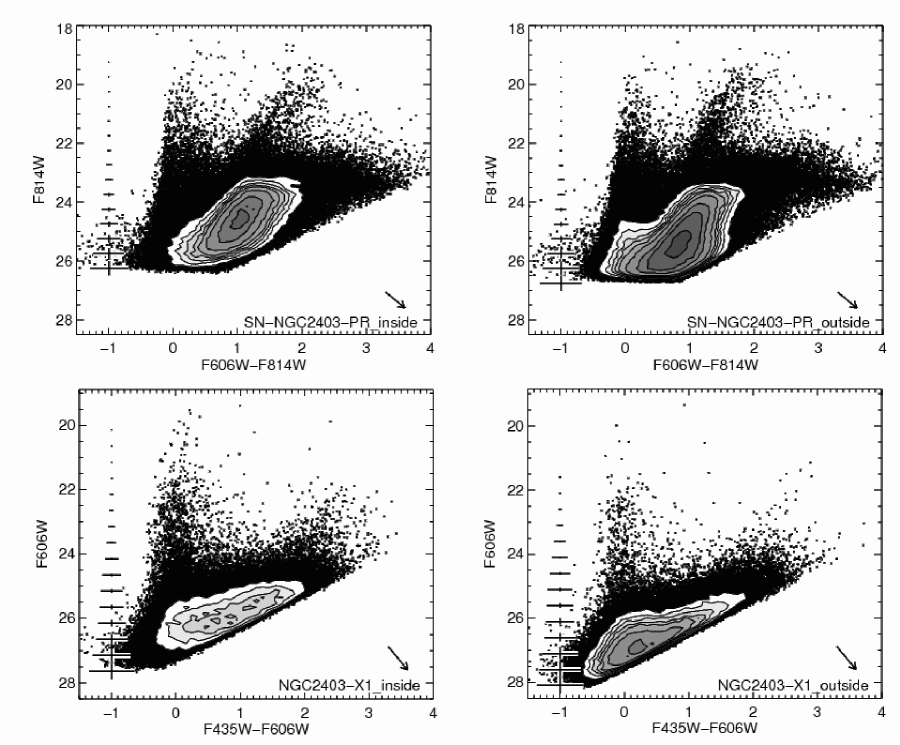
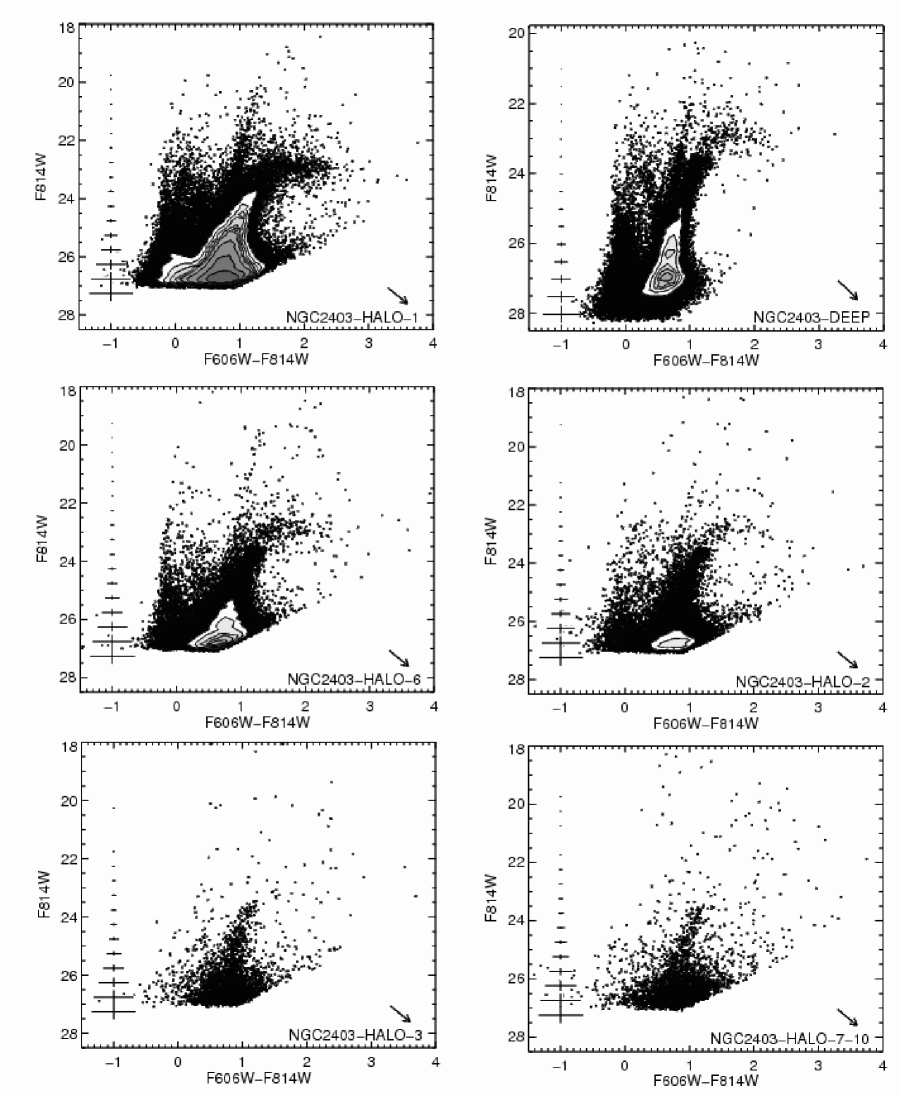
All photometry and artificial star tests were carried out as described by the ANGST project paper (Dalcanton et al., 2009). Briefly, all WFPC2 photometry was derived with the package HSTphot (Dolphin, 2000) and ACS photometry was measured using DOLPHOT, a general-purpose stellar photometry package based on HSTphot that includes an ACS-specific module. Photometry was culled based on signal-to-noise and the quality parameters of sharpness and crowding, as described in Dalcanton et al. (2009). The final color-magnitude diagrams (CMDs) for our fields are shown in Figures 3 and 4.
We also ran several hundred thousand artificial star tests for each field. In each test, a fake star of known color and magnitude was inserted into the data, and the photometry was rerun to attempt to recover the photometry of the fake star. These tests allowed us to determine the recovery fraction and photometric errors as a function of color and magnitude. With this large number of fake stars, we covered the full magnitude and color space of the real photometry, including testing stars 1.5 mag below our limiting magnitude to assess the likelihood of scattering faint stars into our sample. Half of the stars were randomly distributed in the relevant color-magnitude space (the space covered by our real photometry), and the other half followed the color-magnitude distribution of the observed stars. This sampling provided statistics for portions of the CMD where no stars were observed as well as providing the best statistics for the areas of the CMD where the most stars were observed.
These tests showed that photometric errors in the uncrowded outer fields were dominated by counting statistics, and stayed below 0.1 mag brightward of 1 mag above the completeness limit, reaching a few tenths of a mag by the completeness limit. In the innermost regions (Figure 3), our photometric errors were dominated by crowding, and were therefore larger, reaching 0.1 mag 2 mag above our completeness limit, and reaching 0.5 mag at the completeness limit. The completeness limits given in Table 2 provide the magnitude where the recovered fraction of artificial stars was 50%.
2.2. Modeling the Color-Magnitude Diagrams
We fit the CMDs for each of the fields in our study using the software package MATCH (Dolphin, 2002). The overall technique for deriving the SFH using CMD fitting, as it has been applied for all ANGST papers, is described in detail in Williams et al. (2009b). Output star formation rates are renormalized to a Kroupa (2001) initial mass function. We derived the best-fitting mean extinction to the full field with the distance fixed to the value found in Dalcanton et al. (2009). With these distance and extinction values applied, we then run a series of 100 Monte Carlo (MC) tests. In each of these tests, a CMD is derived from the SFH that gave the best fit to the data, including errors and completeness from the artificial star tests. This test CMD is then fitted to determine the precision with which the input SFH was recovered. The distribution of results from these fits provides a reliable estimate of the uncertainty of our SFH measurement given our data quality.
We have updated our method of estimating uncertainties compared to Williams et al. (2009b). To assess the systematic errors due to model deficiencies, we performed fits to our MC realizations of the best-fitting model solution with the models shifted in bolometric magnitude and effective temperature (Dolphin, 2012). These shifts account for the uncertainties due to any potential systematic offsets between the data and models. The uncertainties derived from these tests for the inner fields represent the systematic uncertainties in the dusty, highly crowded regions. Those for the deep field represent the systematics in the less crowded outer disk.
These systematic uncertainties due to deficiencies in the models will affect all of our fits in the same manner, and therefore are relevant only for comparisons between our measurements and those from other techniques. Because all of our data were analyzed homogeneously, these systematic uncertainties are not relevant for comparisons between different fields in our data set. To estimate the relative uncertainty for differences between two fields analyzed using the same models, we need only to assess the random errors due to the depth and size of the stellar sample. Therefore, for the ACS fields outside of the central 2 fields, our MC error analysis did not include shifts between the models and data, and the uncertainties show the significance of relative differences between the observed fields.
When analyzing the densest, inner portions of the galaxy, we divided both of the two innermost fields into 2 regions each: the most crowded and dusty innermost region and the remainder of the field. This division is shown as the white ellipses in Figures 2 and 5, and corresponds roughly to an -band surface brightness of 21.2 mag arcsec-2. Separating the fields in this way allowed us to isolate the portion of the galaxy most strongly affected by crowding and differential reddening. Inside of this ellipse, the median inclination-corrected galactocentric radii were 1.2 kpc for the SN field and 1.5 kpc for the X1 field; outside, they were 2.6 kpc and 2.9 kpc for the two fields, respectively.
We found that photometry in the inner regions was 0.5 mag shallower than in the outer regions of these fields, and shows clear evidence for differential extinction. We therefore allowed for differential extinction across the regions by introducing a spread in the model colors and magnitudes along the reddening line. The amplitude of this spread was varied along a sequence of values ranging from 0 to 2 magnitudes. The best fitting model out of this sequence was then chosen. For the central region, the best fitting value corresponded to differential extinction of 1.6 magnitudes in both fields (i.e. the stars were scattered along the reddening line by 1.6 mag). The outer region of the X1 field had a best-fitting value of 1.0 for the differential extinction, and that of the SN field was 0.8.
Unfortunately, even including these effects in the models when fitting these dusty and crowded regions, our MC uncertainty measurements showed that we could not constrain the fraction of old stars, nor their metallicity distribution, in the inner galaxy. Therefore, to fit the CMDs of these inner regions reliably for the young populations, we assumed that their old stellar populations (10 Gyr) matched those of the DEEP field, with the SFRs for these ages simply scaled by distance from the center assuming a scale length of 2.0 kpc. This assumption is reasonable if the stars are well mixed on 10 Gyr timescales. We fixed the model for the old stars to these scaled values only when fitting the CMDs of the different annuli of the inner 2 fields (X1 and SN). By fixing the density and metallicity of old stars in these innermost regions, we leveraged knowledge gained from our deeper data to achieve a more reliable result for the total populations from the dusty and crowded data. Due to the large differential reddening values, which substantially increased our uncertainties, we used coarse age resolution to limit the SFR uncertainties to less than 100%. In the end, we used the fits to these dusty and crowded inner regions of the disk only to constrain the mean rate of star formation over the past 200 Myr. Our results for this quantity proved to be robust, as demonstrated by the agreement for the common region inside of the F814W=21.2 isophote (see Section 3.2).
The outermost fields of the study (HALO-3,HALO-7,HALO-10) have only sparsely populated red giant branches, which did not provide reliable fits when allowed too many free parameters for the available data. Therefore, in these outer-fields, we constrained the explored metallicity to [Fe/H]0.5. This limit is above the known metallicity of the galaxy inside of 10 kpc and is well-above the metallicity measured for better-sampled fields outside of 10 kpc, where no such boundary was implemented. We found that with this limit in place, the final fits provided the best reproduction of the observed CMD features.
3. Results
3.1. Cumulative Star Formation
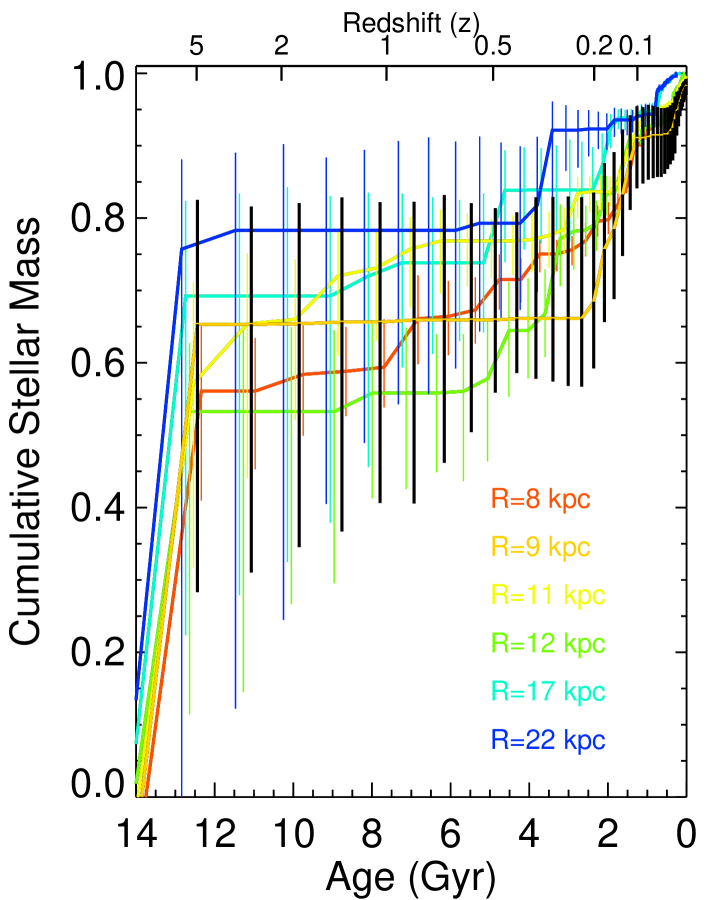
In Figure 6, we show the cumulative stellar age distributions of all of the fields sensitive to the old stellar populations (i.e. all fields outside of 5 kpc except for the HALO-10 field, which had too few stars to provide a reliable measurement). The different fields are color-coded by distance from the galaxy center. No trend with radius is observed.
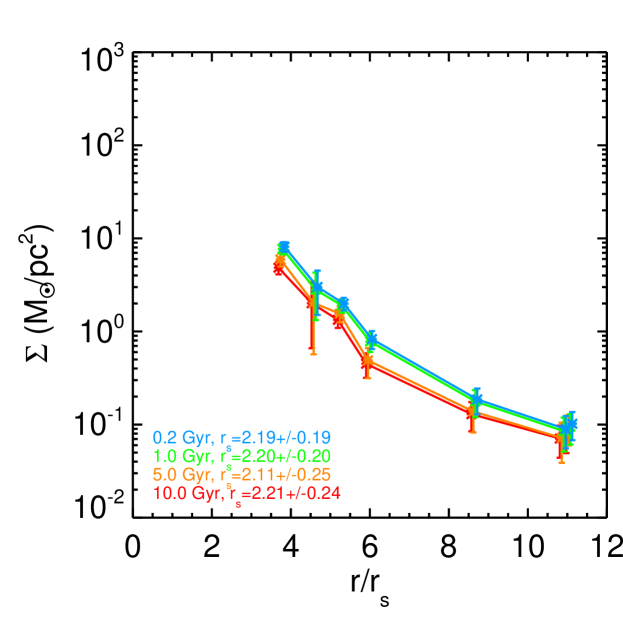
Figure 7 shows the surface density profile evolution for the disk outside of 3 scale lengths, which is calculated from the cumulative distributions from Figure 6. No evolution in the scale length of the surface density profile is seen, as expected given that all of the cumulative distributions are consistent with one another. However, the profile does appear to flatten somewhat at radii outside of 8 scale lengths. This measurement is consistent with the B12 star count analysis, which measured a more extended structural component beginning at this radius.
Succinctly, our results confirm the result of B12 that the surface density of the old stellar populations follows the exponential disk profile out to 8 scale lengths. However, here we also see that stars of all ages are following a similar radial distribution, including the youngest stars, which we discuss in detail below.
3.2. Recent Star Formation Rate
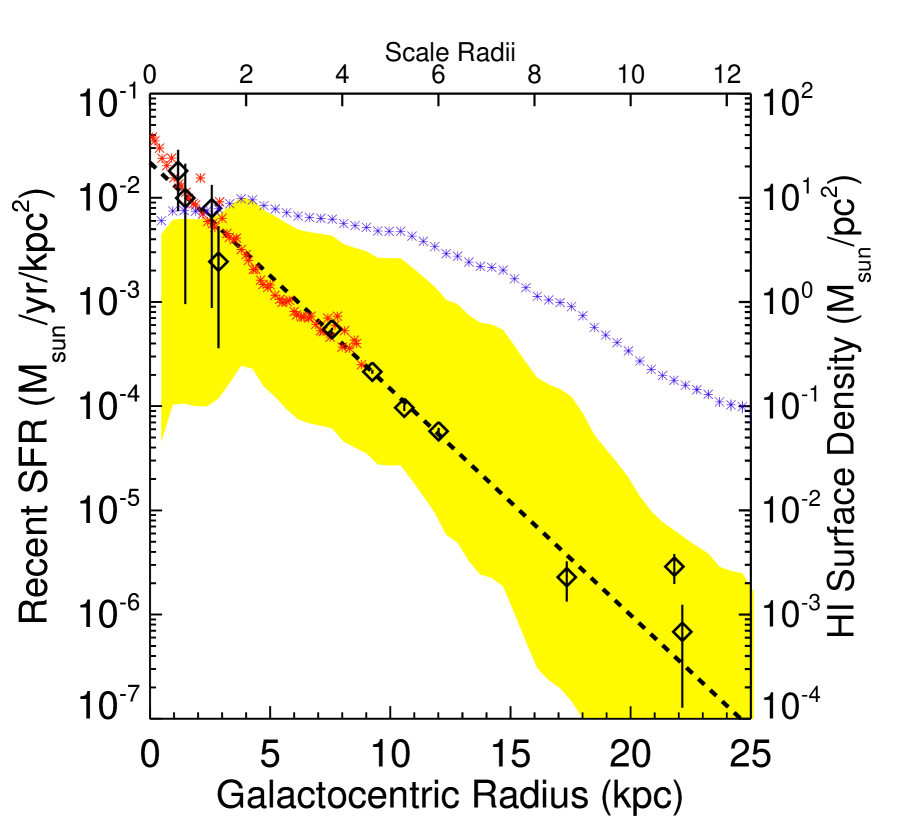
In Figure 8, we show the mean SFR surface density over the past 200 Myr as a function of radius. The fractional uncertainties for the inner fields are large due to the high crowding and differential reddening, which is well-characterized by our MC tests. We note the excellent agreement for the rates measured from both the X1 and SN fields at these inner radii. The uncertainties at intermediate radii are small due to the lower crowding and differential reddening, but still a large number of stars in the sample. At outer radii, the uncertainties increase again due to low numbers of stars in the fields.
We overplot the combined Galex-Spitzer 24-based SFR profile from Leroy et al. (2008). While our data probe SFR intensities a factor of a hundred lower (210-6 M⊙ yr-1 kpc-2), the agreement between the techniques is very good, as the SFRs from integrated light follow the same exponential profile as recovered by the resolved population measurements when averaged over the 200 Myr timescale. Furthermore, the normalization of the azimuthally-averaged rates from Leroy et al. (2008) agree with our rates, which were measured for small regions at each radii. These results suggests both that the young stars are relatively well-mixed azimuthally in a 200 Myr timescale and that the hybrid Galex-Spitzer 24-based SFRs are measuring an average rate covering a timescale of 200 Myr out to at least 4 scale lengths.
The dashed line in Figure 8 is the well-known exponential disk profile of NGC 2403 as measured in -band and RGB star counts (Cepa et al., 1988, =2 kpc; B12). This line is not a fit to the data, other than a simple normalization. Not only is the recent star formation significantly detected at all radii, it also follows the structure of the global disk for at least 11 scale lengths, corresponding to nearly 4 orders of magnitude of star formation rate surface density.
The unbroken exponential profile is again consistent with the lack of a disk break and the lack of age gradients in the long-term SFHs. Furthermore, it confirms the result of Davidge (2007) that the radial distribution of the young stars traces that of the old population, but extends that earlier result beyond 7 scale lengths to 11 scale lengths. It is also consistent with the BIMA SONG results of Wong & Blitz (2002); Wong et al. (2004), which found that radial SFR profiles followed the disk surface density, suggesting that pressure plays the dominant role in the formation of molecular gas (and hence, the formation of stars). Thus, our measurements suggest that their relations may hold to much lower SFRs than available for their study.
Finally, in Figure 8 we overplot in blue the Hi profile from the THINGS data (Leroy et al., 2008), and shaded in yellow are the SFRs that come from applying the relation of Bigiel et al. (2008) to the Hi profile. The relative consistency supports the most recent work on the relationship between gas surface density and SFRs. No threshold surface density is required for star formation, but there is a decrease in star formation efficiency at low gas surface densities (Bigiel et al., 2008, 2010).
3.3. Age and Metallicity Gradients
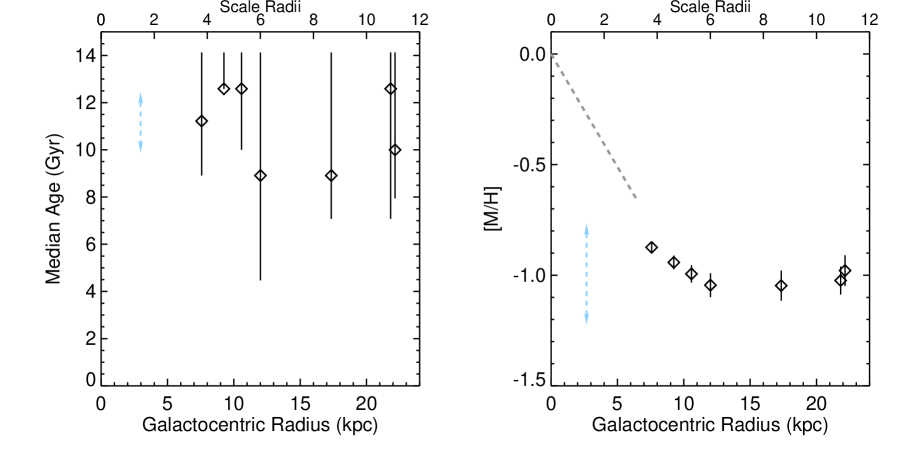
In Figure 9, we plot the median ages and mean metallicities as a function of radius (assuming all stars are in an inclined disk). Inside of 5 kpc, we hand-fixed the metallicity and surface density of the oldest stars, and therefore do not include those radii in these plots. The median ages are given at the age where the cumulative stellar mass was closest to 50%. The age uncertainties include all time bins when the cumulative stellar mass was consistent with being 50%. These uncertainties therefore provide the range of median ages consistent with our data, as inferred from our MC tests. The absence of a lower age error bar for our DEEP field relates to the best constraint for old stars. The age is restricted to the oldest age bin, but the cumulative stellar mass was closer to 50% at the end of the time bin (65%) than at the beginning (0%). Plotted metallicity errors are uncertainties in the mean, and do not reflect the potential spread present in each field. This metallicity spread was typically 0.3 dex in each outer disk field. The old population dominates at all radii, and the mean metallicity shows evidence for a negative gradient out to 12 kpc, then a constant value out to large radii.
To first order, the lack of both an age gradient and an outer disk metallicity gradient is consistent with the conclusions of B12. Outside of 3 scale lengths, our data limit any age gradient to be older than 8 Gyr. Thus, if the median age of the disk at 9 kpc is 13 Gyr, as measured by our DEEP field, our data only allow a downward age gradient to a minimum median age of 8 Gyr at 22 kpc. Thus, the steepest gradient allowed would be 0.4 Gyr kpc-1.
We do see evidence for a metallicity gradient inside of 12 kpc (6 scale lengths) in the old stars (1 Gyr) that dominate the stellar population. The mean metallicity appears to decrease from [Fe/H]0.8 at 4 scale lengths (8 kpc) to [Fe/H]1 at 6 scale lengths (12 kpc). This gradient (0.05 dex kpc-1) is less steep than the 0.1 dex kpc-1 gradient measured for the gas phase metallicity out to 3 scale lengths (6 kpc) by Garnett et al. (1997). The gradient out to 15 kpc is consistent with the B12 measurement of a longer scale length for the metal-poor RGB than the metal-rich RGB from 9–17 kpc.
Outside of 6 scale lengths, the metallicity gradient flattens, remaining at [Fe/H]1 out to at least 11 scale lengths (22 kpc). By mapping the RGB color to 10 Gyr isochrones, B12 estimated a constant [Fe/H] from 20–30 kpc, assuming that all stars are older than 10 Gyr. Thus, our value is consistent theirs, but shows that the mean metallicity is flat in these regions to a precision of 0.1 dex.
The flattening of the metallicity gradient appears correlated with the surface density upturn in the RGB stars beginning at 8 scale lengths seen by B12. As they suggest, the upturn appears uncorrelated with the star forming disk. We clearly show in Figure 8 that no such upturn is seen in the SFR density. The surface density upturn appears due to a separate population that is uniformly very old and well-mixed, leading to a constant metallicity with radius.
Previous studies have noted a metallicity gradient in the interstellar medium and young stars in the inner 8 kpc. (e.g., Garnett et al., 1997; Davidge, 2007). We are not particularly sensitive to metallicity gradients in younger stars, as there are few CMD features that are sensitive to metallicity at ages younger than a Gyr. The metallicities in Figure 9 are for the stars with the ages 1 Gyr. Furthermore, without metallicity measurements inside of 3 scale lengths we cannot reliably address the possibility of a metallicity gradient in the inner disk, even for the old stars.
Overall, our measured median ages are consistent with being the same at all radii outside of 7 kpc, although the uncertainties are relatively large. However, our metallicity measurements show a constant mean metallicity in the outer disk of NGC 2403 (to within 0.1 dex), spatially coincident with the surface density upturn in the old population. Therefore, the enhanced surface density appears to be due to a population of very well-mixed old stars with relatively low metallicity.
4. Comparison with M 33 and NGC 300
Our analysis of NGC 2403 provides some new information about the physical properties of this very extended and apparently undisturbed disk. We now discuss how these properties compare with two other bulgeless systems that can be studied in similar detail, M 33 and NGC 300. In particular, we describe how these few galaxies can help shed light on the evolution of galaxy disks.
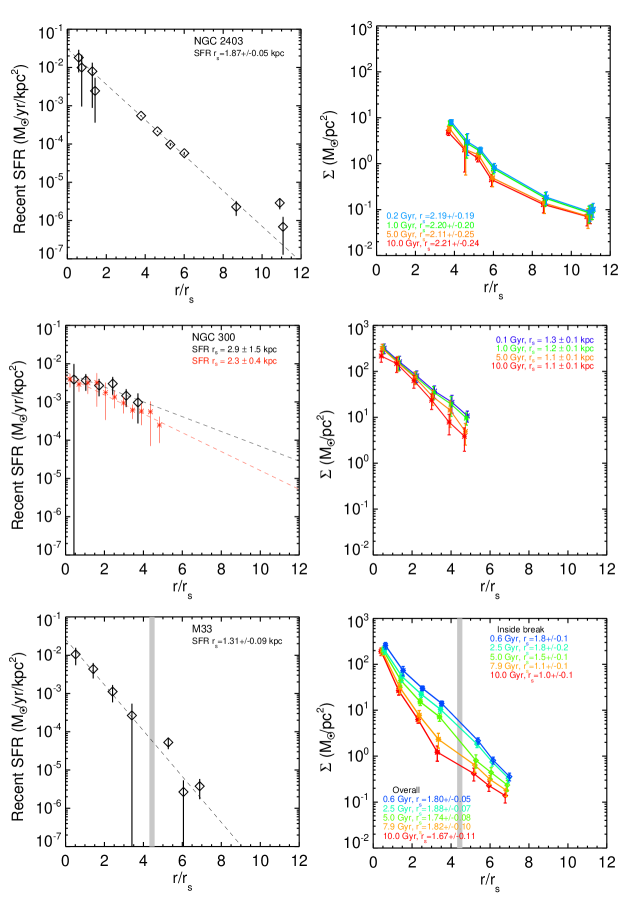
In Figure 10, we provide summary comparison plots of NGC 2403 (this work), M 33 (Williams et al., 2009a), and NGC 300 (Gogarten et al., 2010), showing the recent SFR as a function of radius, and the evolution of the disk surface density as measured from the integral of the SFHs in radial bins.
The SFR profiles are shown as a function of disk scale length (as measured from disk surface brightness), out to 11 scale lengths. Therefore differences in the steepness of the profiles are showing differences in how the star formation falls off relative to the overall disk surface brightness. To improve our radial coverage, we attempted to extend the star formation profile for NGC 300 by including the Galex and Spitzer data to measure the mean SFR out to a radius about 1 scale length larger than the available HST data. No break is seen. We show the gradient extrapolated to 11 scale lengths, in Figure 10. A measurement of the SFR of the far outer disk of NGC 300 would be of great interest to complete this comparison.
As discussed earlier, the SFR in NGC 2403 follows the same scale length as its overall disk surface brightness. Therefore, the slope of the line in the top-left panel of Figure 10 shows the SFR following the surface brightness profile. The slope in the NGC 300 panel is shallower, showing that the SFR of NGC 300 falls off more slowly with radius than its overall disk surface brightness. The same comparison for M33 shows that the its SFR falls very steeply compared to its overall disk surface brightness. Thus, the galaxy in the densest environment (M 33) is the only disk of the three that exhibits centrally-concentrated star formation. Furthermore, M 33 is the only disk of the three that shows a break in its surface brightness profile (B12; Bland-Hawthorn et al., 2005; Ferguson et al., 2007). These results point to a possibility that environment is playing a role in concentrating star formation and/or producing disk breaks.
These possible correlations with environment also carry through to the evolution of structure of the galaxies’ disks. In the right side panels of Figure 10, the radial profiles of the three galaxies at several different epochs (as calculated from our SFH results) are shown. Again, M 33 looks distinct from NGC 300 and NGC 2403 systems. M 33 has had a factor of 2 increase in its scale length over the past 10 Gyr, whereas NGC 2403 and NGC 300 have both had very little evolution in their disk scale lengths. This scale length evolution is the natural byproduct of M 33’s radial age gradient. Within the M 33 disk break (8 kpc), the cumulative age distribution shifts to younger ages as the radius increases (Williams et al., 2009a). Outside of this break radius, the cumulative age distribution shifts back to older ages (Barker et al., 2007) with increasing radius.
Succinctly, in this very limited sample of three very nearby bulgeless disk galaxies, we see strong similarities between the two more isolated galaxies, NGC 300 and NGC 2403. Both have little disk evolution, star formation that is not concentrated relative to the disk surface density, and no disk break. In contrast, M 33, which has 2 massive neighbors, shows clear evidence of disk evolution, a steep fall-off in SFR per scale length, and a disk break. There is clearly more work needed to understand the production and evolution of disk breaks, and NGC 2403 is an important object to understand in this context. In particular, the structure of the NGC 2403 disk requires that any model of disk break formation must also be able to produce an unbroken star forming disk out to very low gas densities (10-1 M⊙ pc-2).
5. Conclusions
We have performed resolved stellar photometry on 9 HST fields in NGC 2403 covering 11 scale lengths of the disk. We fit the CMDs of the stars in these regions to determine their age distributions and mean metallicities. We compared our results with those of previous studies to provide a picture of the evolution of NGC 2403. To put this evolutionary history in context, we compared it to those of its nearby morphological twins M 33 and NGC 300.
Our results suggest little radial variation in the age distribution of the stellar populations in NGC 2403 with galactocentric distance, consistent with previous work from star counts. Furthermore, we find that the surface density of star formation in the disk follows the same exponential profile as the overall surface brightness profile of the disk out to 11 scale lengths, covering 4 orders of magnitude of intensity.
In addition to these strong indications of the undisturbed nature of the NGC 2403 disk, the Hi rotation curve is known to be extremely regular (de Blok et al., 2008), showing no warps. Indeed, it has perhaps the most symmetric velocity field in the THINGS sample. All of these attributes point strongly to NGC 2403 having had no previous strong gravitational encounters. Our results therefore suggest that NGC 2403 is falling into the M 81 group for the first time, as any significant interaction with the group would almost certainly have disturbed the very low density far outer disk, which we see as very much intact.
Unlike the star formation and Hi surface density, the metallicity of NGC 2403 may not follow a simple gradient. The metallicity decreases out to a radius of at least 12 kpc, then levels off at some point between 12 and 18 kpc. We note that B12 found that the surface brightness profile of the old stars in NGC 2403 flattens beyond 8 scale lengths. They attribute this very extended profile to a separate galaxy component, unrelated to the star-forming disk. The uniform metallicity of this component with radius suggests that it is very old and well-mixed. Further interpretation of these properties will await deeper, wide-field data.
Our NGC 2403 results are very similar to the results for the NGC 300 disk, suggesting comparable paths of evolution. On the other hand, M 33 has more centrally-concentrated star formation, a clear disk break, and a strong age gradient, potentially as a result of its more crowded environment in the Local Group. The lack of a break or age gradient in NGC 2403 shows that disk formation theory must provide a means for producing an unbroken disk of both young and old stars (with similar scale lengths) to very low surface densities in an isolated environment, as we have observed in NGC 2403.
Finally, a detailed study of the NGC 300 stellar disk out to large radii would provide an interesting comparison, as NGC 300 does have a warped Hi disk. This warp may be due to the proximity of NGC 55, which puts NGC 300 in an environment that lies between that of the complete isolation of NGC 2403 and the massive companions of M 33. Unfortunately, comparable HST data on the outer disk of NGC 300 are not currently available. The detailed studies of M 33 out to large radii clearly indicate a different structure and history compared to NGC 2403, perhaps due in large part to its proximity to and previous interaction with M 31. Such a study of the outer disk of NGC 300 will provide a complete picture of all 3 local pure disk galaxies.
Support for this work was provided by NASA through grants GO-10915 and GO-11986 from the Space Telescope Science Institute, which is operated by the Association of Universities for Research in Astronomy, Incorporated, under NASA contract NAS5-26555. We acknowledge the anonymous referee’s attention to details of our writing style and presentation.
References
- Barker et al. (2011) Barker, M. K., Ferguson, A. M. N., Cole, A. A., Ibata, R., Irwin, M., Lewis, G. F., Smecker-Hane, T. A., & Tanvir, N. R. 2011, MNRAS, 410, 504
- Barker et al. (2012) Barker, M. K., Ferguson, A. M. N., Irwin, M. J., Arimoto, N., & Jablonka, P. 2012, MNRAS, 419, 1489
- Barker et al. (2007) Barker, M. K., Sarajedini, A., Geisler, D., Harding, P., & Schommer, R. 2007, AJ, 133, 1138
- Barnes & Hernquist (1992) Barnes, J. E., & Hernquist, L. 1992, ARA&A, 30, 705
- Bernard et al. (2012) Bernard, E. J., et al. 2012, MNRAS, 420, 2625
- Bigiel et al. (2010) Bigiel, F., Leroy, A., Walter, F., Blitz, L., Brinks, E., de Blok, W. J. G., & Madore, B. 2010, AJ, 140, 1194
- Bigiel et al. (2008) Bigiel, F., Leroy, A., Walter, F., Brinks, E., de Blok, W. J. G., Madore, B., & Thornley, M. D. 2008, AJ, 136, 2846
- Bland-Hawthorn et al. (2005) Bland-Hawthorn, J., Vlajić, M., Freeman, K. C., & Draine, B. T. 2005, ApJ, 629, 239
- Byun & Freeman (1995) Byun, Y. I., & Freeman, K. C. 1995, ApJ, 448, 563
- Cepa et al. (1988) Cepa, J., Prieto, M., Beckman, J., & Munoz-Tunon, C. 1988, A&A, 193, 15
- Corbelli & Schneider (1997) Corbelli, E., & Schneider, S. E. 1997, ApJ, 479, 244
- Dalcanton et al. (2009) Dalcanton, J. J., et al. 2009, ApJS, 183, 67
- Davidge (2003) Davidge, T. J. 2003, AJ, 125, 3046
- Davidge (2007) Davidge, T. J. 2007, ApJ, 664, 820
- Davidge & Courteau (2002) Davidge, T. J., & Courteau, S. 2002, AJ, 123, 1438
- de Blok et al. (2008) de Blok, W. J. G., Walter, F., Brinks, E., Trachternach, C., Oh, S., & Kennicutt, R. C. 2008, AJ, 136, 2648
- de Vaucouleurs et al. (1991) de Vaucouleurs, G., de Vaucouleurs, A., Corwin, H. G., Jr., Buta, R. J., Paturel, G., & Fouqué, P. 1991, Third Reference Catalogue of Bright Galaxies. ISBN 0-387-97549-7 (Vol. I), ISBN 0-387-97550-0 (Vol. II), ISBN 0-387-97551-9 (Vol. III). (New York, NY (USA): Springer)
- Deul & van der Hulst (1987) Deul, E. R., & van der Hulst, J. M. 1987, A&AS, 67, 509
- Dolphin (2000) Dolphin, A. E. 2000, PASP, 112, 1383
- Dolphin (2002) Dolphin, A. E. 2002, MNRAS, 332, 91
- Dolphin (2012) Dolphin, A. E. 2012, ApJ, 751, 60
- Erwin et al. (2012) Erwin, P., Gutiérrez, L., & Beckman, J. E. 2012, ApJ, 744, L11
- Ferguson et al. (2007) Ferguson, A., Irwin, M., Chapman, S., Ibata, R., Lewis, G., & Tanvir, N. 2007, Resolving the Stellar Outskirts of M31 and M33, ed. de Jong, R. S. 239
- Filippenko (2004) Filippenko, A. 2004, in HST Proposal, 10182
- Fraternali et al. (2001) Fraternali, F., Oosterloo, T., Sancisi, R., & van Moorsel, G. 2001, ApJ, 562, L47
- Fraternali et al. (2002) Fraternali, F., van Moorsel, G., Sancisi, R., & Oosterloo, T. 2002, AJ, 123, 3124
- Freedman & Madore (1988) Freedman, W. L., & Madore, B. F. 1988, ApJ, 332, L63
- Garnett et al. (1997) Garnett, D. R., Shields, G. A., Skillman, E. D., Sagan, S. P., & Dufour, R. J. 1997, ApJ, 489, 63
- Gogarten et al. (2010) Gogarten, S. M., et al. 2010, ApJ, 712, 858
- Hopkins et al. (2009a) Hopkins, P. F., et al. 2009a, MNRAS, 397, 802
- Hopkins et al. (2009b) Hopkins, P. F., Cox, T. J., Younger, J. D., Hernquist, L. 2009b, ApJ, 691, 1168
- Jarrett et al. (2003) Jarrett, T. H., Chester, T., Cutri, R., Schneider, S. E., & Huchra, J. P. 2003, AJ, 125, 525
- Karachentsev et al. (2003) Karachentsev, I. D., et al. 2003, A&A, 404, 93
- Karachentsev et al. (2004) Karachentsev, I. D., Karachentseva, V. E., Huchtmeier, W. K., & Makarov, D. I. 2004, AJ, 127, 2031
- Kim et al. (2002) Kim, M., Kim, E., Lee, M. G., Sarajedini, A., & Geisler, D. 2002, AJ, 123, 244
- Kroupa (2001) Kroupa, P. 2001, MNRAS, 322, 231
- Kudritzki et al. (2008) Kudritzki, R.-P., Urbaneja, M. A., Bresolin, F., Przybilla, N., Gieren, W., & Pietrzyński, G. 2008, ApJ, 681, 269
- Lee et al. (2002) Lee, M. G., Kim, M., Sarajedini, A., Geisler, D., & Gieren, W. 2002, ApJ, 565, 959
- Leroy et al. (2008) Leroy, A. K., Walter, F., Brinks, E., Bigiel, F., de Blok, W. J. G., Madore, B., & Thornley, M. D. 2008, AJ, 136, 2782
- MacArthur et al. (2003) MacArthur, L. A., Courteau, S., & Holtzman, J. A. 2003, ApJ, 582, 689
- Maltby et al. (2012) Maltby, D. T., et al. 2012, MNRAS, 419, 669
- McConnachie et al. (2010) McConnachie, A. W., Ferguson, A. M. N., Irwin, M. J., Dubinski, J., Widrow, L. M., Dotter, A., Ibata, R., & Lewis, G. F. 2010, ApJ, 723, 1038
- Nilson (1973) Nilson, P. 1973, Uppsala General Catalogue of Galaxies, 1973, Acta Universitatis Upsalienis, Nova Regiae Societatis Upsaliensis, Series v: a Vol.
- Puche et al. (1990) Puche, D., Carignan, C., & Bosma, A. 1990, AJ, 100, 1468
- Radburn-Smith et al. (2011) Radburn-Smith, D. J., et al. 2011, ApJS, 195, 18
- Radburn-Smith et al. (2012) Radburn-Smith, D. J., et al. 2012, ApJ, 753, 138
- Roberts (2005) Roberts, T. 2005, in HST Proposal, 10579
- Roediger et al. (2012) Roediger, J. C., Courteau, S., & Sanchez-Blazquez, P. 2012, ArXiv e-prints
- Rogstad et al. (1976) Rogstad, D. H., Wright, M. C. H., & Lockhart, I. A. 1976, ApJ, 204, 703
- Roškar et al. (2008) Roškar, R., Debattista, V. P., Stinson, G. S., Quinn, T. R., Kaufmann, T., & Wadsley, J. 2008, ApJ, 675, L65
- Sandage (1984) Sandage, A. 1984, AJ, 89, 630
- Schlegel et al. (1998) Schlegel, D. J., Finkbeiner, D. P., & Davis, M. 1998, ApJ, 500, 525
- Tammann & Sandage (1968) Tammann, G. A., & Sandage, A. 1968, ApJ, 151, 825
- Tully et al. (2006) Tully, R. B., et al. 2006, AJ, 132, 729
- van der Kruit (2007) van der Kruit, P. C. 2007, A&A, 466, 883
- Williams et al. (2009a) Williams, B. F., Dalcanton, J. J., Dolphin, A. E., Holtzman, J., & Sarajedini, A. 2009a, ApJ, 695, L15
- Williams et al. (2011) Williams, B. F., et al. 2011, ApJ, 734, L22
- Williams et al. (2009b) Williams, B. F., et al. 2009b, AJ, 137, 419
- Wong & Blitz (2002) Wong, T., & Blitz, L. 2002, ApJ, 569, 157
- Wong et al. (2004) Wong, T., Blitz, L., & Bosma, A. 2004, ApJ, 605, 183
- Yoachim et al. (2012) Yoachim, P., Roškar, R., & Debattista, V. P. 2012, ApJ, 752, 97
- Zickgraf & Humphreys (1991) Zickgraf, F.-J., & Humphreys, R. M. 1991, AJ, 102, 113
| Galaxy | Dist. (Mpc)aaM 33 distance from Lee et al. (2002); others from Dalcanton et al. (2009) | MorphologybbMorphologies, V-band and Hi absolute magnitudes were calculated applying the distance modulus (see table-note a) and dust extinction from Schlegel et al. (1998) to the apparent magnitudes from de Vaucouleurs et al. (1991). | (kpc)ccDisk scale length (Williams et al., 2009a; Gogarten et al., 2010; B12) | MVbbMorphologies, V-band and Hi absolute magnitudes were calculated applying the distance modulus (see table-note a) and dust extinction from Schlegel et al. (1998) to the apparent magnitudes from de Vaucouleurs et al. (1991). | MKddK-band absolute magnitudes are based on the Ktot magnitudes of Jarrett et al. (2003) | MHI bbMorphologies, V-band and Hi absolute magnitudes were calculated applying the distance modulus (see table-note a) and dust extinction from Schlegel et al. (1998) to the apparent magnitudes from de Vaucouleurs et al. (1991). | [Fe/H]eeKim et al., 2002; Kudritzki et al., 2008; B12 | SFR (M⊙ yr-1)fffootnotemark: |
|---|---|---|---|---|---|---|---|---|
| M 33 | 0.8 | SA(s)cd | 1.8 | -19.4 | -20.4 | -17.3 | -0.8 | 0.03 |
| NGC 300 | 2.0 | SA(s)d | 1.3 | -18.5 | -20.1 | -17.3 | -0.3 | 0.01 |
| NGC 2403 | 3.2 | SAB(s)cd | 2.0 | -19.5 | -21.3 | -17.9 | -0.7 | 0.03 |
| Proposal | Target | Camera | Filter | Exposure (s) | Stars | Radius (kpc) | |
|---|---|---|---|---|---|---|---|
| 10182 | SN-NGC2403-PR | ACS | F606W | 700 | 405516 | 2.0 | 26.18 |
| 10182 | SN-NGC2403-PR | ACS | F814W | 700 | 405516 | 2.0 | 25.54 |
| 10579 | NGC2403-X1 | ACS | F435W | 1248 | 154761 | 2.4 | 26.91 |
| 10579 | NGC2403-X1 | ACS | F606W | 1248 | 154761 | 2.4 | 26.44 |
| 10523 | NGC2403-HALO-1 | ACS | F606W | 710 | 101951 | 7.6 | 27.65 |
| 10523 | NGC2403-HALO-1 | ACS | F814W | 710 | 101951 | 7.6 | 26.80 |
| 10915 | NGC2403-DEEP | WFPC2 | F606W | 32400 | 30617 | 9.3 | 28.05 |
| 10915 | NGC2403-DEEP | WFPC2 | F814W | 62100 | 30617 | 9.3 | 27.20 |
| 10523 | NGC2403-HALO-6 | ACS | F606W | 720 | 25350 | 10.6 | 27.60 |
| 10523 | NGC2403-HALO-6 | ACS | F814W | 720 | 25350 | 10.6 | 26.92 |
| 10523 | NGC2403-HALO-2 | ACS | F606W | 740 | 15619 | 12.0 | 27.70 |
| 10523 | NGC2403-HALO-2 | ACS | F814W | 745 | 15619 | 12.0 | 26.93 |
| 10523 | NGC2403-HALO-3 | ACS | F606W | 735 | 3102 | 17.3 | 27.70 |
| 10523 | NGC2403-HALO-3 | ACS | F814W | 735 | 3102 | 17.3 | 26.92 |
| 10523 | NGC2403-HALO-7 | ACS | F606W | 745 | 2275 | 21.8 | 27.70 |
| 10523 | NGC2403-HALO-7 | ACS | F814W | 745 | 2275 | 21.8 | 26.92 |
| 10523 | NGC2403-HALO-10 | ACS | F606W | 730 | 1627 | 22.1 | 27.70 |
| 10523 | NGC2403-HALO-10 | ACS | F814W | 730 | 1627 | 22.1 | 26.81 |