Nucleation and growth of thin films of rod–like conjugated molecules
Abstract
Thin films formed from small molecules rapidly gain importance in different technological fields. To explain their growth, methods developed for zero–dimensional atoms as the film forming particles are applied. However, in organic thin film growth the dimensionality of the building blocks comes into play. Using the special case of the model molecule para–Sexiphenyl, we will emphasize the challenges that arise from the anisotropic and one–dimensional nature of building blocks. Differences or common features with other rodlike molecules will be discussed. The typical morphologies encountered for this group of molecules and the relevant growth modes will be investigated. Special attention is given to the transition between flat lying and upright orientation of the building blocks during nucleation. We will further discuss methods to control the molecular orientation and describe the involved diffusion processes qualitatively and quantitatively.
type:
Topical Review1 Introduction
Research over the last decades on growth processes at an atomic scale has greatly enhanced our understanding of thin film formation and crystal growth. In particular the realization that in addition to thermodynamic effects also kinetic limitations at the surface play an important role during the growth of thin films and crystals has helped to explain many growth phenomena [1, 2, 3, 4, 5]. Although a great level of understanding has been reached for many different processes, the vast majority of the systems contained single atoms as the film forming entity. These are as such zero–dimensional particles.
A new class of thin film materials—conjugated molecules (see figure 1 for examples)—has emerged in the past 20 years.
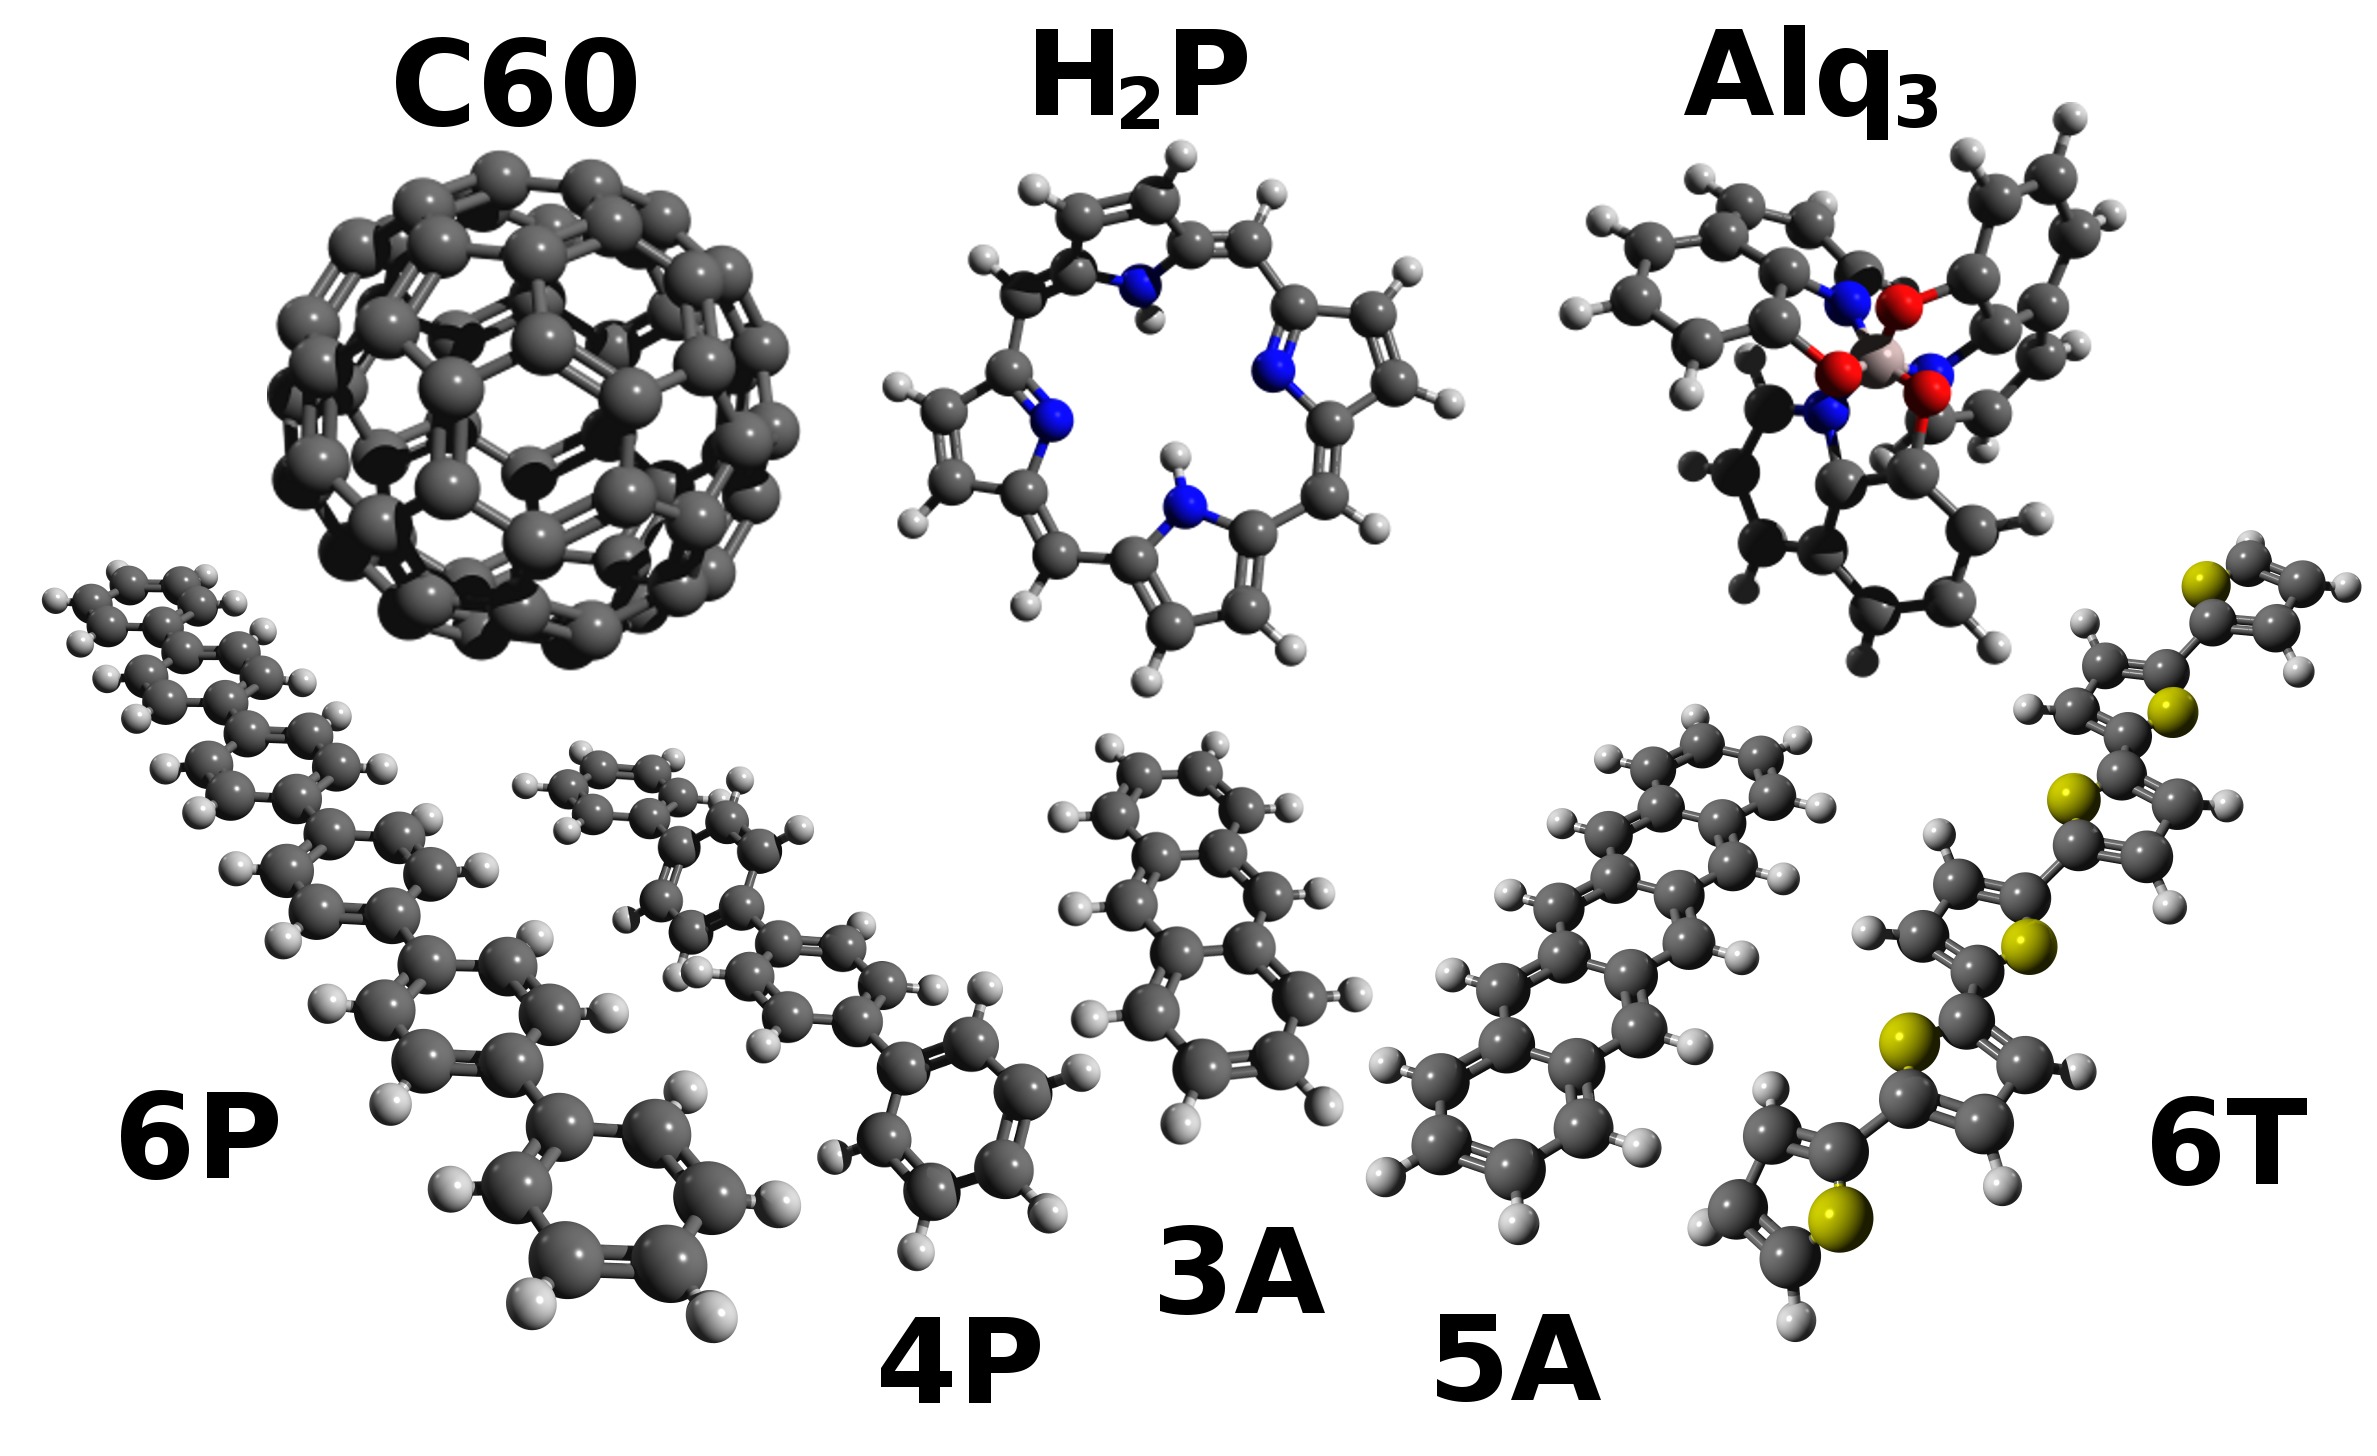
As is demonstrated in figure 1, such molecules can be three–dimensional like tris(8–hydroxyquinoline)aluminium (Alq3), two–dimensional like the essentially planar Porphyrins and Phthalocyanins or one–dimensional like the Acences, oligo–Phenylenes and Tiophenes. The spherical C60 molecule can either be viewed as a large zero–dimensional or a isotropic three–dimensional particle. Their use as organic semiconductors opens exiting new possibilities for electronic and optoelectronic devices, in particular flexible or stretchable [6] ones. There is ample of evidence that models used in inorganic epitaxy might also be applicable to this new class of materials [7, 8, 9]. However, on a molecular level these materials do not always follow the well established findings of classical epitaxy [10, 11]. In this topical review, the underlying reasons and consequences for thin film growth will be discussed. A vast variety of different conjugated molecules are currently under investigation and their number keeps steadily increasing. As many of the effects described here are thought to be generic, we will limit this topical review to rodlike molecules. They are a representative group within the vast number of molecules with extended dimensionality. In fact, we will restrict ourself mostly to the oligophenylene molecule para–Sexiphenyl (6P) [12, 13, 14, 15]. This model molecule is widely investigated for its potential use in organic thin film transistors (OTFT), organic light emitting diodes (OLED) and solar cells. In these devices, a specific molecular orientation is essential for optimal performance. By comparison to other rodlike molecules, we will highlight the modifications that arise in the growth behaviour by changing molecular properties.
After a brief introduction to small organic molecules, first the nucleation behaviour will be discussed. It is during this initial growth stage when the molecular orientation of the thin film is determined. This topic is of special importance as different applications require different molecular orientations on the substrate. The need to control this orientation is rooted in the anisotropic properties of the molecules. In particular, the charge carrier mobility for different crystallographic directions often shows a pronounced anisotropy [16, 17]. As a rule of thumb, charge transport is always best in directions with maximum / overlap. Often this is perpendicular to the long molecular axis or the molecular plane containing the conjugated –system for two- and three–dimensional molecules. In figure 2, the required molecular orientations for a OTFT and an OLED are depicted for the model molecule 6P.
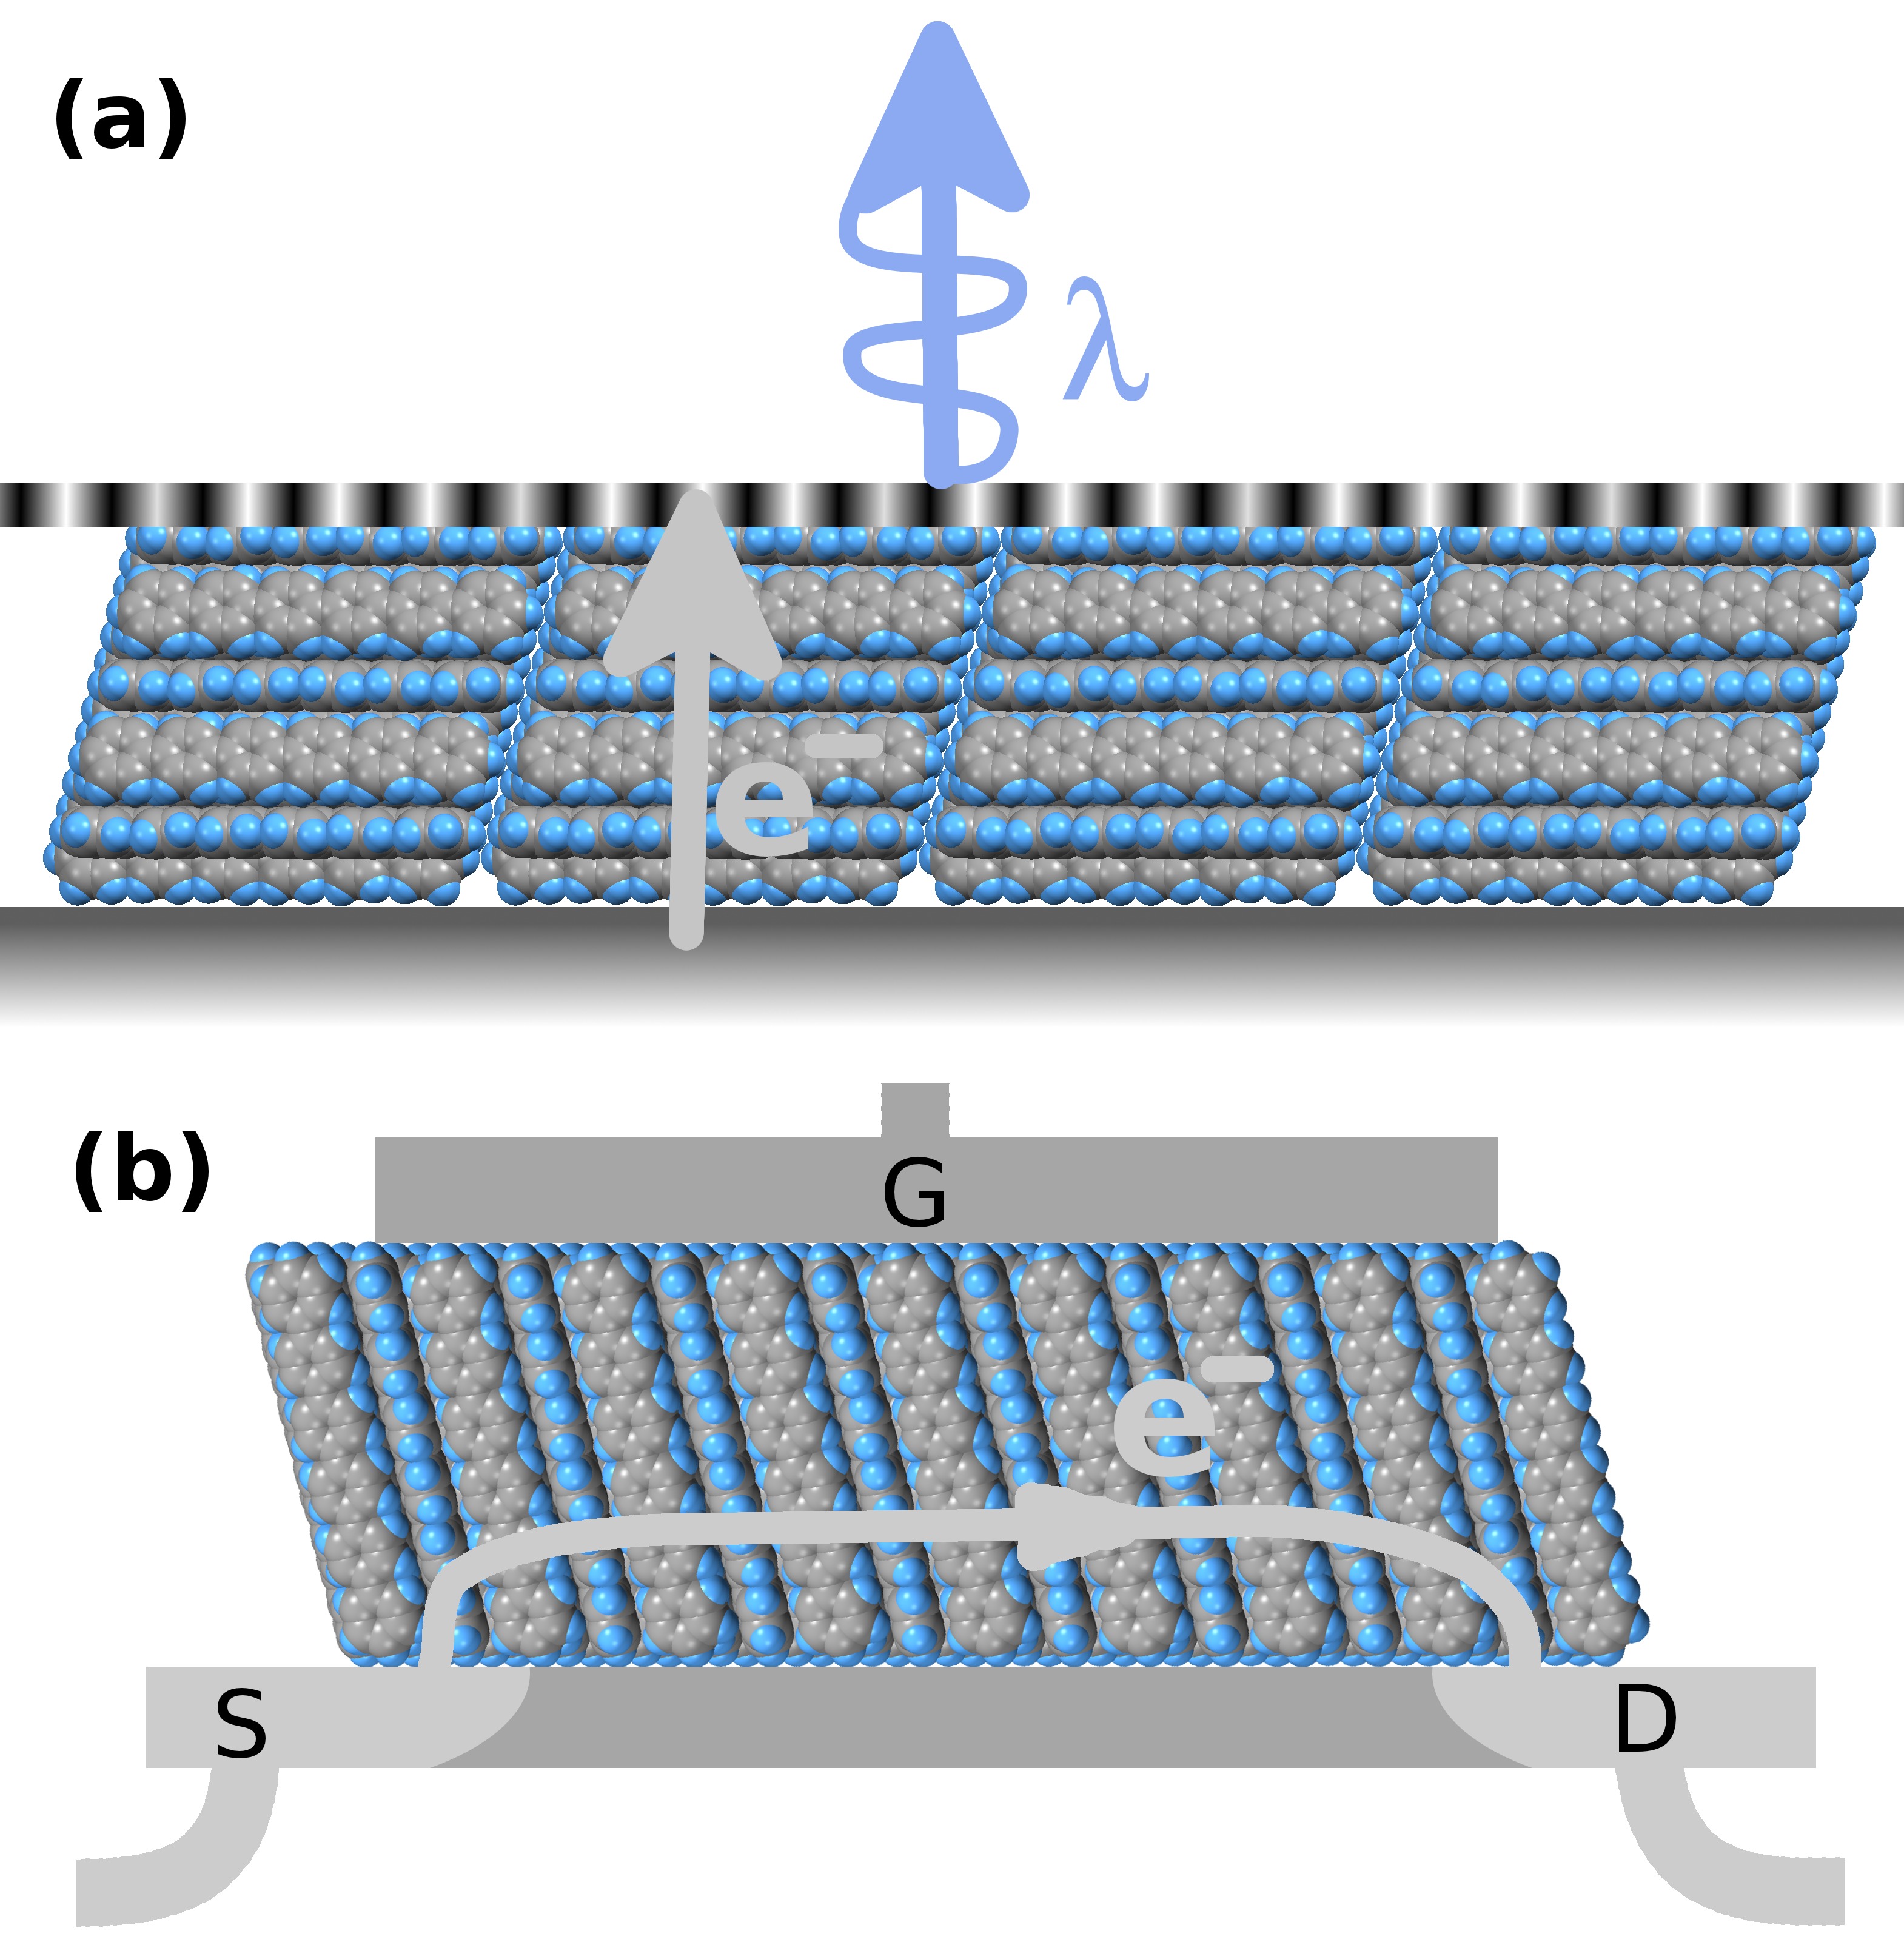
As can be seen, the desired orientation for an OLED application would be flat lying molecules with their –systems parallel to the electrodes. Charge transport in such a device is then perpendicular to the –system and the long molecular axis or largest plane. Also the desired light emission is maximised in such a configuration. On the other hand, for an OTFT application an upright standing molecular configuration is wanted to facilitate charge transport parallel to the substrate in an isotropic way. Therefore, possibilities to influence the nucleation behaviour and consequently the resulting film morphology as well as the molecular orientation will be discussed.
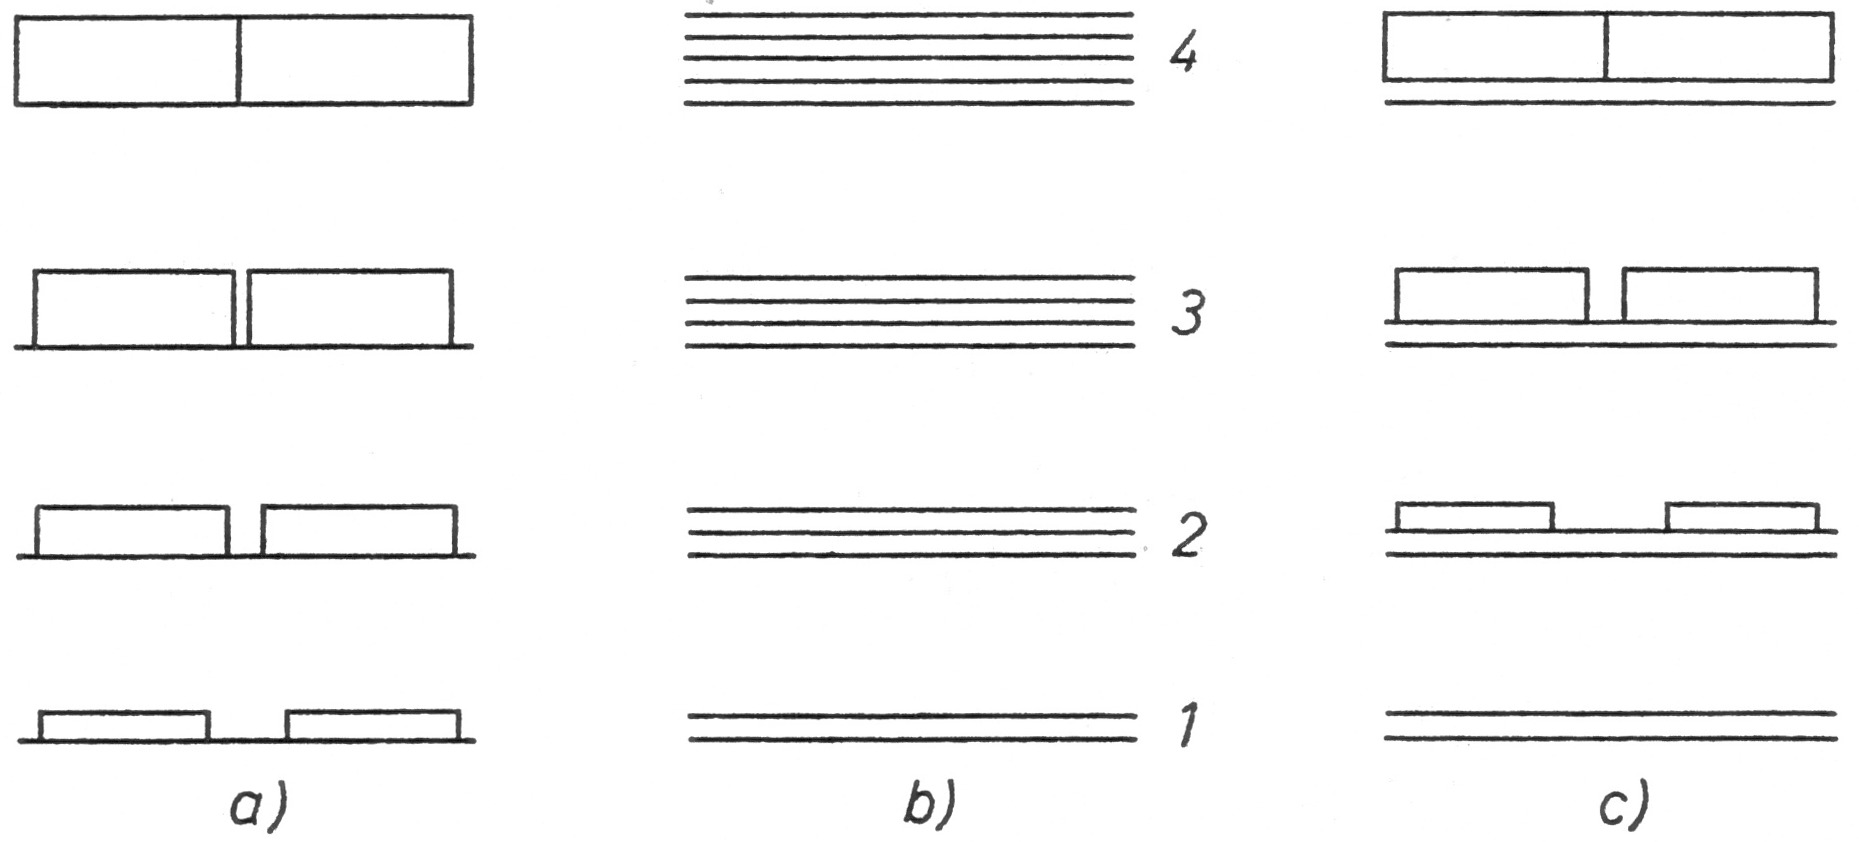
Secondly, we will describe different growth modes and mechanisms observed during the formation of thicker films. Examples of Stranski–Krastanov and Vollmer–Weber growth modes as well as Frank–van der Merwe or Layer–by–Layer (LbL) growth will be presented [18, 1]. Although difficult to achieve, the latter is often the desired growth mode to fabricate continuous films with homogeneous thickness. The so obtained smooth interfaces have a lower number of defects and yield generally a higher charge carrier mobility [19, 20, 21, 22]. Which of the above mentioned thermodynamical growth modes is realized, depends on the ratio of the different surface free energies. The following requirement has to be fulfilled for any thin film growth to happen. The sum of the surface free energy between substrate and adsorbate, and between the adsorbate and the vapor are smaller then the surface free energy of the substrate [18]. Depending on the evolution of the change of the surface free energy
| (1) |
during deposition, the three growth modes presented in figure 3 can be distinguished. For at all times it is feasible for the substrate to be covered by the adsorbate layer. This growth mode is usually referred to as Frank–van der Merwe, Layer–by–Layer (LbL) or two–dimensional growth. In case that at all times clustering will occur. This mode is called Vollmer–Weber, island or three–dimensional growth. In case that for the initial deposited layers but changes to for subsequently deposited material, the film will start to cluster after a thin uniform layer has been deposited. This growth mode is called Stranski–Krastanov growth mode. The latter is frequently found in inorganic heteroepitaxy for systems with a significant but not too large mismatch [23].
Unfortunately in organic thin film growth, the last two growth modes are much more common than the desired LbL mode.
The above sketched thermodynamic description of thin film growth is not sufficient if the necessary diffusion processes are kinetically hindered. A more atomistic approach that includes the actual pathways is then needed to describe the observed morphologies accurately [24]. In particular, interlayer diffusion and the associated barriers play a decisive role. Ehrlich–Schwoebel or step edge barriers [25, 26], activation barriers for intralayer diffusion, and the anisotropy of these properties influence the final morphology. Depending on the absolute and relative sizes of these barriers different morphologies will be found in the resulting thick films. As a result of the sizable step edge barrier often found in these molecular films, growth phenomena like mound formation and rapid roughening are frequently observed. As the strong van der Waals interaction—typical for conjugated molecules—often dominates all other intermolecular and molecule–substrate interactions, three–dimensional growth is characteristic for organic semiconductor thin films.
For all growth phenomena mentioned it is important to realize that already for one–dimensional molecules at least two different scenarios have to be distinguished. A smooth film grown in LbL mode might be useful for OLED applications when formed from flat lying molecules. On the other hand, if the molecules have an upright orientation, already a small number of layers grown in LbL mode at the gate dielectric will yield a decent performance in an OTFT configuration. The reason that a small number of layers will suffice is related to the fact that all important charge transport processes are confined to the first two monolayers [27].
While many studies focus on the submonolayer regime and interpret the behaviour of individual molecules, we follow a mesoscopic approach. This is justified by the fact that the behaviour of larger ensembles of molecules allows to infer information about the molecular level processes [5, 1]. In addition, the investigated mesoscopic size range correlates well with the final device dimensions. The relevance of different changes in the properties at this mesoscopic length scale can thus directly be related to the device performance.
1.1 Organic semiconductors
The conductivity of organic crystals has been studied already in the early 20th century [28, 29]. However, only with the discovery of electroluminescene these materials received additional attention from the semiconductor research community [30, 31]. Inspired by the Nobel prize awarded work of Alan Heeger, Hideki Shirakawa, and Alan MacDiarmid in the 1970s, many researchers focused on conjugated polymers which exhibit good conductivity if prepared properly [32]. In the 1980s, organic heterojunctions [33] and organic thin film transistors [34, 35, 36] have been demonstrated. The final breakthrough happened after the realization of high efficiency electroluminescence from organic light emitting diodes built both from polymers [37, 38] and oligomers [39, 40]. Nowadays, organic semiconductors are either already used or are about to enter the market soon in countless applications such as large–area–lightning, flexible solar cells, and displays. These devices are based on the integrated use of OLEDs, OTFTs, sensors, and organic photovoltaic cells [41, 42, 43, 44, 45].
With respect to their growth behaviour, organic semiconductors are of interest for several reasons. As described above, classic surface science treats zero–dimensional particles with a few exceptions such as Si dimers [46]. The extended shape of the used molecules does not only allow them to obtain different orientations in space but also influences the way they interact with the surrounding. It is the extended electronic system that is responsible for the large intermolecular forces. The underlying van der Waals forces are small for the individual constituting atoms but can add up to a few eV for the entire molecule. The extended electronic system also helps to smoothen the effective corrugation of the substrate. The molecule averages over many possible atomic adsorption sites to find the molecular adsorption site with the minimum energy. Directly related to this is a large number of internal vibrational degrees of freedom [47, 48]. These have to be considered when discussing the interaction at interfaces. These interfaces can occur between the condensed phase and the 2D or 3D gas phase, but can also be boundaries between different crystalline domains. Unfortunately, the large size of the building blocks results in a large number of translational domains. Together with the usually low symmetry of the crystal structure this can lead to additional disorder in the film, which in turn hampers the final device performance. For a general overview on the properties of organic semiconductors, the reader is referred to the following books [45, 49, 50].
1.2 Rod–like conjugated molecules
The three most important groups of rod–like conjugated molecules are the para–n–phenyls and the groups of acens and thiophenes (see lower part of figure 1). The first two will be of particular interest here, as they show opposed properties in some important characteristics. The n–thiophene molecules are chiral and exhibit interesting chiral phenomena in thin layers but not in the bulk [51].
In this article, we will focus primarily on para–Sexiphenyl (6P) [52, 53, 14, 54]. It is important to realize at this point that the acenes and para–n–phenyls have a very different stiffness of their backbone. The single bonds in the n–phenyls allow a certain flexibility of the backbone as compared to the acenes which possess a much stiffer backbone formed by two bonds. In the case of the n–phenyls, the phenyl rings can twist with respect to each other (shown for 4P in figure 1). This twist is observed for single molecules either on the surface or in the gas phase. However, in a bulk crystal the n-phenyls obtain a flat configuration (as shown for 6P in figure 1) [55, 15]. Typically, rod–like molecules like the acenes or phenylenes form a so called herringbone bulk structure. This packing motif is characterized by an alternating left and right tilt of the molecular plane around the long molecular axis. As a result, the long hydrogen terminated side of one molecules faces the flat side of the neighboring molecules where the –system is located. This configuration balances the quadrupol moment of the molecules most effectively. It should be noted that this packing motif is very different for what is found for two–dimensional plate–like molecules that favour a planar bulk stacking.
2 Forming a nucleus
In this section, the important quantity of interest is the so called critical nucleus size . It is defined as the biggest number of particles forming a cluster that will become stable by adding one more particle. While there are various way’s to extract this number, the use of rate theories [5] in combination with scanning probe techniques has been proven to be extremely successful. The central result of the underlying theory can be summarized by the relation
| (2) |
where is the island number density, denotes the flux of incoming particles in numbers of particles deposited per unit time and surface area. The scaling exponent holds the dependence on the critical nucleus size.
| (3) |
is the particle jump rate on the surface. Here, is the energy barrier the particle has to overcome, the temperature and the Boltzmann factor. The pre–exponential factor is often referred to as the attempt frequency. For all practical purposes, this is on the order of in inorganic systems. As we will see later, for organic systems can deviate substantially from this value [48].
A second approach is based on the scaling hypothesis stating that the island statistics in the steady state regime will depend—besides and —only on the coverage via the mean island size [56]. Using this assumption, it is possible to derive the critical nucleus size although this is not very easy to apply in practice. This result has been extended by introducing an additional scaling for the capture numbers [57]. However, most often the empirical scaling function of Amar and Family [58] is used. Recently a similar approach has been introduced by Pimpinelli and Einstein based not on the island size distribution but on the capture zone size distribution [59, 60, 61]. The presented scaling methods have the benefit that they require less data, and often a single experiment or even a single image can be sufficient to extract the critical nucleus size. A review and more in depth analysis of the strong points and weaknesses of the individual methods can be found in [1, 2].
The above considerations are only valid for low coverages after the initial transient nucleation regime but before the coalescence occurs. This intermediate regime is called the steady state nucleation regime.
An additional obstacle—for all three methods—results from the fact that the molecules are anisotropic. As a result they can obtain different in plane but also out of plane orientations. As we will see later, the single shot methods also carry the risk to overlook interesting kinetic behaviour with respect to deposition rate or growth temperature.
2.1 Obtaining the critical island size
In the case of complete condensation, i.e., when re-evaporation can be excluded, the island number density can be written as [5]
| (4) |
Here, refers to the temperature of the sample during growth—often called deposition temperature. The energy parameter
| (5) |
can be split further into the activation barrier for diffusion and the binding energy of the critical nucleus . Provided sufficient data is available, a plot of vs allows the extraction of the critical nucleus from the slope
| (6) |
Plotting the island density in an Arrhenius fashion as vs. , one can extract again from the slope
| (7) |
information on the involved energies. An assessment of the quality of the recorded data and the relevance of the extracted data can be obtained by comparing the results from the two different methods [5, 62]
| (8) |
with and being the y–intercepts of the two above mentioned plots.
The above described rate equation based approach has been used extensively in the past to obtain information on the critical nucleus size. Typically sizes between 2 and 4 are found for different rodlike molecules. For 5A on SiO2, a value of 3–4 is reported [9, 63] similar to 2–3 reported for 6P on disordered mica(0001) substrates [62]. However, due to the large experimental data set necessary, in many studies also scaling laws are used to determine the critical nucleus size. Most of the results are obtained by applying island size scaling [58]. However, capture zone scaling [60, 59, 61] seems to provide more reliable results [64, 65, 66] for some cases. In agreement with rate theory, scaling laws typically yield values between 2 and 3 for 6P [64, 62] and somewhat higher values between 3 and 6 for 5A [8, 11, 9] on SiO2 or cyclohexane terminated Si{001} [67]. However, in particular for the growth of 5A care has to be taken with respect to the applicability of these single shot methods because of fractal growth morphologies [68].
As will be demonstrated in the next section, the stability of the possible nuclei does not necessarily depend in a homologous way on the nucleus size. In fact, due to effective shielding some configurations can be more stable than others (see figure 5). 5A and 6P are very similar regarding their herringbone packing in the bulk. Consequently, similar molecular configurations in the critical nucleus will have comparable stability with respect to other configurations.
As can be seen from (3), in (4) depends also on the attempt frequency . From the y-intercept in the above mentioned Arrhenius plot, one can extract this quantity. It is important to note that for molecules this value does not always correspond to the one typically found in inorganic diffusion of zero–dimensional atoms ( s-1). In fact, here the value of can be much higher. Values up s-1 [69] are reported from thermal desorption spectroscopy (TDS). However, common values obtained from TDS (experimental and theoretical) are in the order of [70, 48, 71, 72, 69, 47, 73, 74]. Recent rate equation analysis yields a value of for the diffusion of 6P on mica [62]. The explanation of these high values is given by transition state theory [75]. In this theory, the pre–exponential factor depends on the partition functions of the particle in the diffusive and adsorbed state. In contrast to an atom, a molecule possesses many vibrational and rotational degrees of freedom. In particular, the latter ones contribute only to the partition function of the diffusive state. As a result, the pre–exponential factor deviates from the well known s-1. The difference between values obtained by rate theory [62] and the sometimes extreme values obtained from TDS [69] arises from the different target phases. While in a typical growth experiment—used for the rate equation approach —the molecule stays on the surface in a 2D gas phase, in a TDS experiment the molecules enter the 3D vapour phase. However, the 3D phase has an even higher number of degrees of freedom compared to the 2D gas phase, resulting in different partition functions.
Independent of the above considerations, an interesting question concerning islands formed by upright molecules remains unsolved at the moment. How—and at what point during nucleation and growth—do the molecules obtain an upright orientation? By considering the binding energy of an upright standing 6P molecule to the 6P(001) plane of 0.21,eV111private communication P. Puschnig and comparing it to the one for a flat lying molecule of 1.27 eV [76] it is plausible to assume that a single molecule will always obtain a flat lying configuration [77]. Eventually flat lying molecules will meet and form initially unstable dimers and trimers that will decay or continue to grow and become stable when big enough. At some point—to form a film of upright standing molecules—the molecules have to change from a lying to upright standing configuration. Recent molecular dynamics (MD) simulations illustrate the problem [62]. The graph presented in figure 4
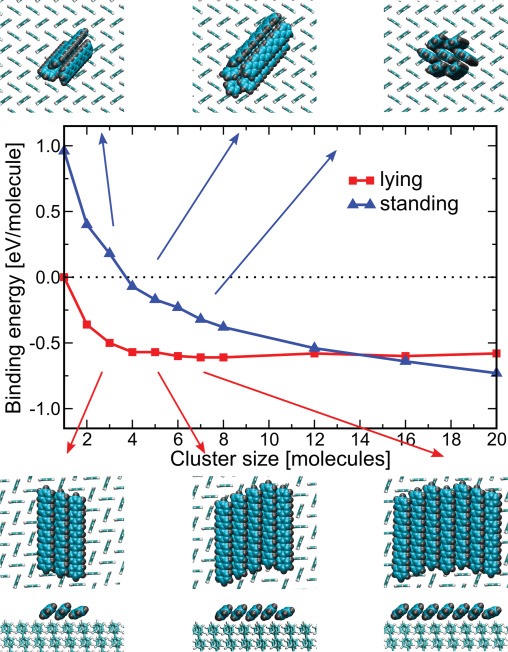
shows the evolution of the cluster binding energy with increasing cluster size. The cluster binding energy is calculated by comparing a situation with molecules in a cluster to the same amount of molecules adsorbed in a lying configuration on the 6P(001) surface. When the energy difference between the cluster and the separate molecules is negative, the cluster is thermodynamically stable. One can see that for only flat lying clusters are stable, while clusters formed from upright standing molecules are entirely unstable. For cluster size between 4 and 14 molecules, clusters of upright standing molecules are stable but lying clusters would still be favored. Only for clusters bigger than 14 molecules 6P continues to grow in the required (001) orientation. However, the exact numbers will also depend on the details of the interaction with the substrate. In the MD simulation presented in figure 4, the clusters rested on the 6P(001) surface rather than on an amorphized mica substrate—discussed above—which is hard to simulate. In any case, the simulation results will be correct for second layer nucleation as well as all following layers.
More information can be extracted from the graphs shown in figure 4 on the growth of standing molecules. Already for clusters of only two molecules () the energy gain is quite large (on the order of ) and these clusters would be very stable. Furthermore, a simple geometric argument based on counting the number of fully exposed –systems arrives at the same critical island size of for upright standing molecules. This is also the value often reported in literature [62, 63, 64]. In figure 5, several possible configurations of
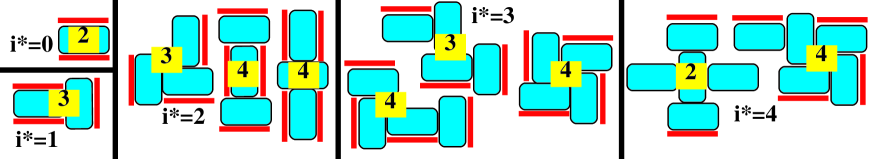
critical nuclei from =0 to =4 are sketched. The fully exposed –systems are also marked and their number is given. A large number of exposed –systems is energetically unfavourable, and the system would in general try to minimize their number. Besides the rough nature of the model it turns out that only for clusters of four () or more molecules the number of fully exposed –systems becomes smaller than the number of molecules. From this simple model we can conclude that once the balance between molecules and exposed –systems swings towards the molecules the nuclei become stable. This is in good agreement with the above presented MD results. The consequence of this can be seen twice in figure 4. First, the clusters formed by upright standing molecules become stable around a size which allows for molecules that do not belong to the island rim. Second, the final slope of the two graphs is different. With increasing cluster size the number of energetically more favourable molecules which are not part of the rim increases faster for clusters composed from upright standing molecules than for the flat lying nuclei. At least for the investigated size range, clusters of flat lying molecules contain only molecules which expose at least one –system to the vacuum. Nucleation processes involving small metastable clusters (e.g. non–epitaxial dimers) that eventually convert into larger stable clusters are also observed in inorganic semiconductor epitaxy [79, 80, 81].
The important question is, how do these flat lying molecules obtain an upright standing orientation. Besides the reorientation of the whole cluster other scenarios are in principle possible too. As we will see below, defects on the substrate surface influence the orientation of the molecules. First principle calculations reveal that already a single defect in an otherwise perfect surface can alter the molecular orientation from flat lying to upright standing [82]. The initial flat lying nucleus can act in a similar way. Molecules arriving later will undergo a kind of defect nucleation and obtain an upright standing configuration. This is also observed in experiments. When the coexistence of structures formed from flat lying and upright standing molecules is observed, the first ones are often responsible for nucleating the latter [83, 84].
Furthermore, already small clusters formed from upright standing nuclei should grow faster than their counterpart formed from flat lying molecules. While molecules with all rotational orientations can be incorporated into a cluster of standing molecules, they will eventually have to rotate in the case of a cluster of flat lying molecules. In any case, the calculation only yields the energetically most favourable configuration. It does not contain information on the probability that it can actually form. Thus, although energetically favourable the lying nuclei is actually more difficult to form due to the rotational hindrance. However, this implies that no substantial energy barrier exists for the reorientation of molecules from flat lying to upright standing. Although no information is available on such a barrier, it can not be too large, since the final morphology is dominated by upright standing molecules. Such a morphology would be unlikely in a scenario where initially both orientations compete and a high barrier would exist to obtain the upright orientation. In such a competing scenario—where both types of nuclei can form—a cluster of upright molecules could be kinetically stabilized just because it can grow in size much easier. Such an attachment limited aggregation (ALA) for 6P has been observed and a critical nucleus size of is found [85]. This is in reasonable agreement with the numbers obtained in the above simulations for the transition from unstable to stable for clusters formed by upright standing molecules. In such a scenario, no reconfiguration of the cluster from lying to upright would be necessary.
2.2 Tuning molecular orientation and the role of defects
Despite the persisting problems with respect to nucleation, several groups have succeeded in controlling the nucleation behaviour. This is an important step towards realization of functional devices, since different functionality requires different molecular orientations (see section 1 and figure 2).
A convenient, but technically not very practicable, method to control molecular orientation is via the substrate. The observed changes in orientation go hand in hand with a change of the surface free energy of the substrate. Although the surface free energy is therefore the most obvious ordering parameter for the change from flat lying to upright standing, we will use a different approach here. It is easy to see that the crystalline structure of the substrate surface plays a crucial role for the in–plane molecular orientation. However, the degree of order present in the substrate surface can also be decisive with respect to an upright or flat lying molecular orientation. In fact, the effect of changing the surface structure can often dominate over the behaviour expected from a substrate according to its other physical properties. A model system demonstrating this is the deposition of para–Sexiphenyl onto muscovite mica surfaces. Several groups have shown that for a large number of rodlike molecules—such as 6P, 5A, and 6T—nanofibers formed by flat lying molecules are the dominating morphology on clean mica surfaces [86, 87, 88, 89, 90, 54, 91].
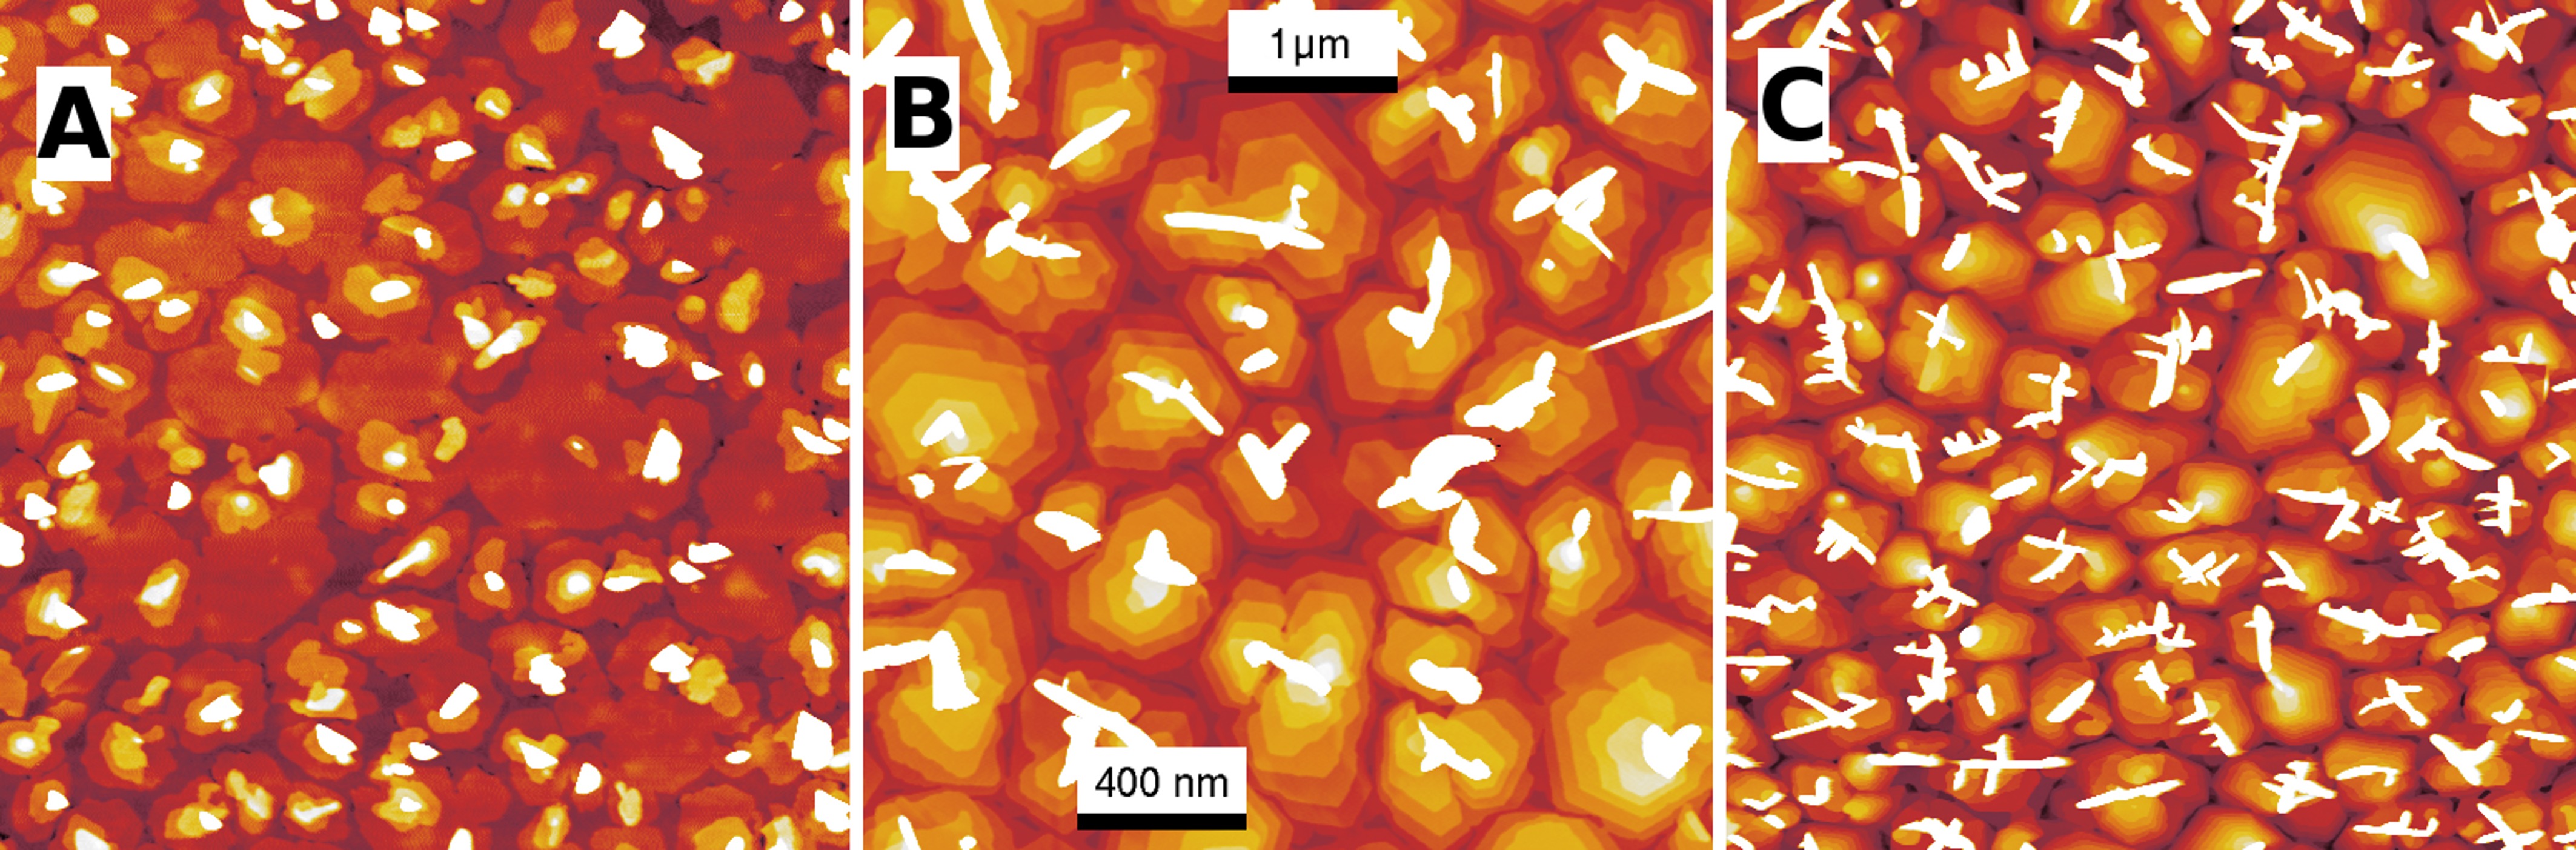
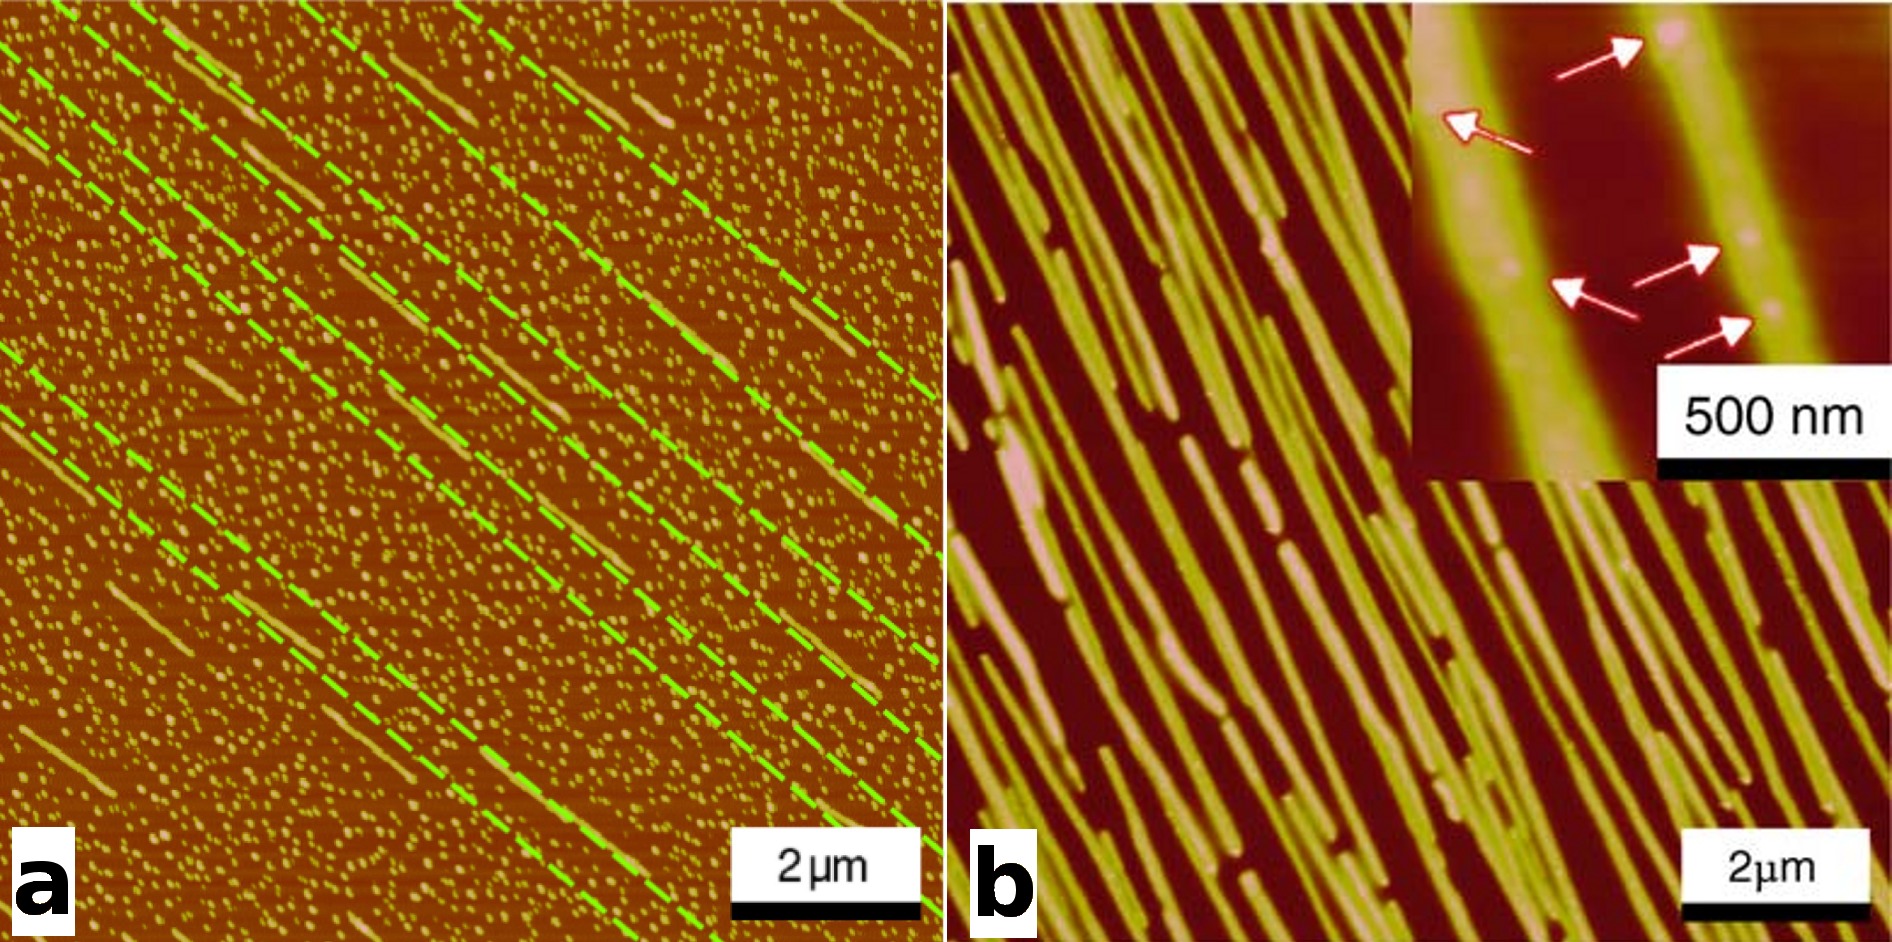
In figure 6, typical morphologies obtained by Atomic Force Microscopy (AFM) of 6P films grown on mica are presented.
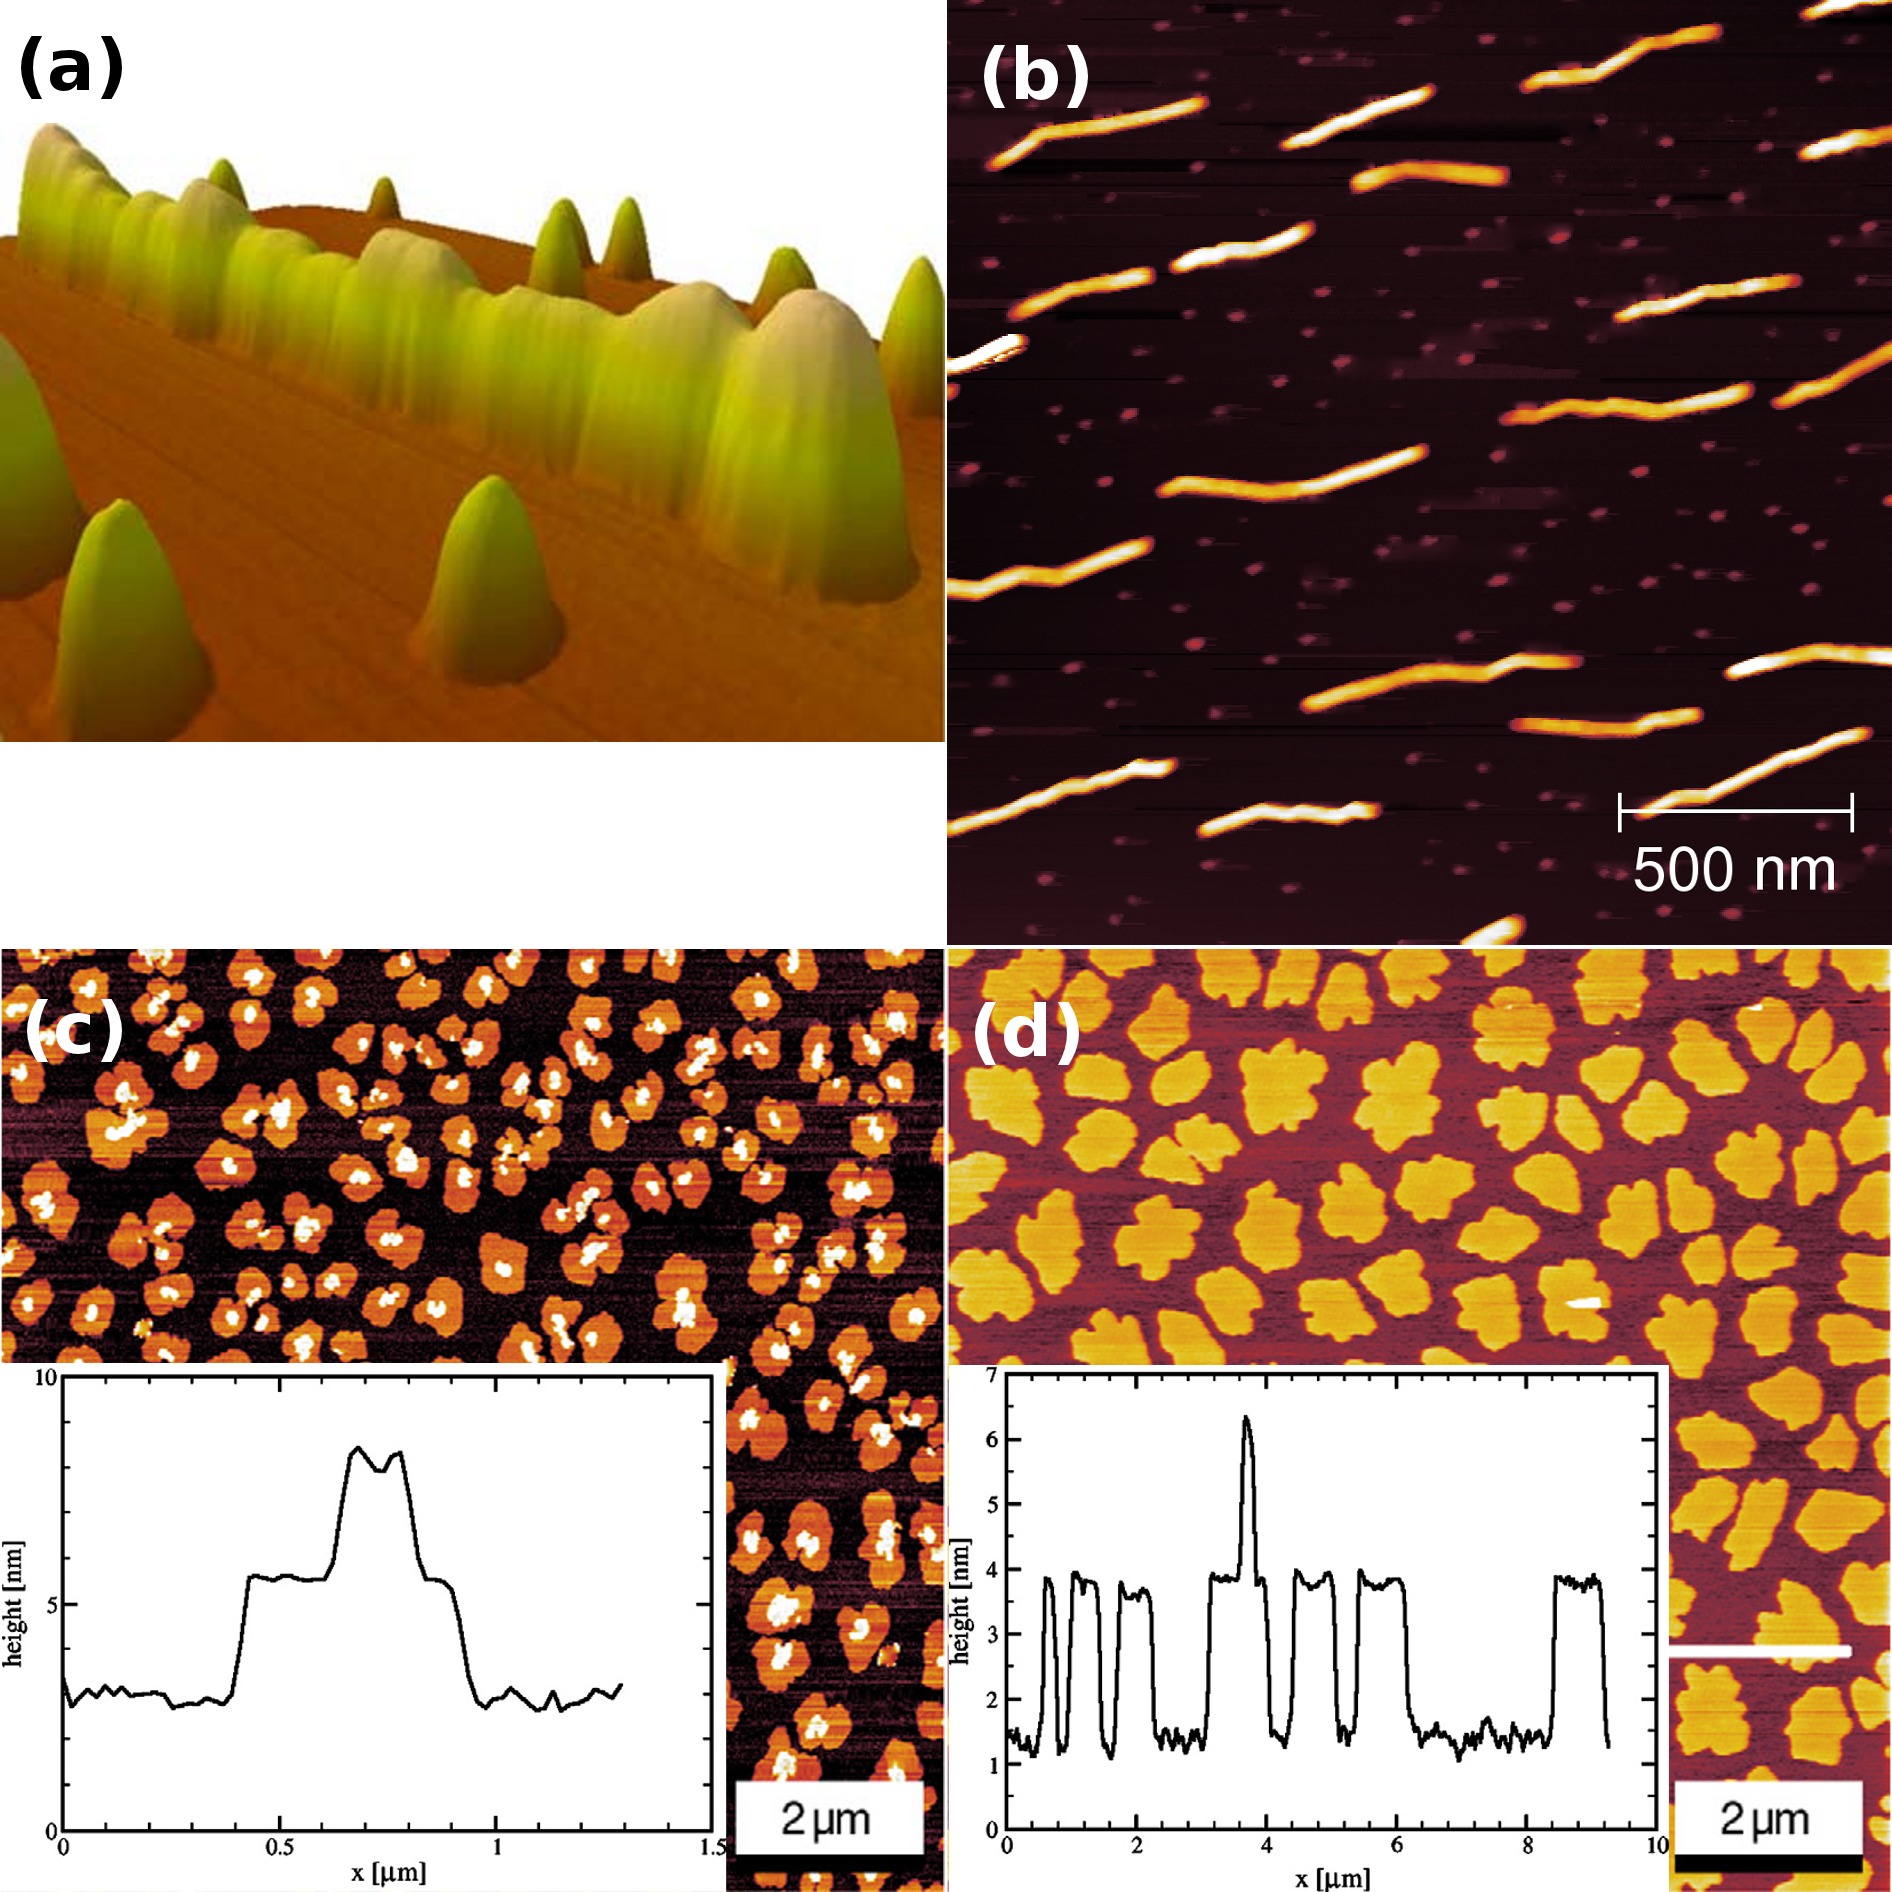
Figure 6(a) represents a particular interesting case of nanofiber formation on mica(0001). Here, the spontaneous rearrangement of small crystallites on top of a wetting layer into chains of crystallites is observed [88]. We will discuss this interesting growth later in more detail. Changing the growth method from the used High Vacuum (HV) Hot Wall Epitaxy (HWE) to Organic Molecular Beam Epitaxy (OMBE) under Ultra High Vacuum (UHV) conditions does not not influence the existence of a wetting layer. However, as can be seen from figure 6(b) this change in growth conditions results in the formation of larger more uniform chain segments with a less pronounced internal structure [93, 92, 94]. The above mentioned rearrangement process happens in–situ during HWE growth.
The influence of the vacuum conditions can also be seen in photoluminescence (PL) spectra obtained from these anisotropic fibers (figure 7).
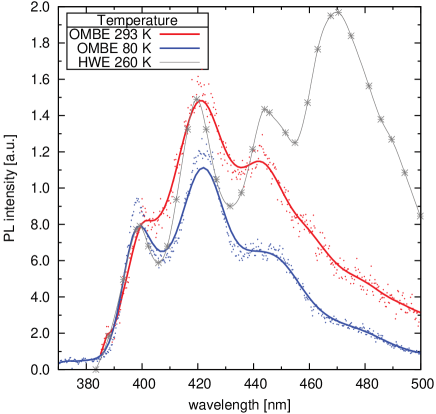
In contrast to steady state PL spectra obtained from HV HWE grown 6P fibers [95], the broad band emission around 480 nm is suppressed for UHV OMBE grown fibers. The missing band at 480 nm can be connected to defect states resulting from structural defects. The absence of this band suggests a higher quality of the OMBE grown films.
The important conclusion of the above observation is the following. HV conditions are usually sufficient to obtain reproducible and well performing organic thin films. Given that the molecules are reasonable stable against oxidation and UV light the obtained structures do not change over time in ambient conditions. However, the morphology (and the resulting properties) of organic thin films can easily be influenced by other small molecules. Results obtained under (U)HV conditions should be carefully reviewed with respect to their validity under ambient conditions. In particular wetting layers and other possibly metastable structures far away from the bulk structure are sensitive to adsorbates.
Figure 6(c) and (d) show the result of two different approaches to reorient the molecules from flat lying to upright standing. The molecules forming the crystallites and fibers in figure 6(a,b) have their long molecular axis parallel to the substrate. To obtain the morphology presented in figure 6(c) a surfactant222The term surfactant is used here for a substance that influences the growth.—namely carbon—has been predeposited on the clean mica(0001) surface. TDS has revealed that the full saturation coverage of surfactant completely suppresses the formation of a wetting layer [92]. In the presence of the surfactant, 6P films of upright standing molecules are formed. Similar experiments have been performed with 6P [69] and 4P [96, 97, 98] films on gold surfaces. In both cases, a reorientation of the molecules has been observed. It has to be pointed out that prior to the flat–lying/upright transition the epitaxy between the molecular film and the substrate is weakened. For the growth of 4P on Au{111} this is very well documented. On a clean Au{111} surface, the (211) contact plane of 4P has all molecules with their long axis parallel to the surface. Half of the molecules have their –system parallel to the surface. After the addition of only 15% of a monolayer of carbon, the 4P contact plane changes to (201). The long axis of the molecules is still parallel to the substrate surface. However, in this 4P plane all molecules are tilted into an edge–on configuration, where the –system is not fully facing the substrate anymore. At the same time, the in–plane molecules loose their alignment with the substrate. After a further increase of the surfactant coverage to 0.5 ML, the molecules obtain an upright standing orientation. The new contact plane is the 4P(001). The weakened interaction with the substrate results in the formation of bent 4P nano–fibers with a (201) contact plane on gold and eventually the formation of mounds composed of upright standing molecules [96, 97].
Finally, figure 6(d) also shows 6P islands on mica formed by upright standing molecules. However, this morphology has been achieved by breaking the surface symmetry of the substrate by ion bombardment of the substrate [92]. The nominal 1 nm thick film presented in figure 6(d) consists of islands formed by upright standing molecules as is demonstrated by the cross section presented in the inset. The same reorientation can also be achieved by heating mica substrates to elevated temperatures [93]. More insight into the possible root cause for the reorientation on mica has recently been obtained using TDS. Putsche et al. demonstrated recently that the existence of a wetting layer and the final orientation of the molecules is determined by the amount of potassium present on the surface [99]. The mechanism for the reorientation is similar to what has been shown above for a carbon predeposition.
Although similar experiments exist for other small conjugated molecules, the above series of experiments is unique as it clearly shows the importance for a well ordered periodic substrate which can guide the molecules. The gradual loss of this guidance initially leads to an inferior quality of the crystals formed by flat lying molecules. Finally, after significantly disturbing the surface order by surfactants or sputtering, the molecules choose to form films where their long molecular axis is perpendicular to the substrate surface. The loss of order in the substrate can be the result of a surfactant layer, sputtering, or the molecules themselves acting as homosurfactants. The latter is in particular true if the molecules are adsorbed on the substrate in a hit–and–stick mode. The initial molecules can not align in an ordered manner and create a disordered substrate for the next layer [100, 101]. As expected from this discussion, using an amorphous substrate such as SiO2 will lead to the formation of films formed by upright standing molecules [102, 64, 103]. However, often the layer of upright standing molecules itself can again act as a well ordered substrate and can promote the successive growth of structures formed by lying needles. See for example the needles forming on the 6P mounds grown on sputtered mica, as presented in figure 9(b,c) [76].
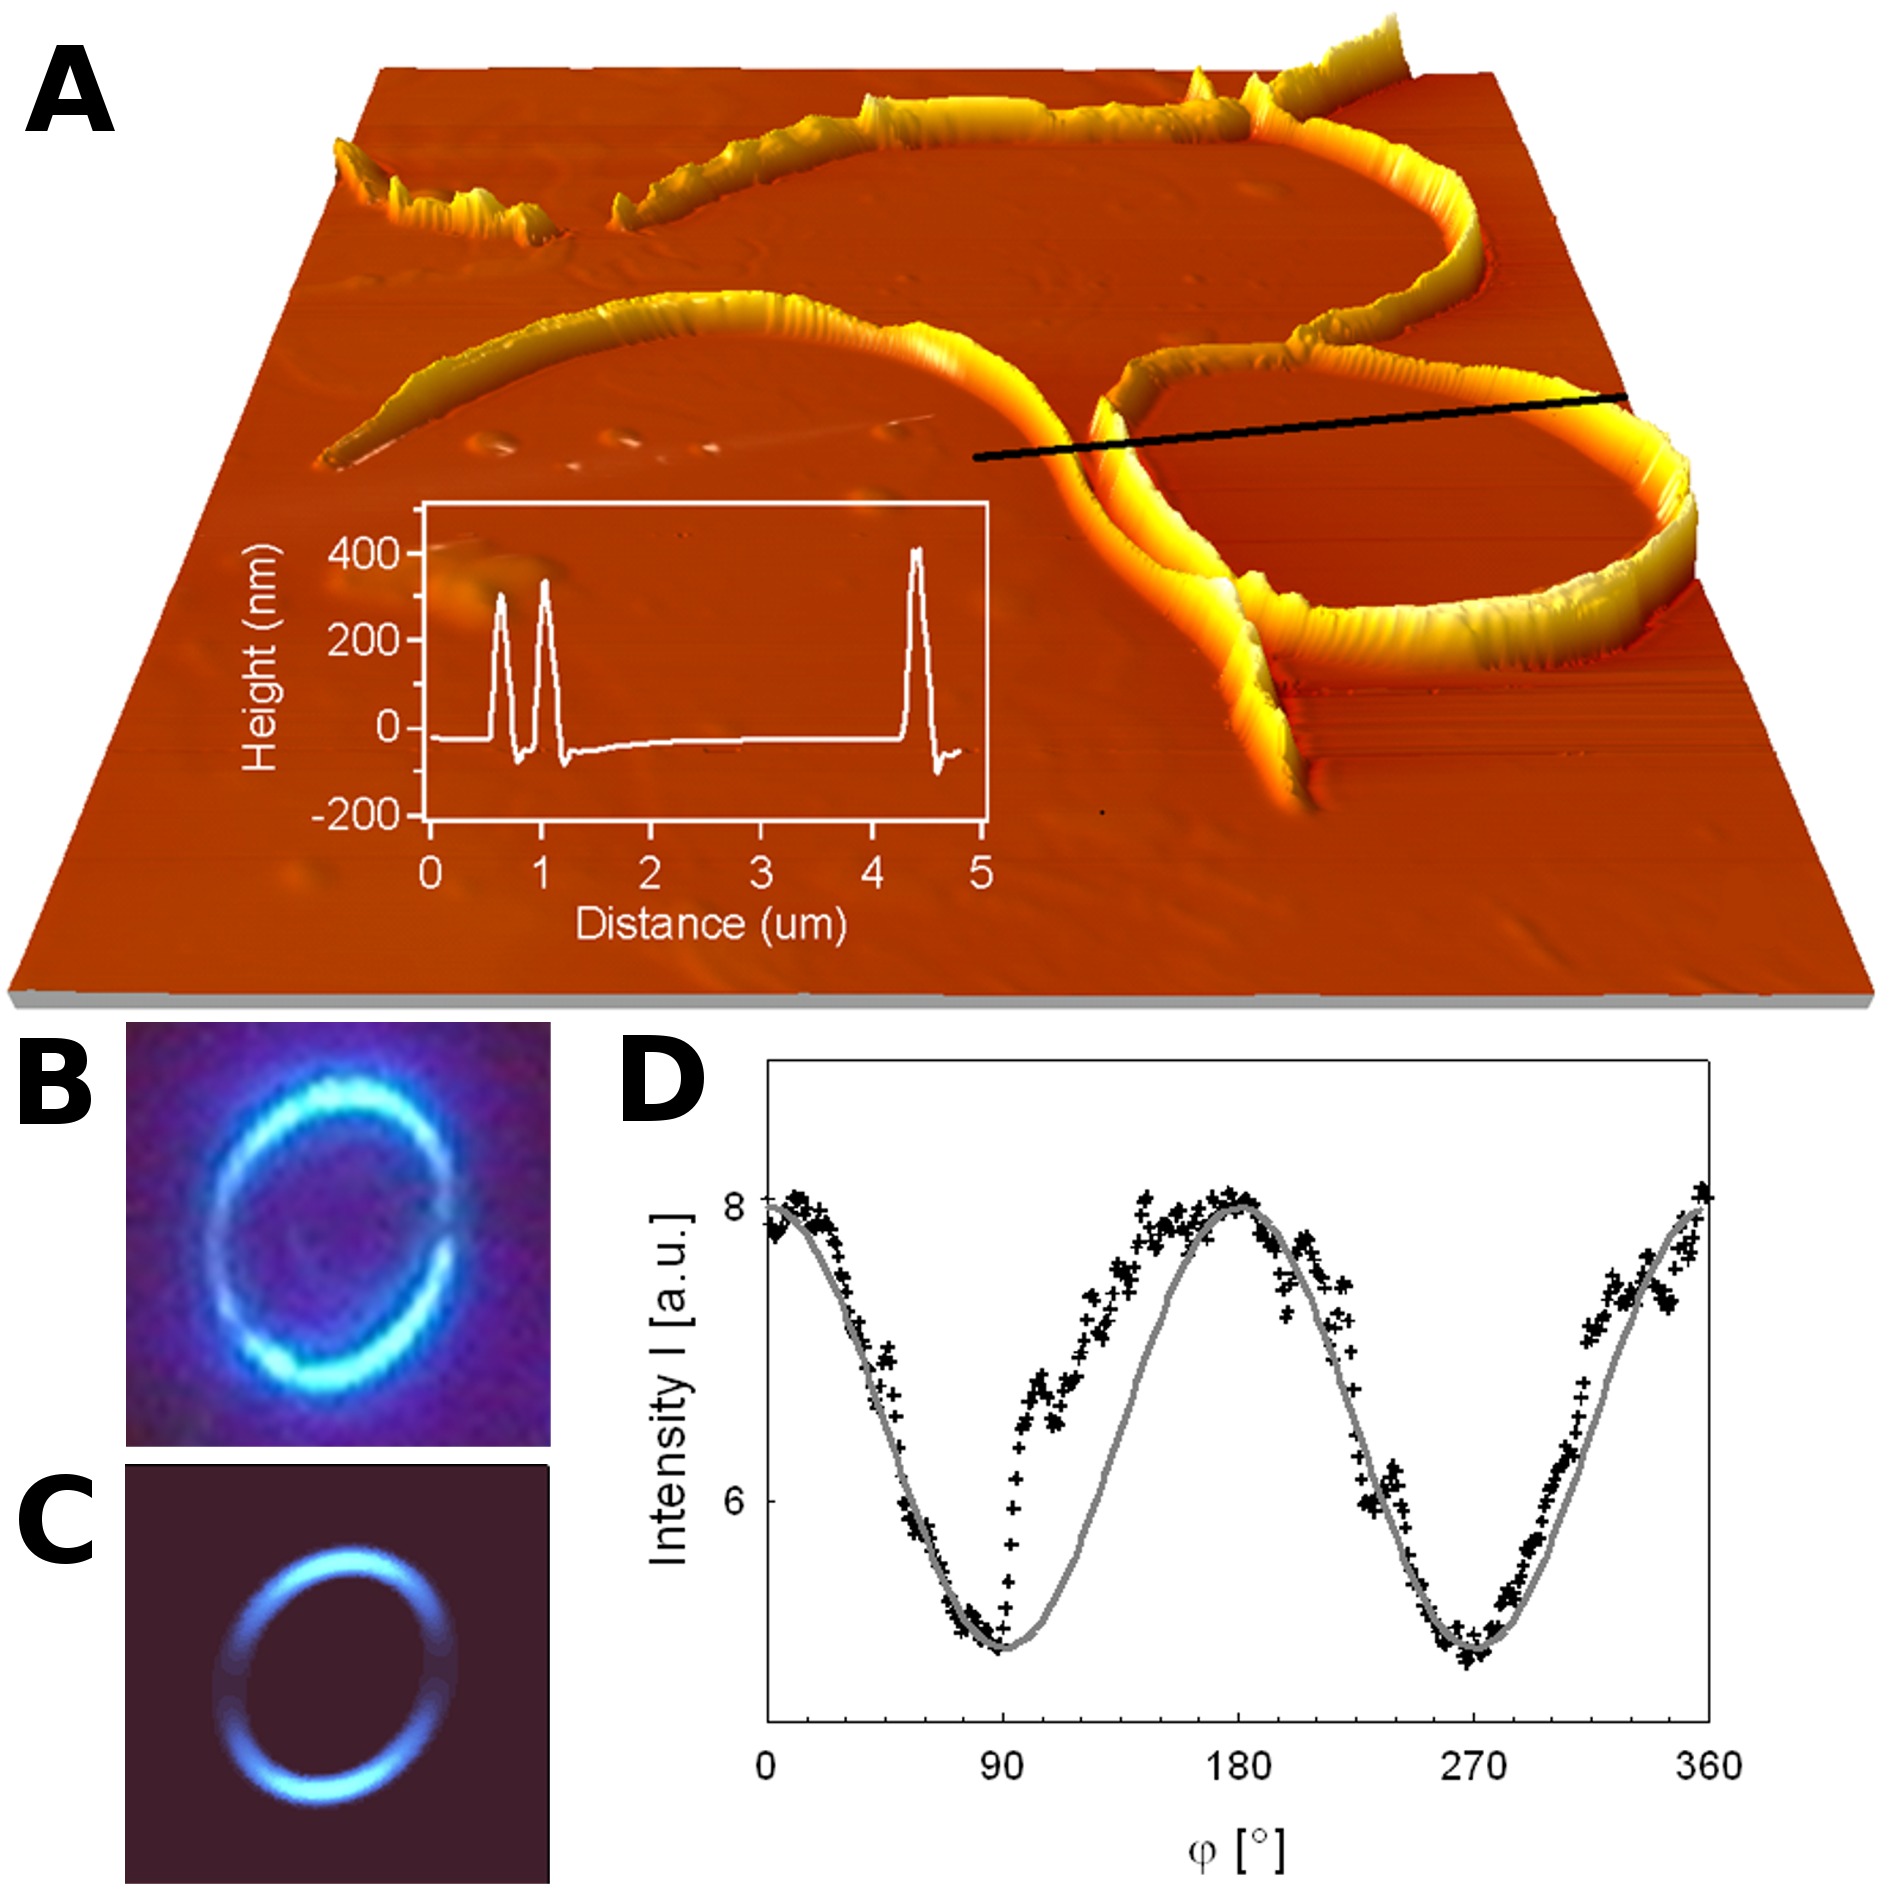
The mica surface has been pretreated with either water or methanol to remove the potassium atoms from the cleavage surface [105, 106]. It has been shown by AFM that the so created rings are several hundred nanometer high and have a typical diameter of 4 m (see figure 8(a)). The luminescence micrograph presented in figure 8(b) and the corresponding simulation (figure 8(c)) reveal two things. First, the molecules are lying flat on the surface, and second their in–plane orientation rotates along the ring. As only molecules having their long axis parallel to the polarization of the incoming light yield maximum fluorescence, one observes a sinusoidal change in intensity along the ring (figure 8(d)) [104].
3 Diffusion and thin film growth
In the previous section we have discussed the initial stages of film growth i.e. the nucleation. After islands with a certain orientation have formed they need to grow, coalesce, and evolve into a complete film. Unfortunately, the asymmetric building blocks used, often favor the formation of rough and anisotropic surface structures [76, 107, 108, 109]. Typically, one aims at a smooth film with a low number of grain boundaries and a flat surface. Grain boundaries represent inhomogeneities in the thin film and will have a negative effect on the transport properties [110, 111, 112, 113]. On top of that they also affect the optical properties of the thin film devices such as nano fiber wave guides [114, 104, 115, 116]. Different growth techniques have been employed to achieve a smaller number of grain boundaries. Notably the use of thin organic layers [19] or Self Assembled Monolayers (SAM) [117] and Super Sonic Molecular Beam Deposition (SuMBD) [118] allow to influence the grain size without changing the substrate.
As has been discussed in the introduction, there can be severe deviations from the thermodynamic growth modes (figure 3), if the necessary diffusion mechanisms are kinetically hindered. The analysis of the morphology and if necessary structural information allows to extract important physical quantities such as step edge barriers as well as parameters describing the growth mechanism. The generalized rules that can be deducted from the in–situ and ex–situ observations of film growth are valid for many molecules.
3.1 Mound formation
As we have discussed earlier, thin films of conjugated organic molecules which have their long axis perpendicular to the substrate are desired for OTFT like applications. Although several approaches exist to achieve this desired orientation, the resulting films are often characterized by the formation of growth mounds due to rapid roughening [11, 9, 108, 19, 119, 120]. The resulting rough interface is undesired as it negatively affects the charge carrier mobility [22, 19, 20, 21]. Nevertheless, these rough films have been studied in the past as they allow interesting insights into molecular diffusion processes and thin film growth mechanisms.
The process of rapid roughening is a result of an imbalance in the surface diffusion over step edges. If the downward particle flux over the step edge is dominating, the desired Layer–by–Layer growth mode is facilitated. However, in the case of a high step edge barrier for downward diffusion, which is described by a significant additional barrier—the so called Ehrlich Schwoebel barrier (ESB) [26, 25]—mound formation will occur and rough morphologies are the result. For the case of a very high ESB and realistic growth conditions, only atoms landing on the terrace will be incorporated into terrace . The coverage of terrace at time for a given amount of deposited material with the flux can than be expressed by a Poisson distribution
| (9) |
Because will always be smaller than 1, the first layer—and also all subsequent ones—never closes. As a result steep trenches are observed. Such Poisson shaped mounds have been described in inorganic systems already early indirectly [121] and using real space methods [122]. An in–depth theoretical analysis has been conducted later by Elkinani and Villain who used the ancient Greek Zeno Paradox to describe a peculiarity of the mound formation [123, 124]. In thin film growth, the Zeno Paradox describes a situation where narrow trenches between mounds get so narrow, that the probability for an atom or a molecule to land in the trench becomes increasingly smaller as the trench width decreases. After the unlikely event of a molecule entering the trench, the now narrower trench will have an even smaller probability to be filled by further molecules, and thus stays open. For this to be observable, a high step edge barrier has to prevent molecules landing on higher lying terraces from descending onto lower terraces deeper in the trench. As a result, the mounds get higher and higher but would never coalesce thus the substrate would not be covered completely.
A detailed analysis of the involved atomic or molecular diffusion processes shows that in fact the time scales for the different basic processes play an important role [125]. First, there is the traversal time
| (10) |
a particle needs to visit all the sites on an island. Here, corresponds to the size of the island (measured in lattice sites). The flux of incoming particles determines the time
| (11) |
between the arrival of the particles forming the film. Finally, the residence time [126, 125, 127, 128]
| (12) |
describes the time a diffusing particle spends on an island with a characteristic size ( is the island’s circumference). Here, and are geometry dependent constants. While, the first term is on the order of the residence time (12), the second term accounts for the increase in residence time due to the step edge barrier. The ratio of the hopping rates for on terrace jumps (3) and
| (13) |
for step edge crossings, can be used to obtain the additional step edge barrier between the barrier for on island diffusion and the barrier for step crossing . It is crucial to realize at this point that and therefore also can only be effective values for interlayer mass transport. Different edge terminations can in fact have very different hopping rates and barriers. It is important to note that of all involved processes the one with the smallest energy barrier will be the dominating one, provided that the morphology connected with it is occurring frequently [24]. A very good review on mound formation can be found in ref. [2].
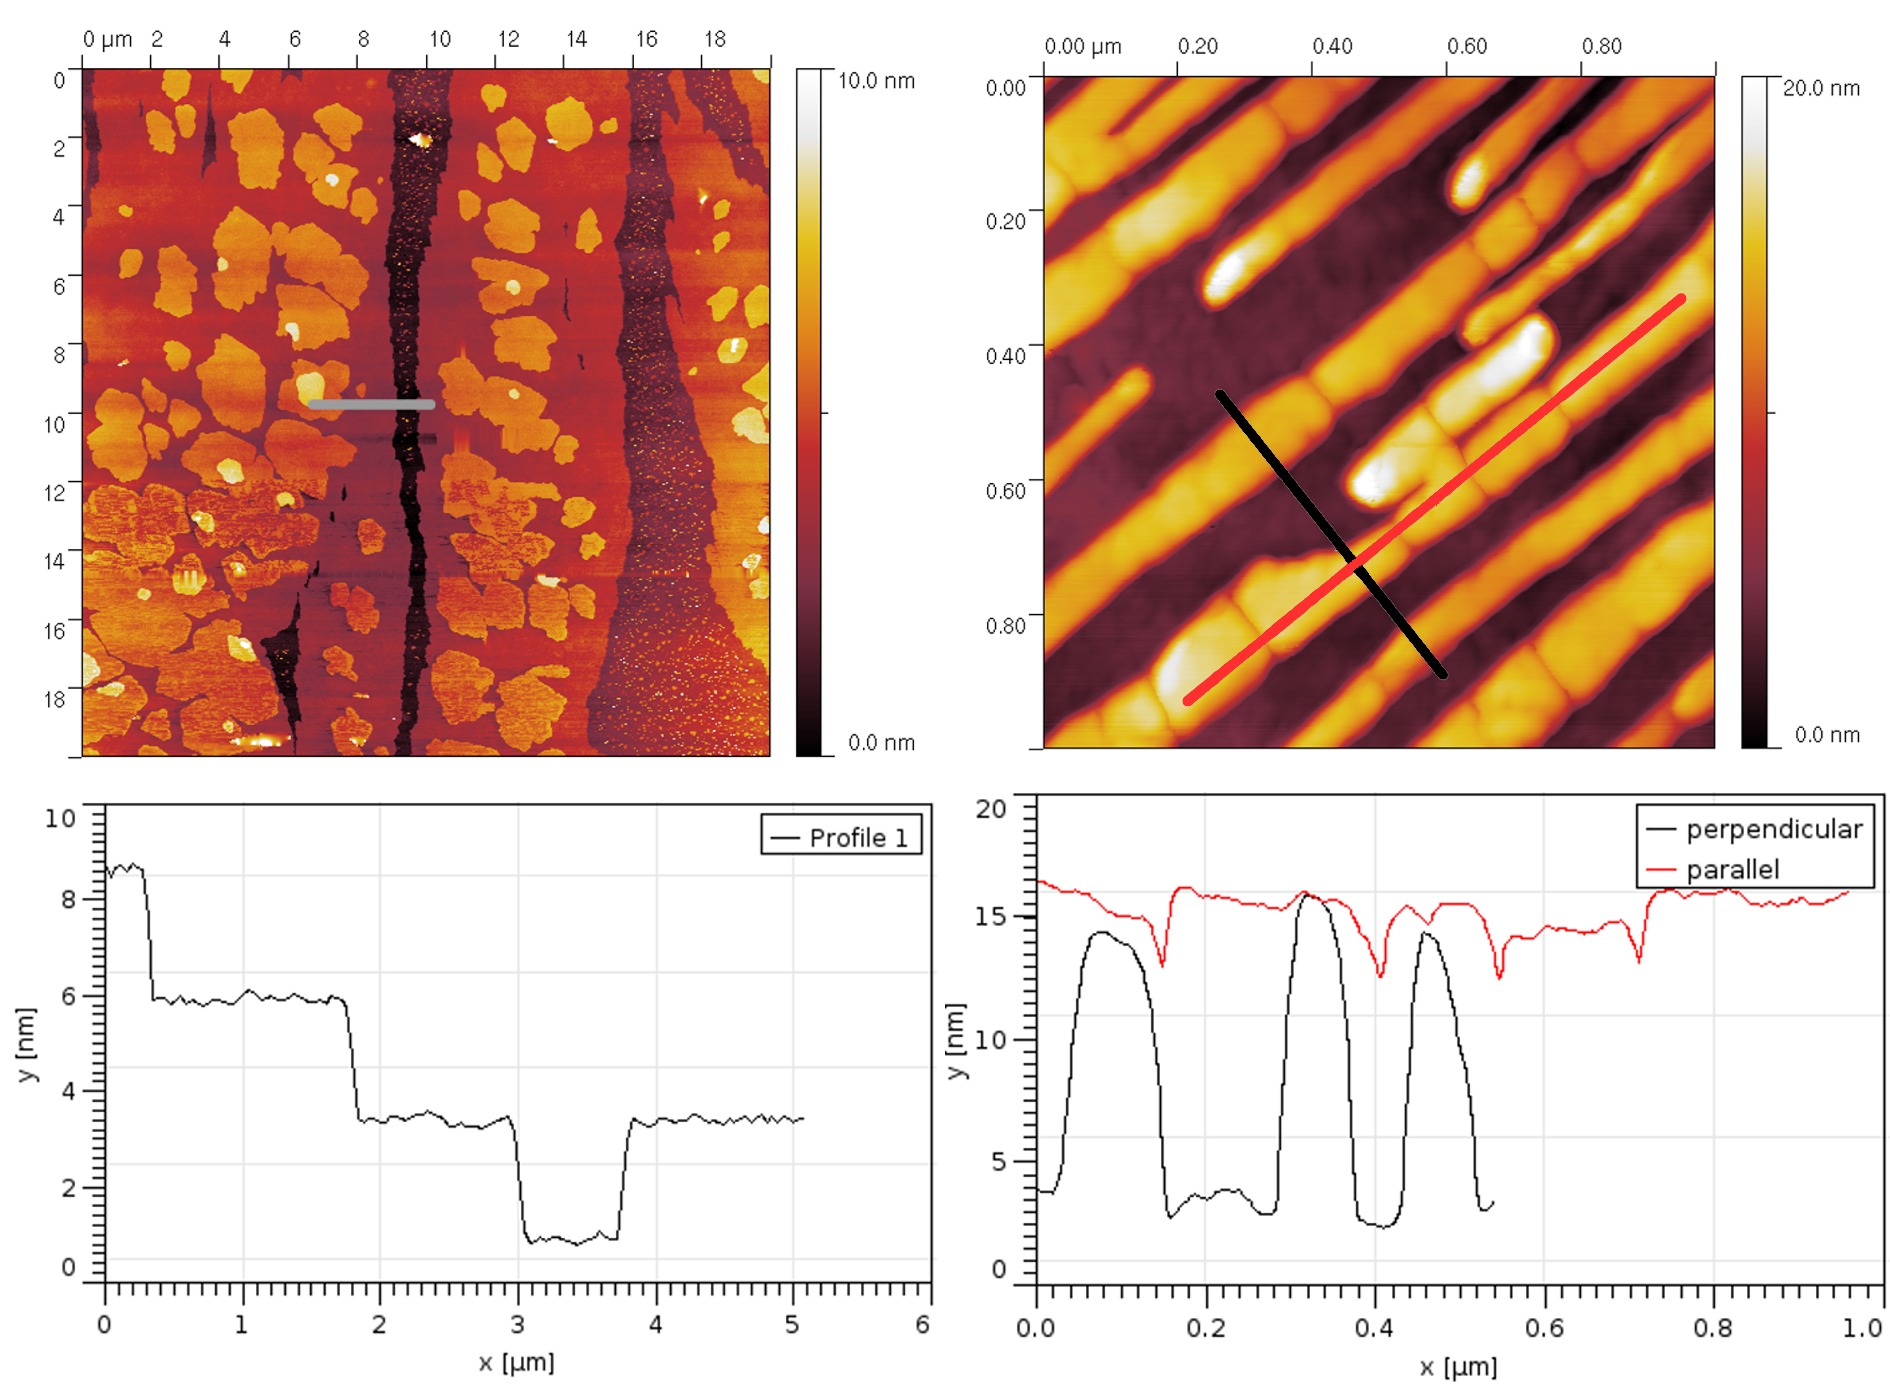
Prototypical examples of mound formation in thin films formed by rodlike molecules can be found in particular for pentacene [9, 129] and para–Sexiphenyl [76]. Figure 9 gives an overview on the morphology of growth mounds formed by 6P on a sputtered mica surface at 300 K.
Careful sputtering of the crystalline mica(0001) surface destroys the symmetry of the surface and results in an disordered surface with an unchanged chemical composition [76, 92]. This modification reorients the otherwise flat lying molecules into an upright orientation. With increasing film thickness pronounced mounds start to form on the mica surface. As can be seen from figure 10 and the corresponding
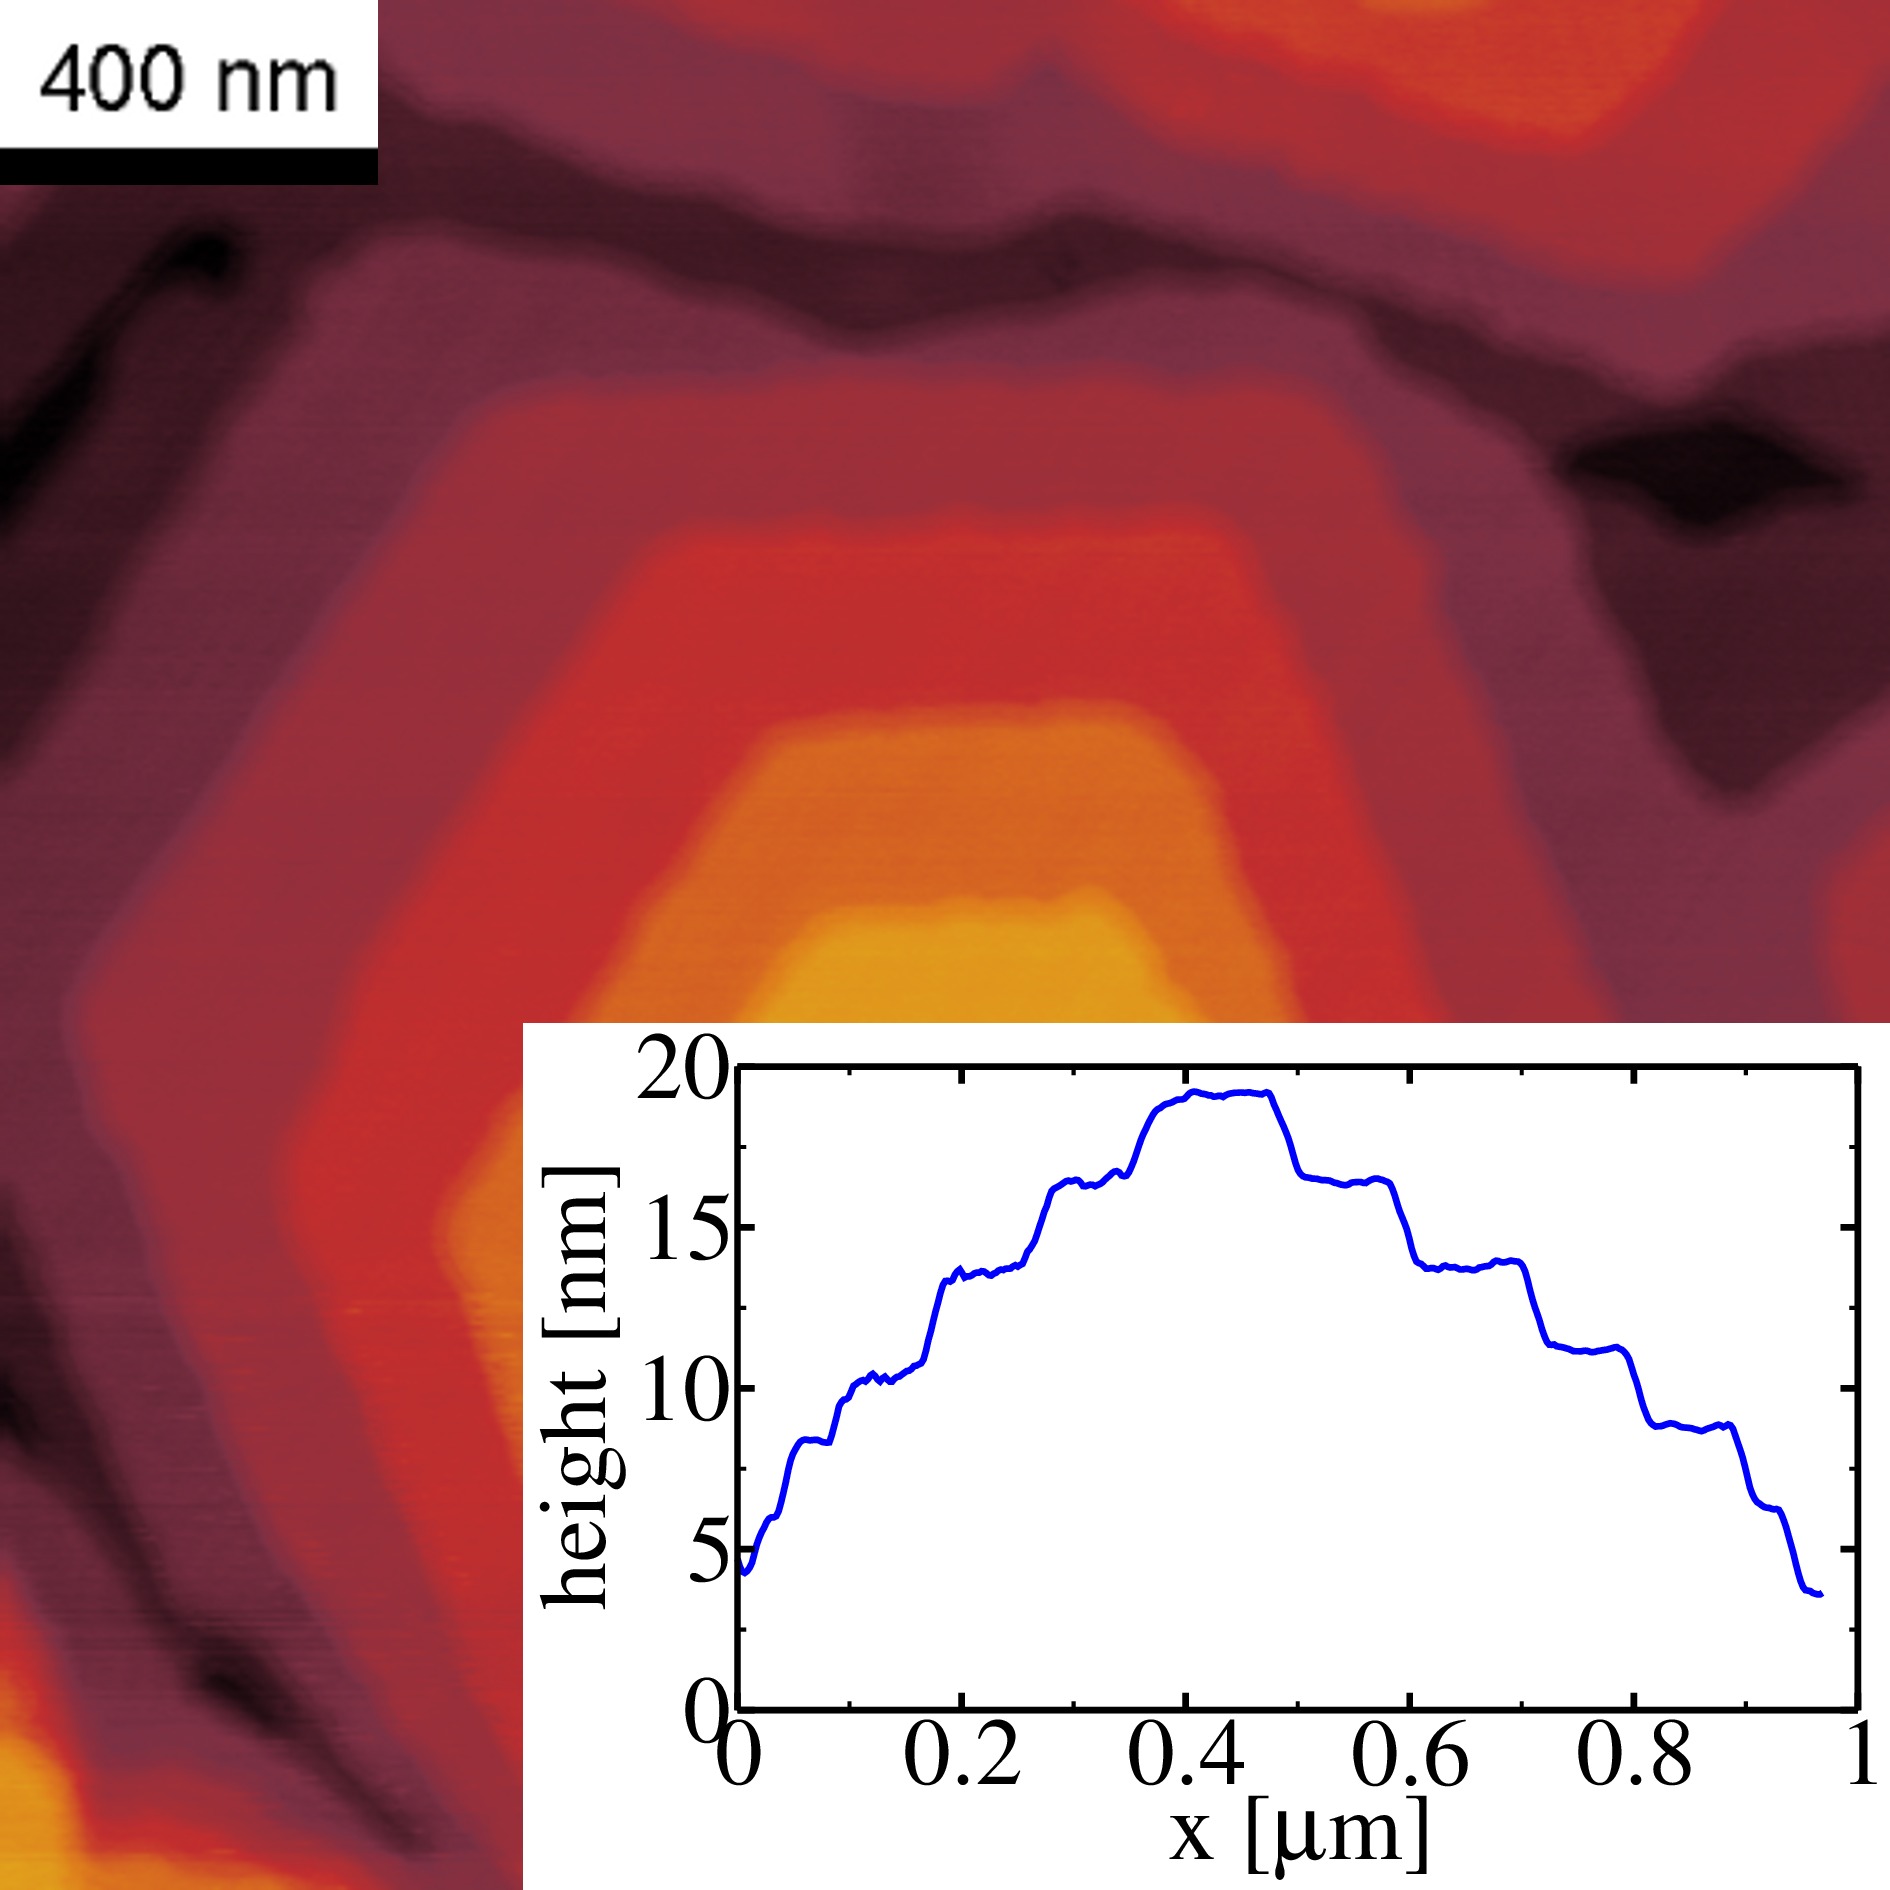
cross section the mounds are formed from upright standing molecules and exhibit an irregular hexagonal shape. The steep trenches and the change in curvature of the mound slope that characterizes this morphology are an experimental verification of the Zeno Paradox described by Elkinani and Villain [124].
An analysis of this growth behaviour [125, 130, 131] allows to extract the step–edge or Ehrlich Schwoebel barrier active in such a system [76]. The step edge hopping rate in the system can be obtained from the top terrace diameter [125]
| (14) |
The size of the top terrace is limited by the fact that for terraces larger than nucleation will occur on top of it making it the second to top terrace. For the above presented film, has been measured to be 40 nm20 nm [76]. The probability for such a nucleation event is related to the ratio between (11) and the residence time (12). The hopping rate for the on–terrace diffusion can be obtained from kinetic nucleation theory [5] which relates the nucleation density to the hopping rate and the flux via (2). The average island distance is measured to be 1 m [76] for the film presented in figure 9. The relevant time scales here are again (11) and the traversal time (10). The fact that the so obtained value for eV is 30 times higher than the barrier for 6P diffusion on top of a 6P(001) terrace (0.02 eV determined by molecular dynamics calculations [76]) gives rise to the pronounced mound formation in this system. Such high barriers are not uncommon for organic systems. Fendrich et al. report 0.78 eV for the Ehrlich–Schwoebel barrier of flat lying 3,4,9,10-perylene–tetracaboxylic–dianhydride (PTCDA) on PTCDA(102) using empirical potentials and the nudged elastic band method [132]. For both systems—6P and PTCDA—the calculated diffusion barrier on the terraces is smaller by at least one order of magnitude.
However, further careful analysis shows that the above used method is only valid for the case of . As we have seen in section 2.1 (figure 4) this is rarely the case in organic systems [85, 62]. Following the arguments of [126] we obtain
| (15) |
with . Depending on the detailed balance of the above presented time scales (10)–(12) one arrives at one of four possible regimes. For regime I where we obtain pure Poisson growth. Regime II extends from , where for all . The exponents in (15) are than given by
| (16) |
For larger values of but still smaller than the exponents take the form
| (17) |
For , we enter the regime of weak barriers and the mound cross section starts to deviate from the above presented wedding cake shape. Figure 11 plots the evolution of in regime II and III for different together with the extent of their validity.
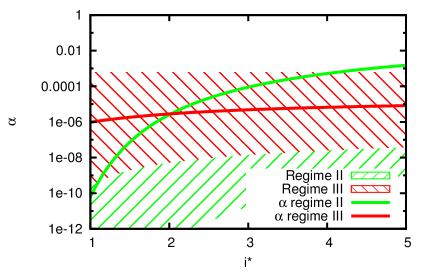
As one can immediately recognize, regime II is only valid for the case of . The value of can be expressed in terms of the step edge barrier using (3) and (13). The exponential prefactors and are assumed to be equal. As the current regime II reproduces the scenario used in [76] we obtain a similar result of eV. The difference is attributed to the factor of probability which has a small effect on the final result and is neglected for this overview. This result is only valid if the pair dissociation time , which is not the case for . We do find valid solutions for (this regime III in [126] and [133] corresponds to regime I in [125]). A smaller barrier of eV is obtained in this regime. From figure 11 one can see that there is a weak dependency of on . However, the change is within the error bar of the experimental data used as input for the calculation. As discussed above, for values of above or below the marked regions II and III one enters pure Poisson growth or the weak barrier regime. Please note that for larger , regime III splits into a fluctuation and a mean field regime with identical scaling exponents, and the evolution presented in figure 11 has to be carefully reviewed for . The difference being that for a small number of involved particles the common mean field approach is not valid. The above presented method—taking into account the statistical nature of the initial nucleation—is needed in the case of small numbers. The complete phase diagram of vs can be found in [126]. However, taking into account the size and dimensionality of the building blocks we expect the fluctuation governed regime to be valid for larger values than for atomistic processes.
However, the barrier—even for the same edge—must not necessarily be constant during thin film growth. Two things have been revealed for the initial growth of 6P on sputtered mica (see figure 6(d)). First, for the given film thickness too few second layer islands have nucleated. Second the island are only 2 nm high, indicating a larger tilt angle for the molecules. As a result a value of eV is reported for the first layer ESB in [76] using the method presented in [125]. However following the arguments presented above, this calculation and the size of the resulting step edge barrier has to be carefully revisited. The analysis based on [126] shows that only for regime III a valid solution can be found. In regime III the critical islands size for second layer nucleation
| (18) |
can be calculated using the exponents
| (19) |
An additional problem in this calculation arises from the fact that in
| (20) |
which relates the second layer island fraction to the critical island size for nucleation we find the exponent . This exponent is known to be 5 for fluctuation controlled nucleation in regime II in case that [125]. By comparing (15) with (18) in [126] and (21) and (22) in [125] we obtain the general expression for regime III . The result of these considerations used in (18), (19), and (20) is plotted in figure 12.
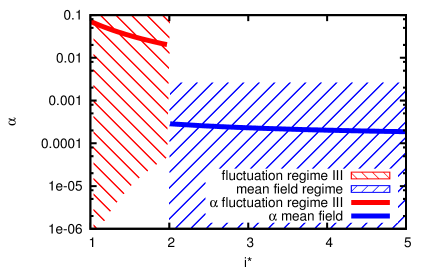
The red curve shows the expected for different in regime III. Although this curve ranges within its limits for small and large , the general condition for the validity of the fluctuation controlled regime
| (21) |
limits its extend to values of . For larger values of the mean field approach from [133] becomes valid. Based on the expressions (8b) and (7) in [133] we obtain
| (22) |
and
| (23) |
for the critical island radius (22) and the second layer island fraction (23). For the limit of high barriers—so that —the exponent has the form . The result is plotted in blue in figure 12. Based on this new analysis of the second layer nucleation we obtain a step edge barrier eV in the fluctuation controlled regime for . For larger values, as we deal with here, we obtain eV using the mean field approach. The latter result has only a very weak dependence on . The value of for second layer nucleation of at least 0.1 eV is substantially different from the above presented result obtained from the Zeno Paradox and the overall mound shape of thicker films ( eV). The observed change in molecular tilt angle for the first few layers [76] can explain this discrepancy. A molecule crossing the step edge with its long molecular axis roughly perpendicular, will bend over the edge while descending. As the molecular tilt in the (001) plane gets smaller the necessary bending and thus the required energy gets smaller, too.
The situation for a nucleus formed by flat lying molecules is more complicated, since we can not estimate the order of the dimer dissociation time from the finite dimer energy. In addition sterical hindering during the nucleation starts to play a role and one enters the regime of ALA [85]. In principle, the above considerations can be extended into this regime. For such a situation the exponent in (2) obtains the form [134]. In addition, the growth laws—forming the foundation for the calculation—will play an important role.
When the molecule crosses the step edge it performs a complicated sequence of twisting, rotating, and bending [77]. All these processes are costly in terms of energy, and add to the final barrier height the molecule has to overcome. However, the molecule will take the pathway for which all contributions are added in such a way that the final barrier will be minimal. In particular, for a molecule crossing the step edge with the long axis roughly perpendicular to the edge, the bending energy is a significant contribution. A decreased tilt of the molecular backbone during the crossing lowers this energy term and consequently the overall barrier height.
The existing studies demonstrate that the prediction of barrier heights is complicated and full of pitfalls. For the presented case, a good agreement has been achieved initially between theory and experiment. The analysis assumed a molecule that crosses the step edge with the long axis perpendicular to the edge [76]. However, after relaxing some of the constraints used, other trajectories—with lower barriers (( eV))—involving difficult Fosbury Flop–like movements at the step edge were found [77]. The above presented new analysis of the experimental data is in good agreement with the evolved molecular dynamics simulations that predict a complicated step edge crossing process and comparable barriers. Focused research in this direction is important, as mound formation and layer dependent ESB values are common in organic thin film growth. A level dependent ESB (e.g. as described above and in [76, 135]) often goes hand in hand with a change in tilt angle of the molecular backbone. However, the proposed Fosbury Flop–like step edge crossing can not explain the experimentally observed step edge barrier reduction. Provided the ESB becomes small enough the initial layers can completely close [135]. Other examples include the growth of DIP on native SiOx, which is characterized by a transition from LbL growth to mound growth. This is explained by changes in the interlayer mass transport [119].
Care has to be taken when comparing experimental results with simulations and DFT based calculations. It is important to realize that the experimentally obtained barriers based on averaged mound shapes represent the effective barrier in the entire film. Using well defined step edges (the (100) in [76, 77]) allows detailed insight into the dynamics of the step edge crossing for the specific facet. However, the elongated hexagonal shape of the 6P islands (see figure 10) has at maximum 2 of these (100) step edges. In addition, these two (the (100) and the ()) will also have different tilt directions (inward and outward tilt) with respect to the top surface, which in turn are both different from the tilt angle of the other unit cell facets (the vertical (010) facet) and other possible step edges. This and other peculiarities of molecular step edges (see also Appendix B in [77]) show how difficult it is to make precise predictions of experimentally obtained values for step edge barriers.
3.2 Growth of three-dimensional islands and fibers
Although smooth films are usually preferred, the crystalline and one–dimensional nano–fibers presented in figure 6(a,b) are one out of many examples of a useful non–smooth morphology. It is important to remember that these anisotropic structures grow from flat lying molecules. The previous section dealt with upright standing molecules where no or only a weak anisotropy in the substrate plane can be expected. In particular, the fact that blue lasing [115, 136] has been shown for these fibers and that they can be used as waveguides [137] opens several possibilities for applications.
Two cases have to be separated here. While often three-dimensional fibers grow directly on the substrate (Vollmer–Weber growth), in particular the fibers found on mica grow on a metastable wetting layer (Stranski–Krastanov growth). In both cases the molecule–molecule interaction dominates over the molecule–substrate interaction. The difference between these two types of interactions is large enough to facilitate the rearrangement and reorientation of entire crystallites as entities.
The rearrangement of crystallites containing more than 140000 molecules is observed during the HWE deposition of 6P onto crystalline mica(0001) at 360 K [88]. During the deposition of 6P, first a wetting layer is formed. With increasing coverage crystallites grow on this wetting layer. However, after a critical amount of 6P has been deposited a rearrangement takes place and fibers—formed by the already existing crystallites—become the dominating morphological feature. Figure 6(a) shows such a chain of crystallites. The particular arrangement of the individual chains with respect to each other (see figure 13(a))
is explained by a strain relaxation mechanism at work in this system [88]. The stress induced by the crystallites in the wetting layer leads to the formation of a defect network (indicated by green lines in figure 13(a)) that guides the rearrangement process of the crystallites. It is important to realize at this point that during this rearrangement process the crystallites move as entities. This relocation of whole 6P crystallites on mica(0001) is possible due to the delicate balance between the strong intermolecular interaction and the rather weak film substrate interaction. Detailed x-ray diffraction (XRD) studies have revealed the epitaxial relationship between 6P and the mica(0001) surface [138, 14]. In particular, they have shown that once the formation of needles sets in, the initially compressed spacing of the planes quickly relaxes towards the bulk value [139].
Recently, a bimodal size distribution for the crystallites on crystalline mica has been observed. However, this behaviour for ultra–thin layers at a slightly elevated temperature of 400 K is only observed after exposing the samples to ambient conditions. Using TDS before and after exposing the sample to ambient conditions as well as AFM revealed that the initial present wetting layer is transformed into small crystallites. This second generation of smaller crystallites forms between the already existing fibers or chains of crystallites. [140] For thicker films, the material from the wetting layer is most likely captured by the large number of existing big crystallites and fibers. In figure 13(b) a thick film where long 6P needles have formed is presented. Several small second generation crystals are visible in the inset of figure 13(b).
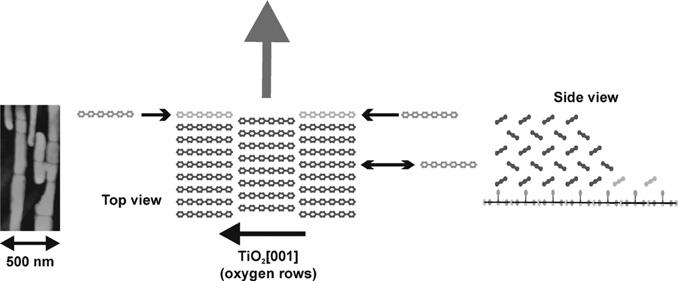
As we have seen for the case of crystalline mica versus sputtered mica, the substrate plays an important role in determination of the molecular orientation. However, also a particular surface reconstruction can provide an interesting growth template. The (11) reconstruction of the TiO2{110} surface is characterized by parallel rows of protruding oxygen atoms. These rows run along the [001] azimuth [141]. The spacing of 6.5 Å is sufficient to accommodate the width of a 6P molecule. Deposition of 1.3 ML of 6P at 400 K leads to the formation of large islands formed from upright standing molecules presented in figure 14(a). The islands are separated by trenches filled with small crystallites which are a few monolayers high. The trenches run parallel to the oxygen rows along the [001] azimuth of the TiO2{110} surface [142].
The islands themselves are polycrystalline with four domains symmetrically spaced around the [001] direction. With a size of only 300 nm by 30 nm, these domains are much smaller than the several m large islands they form. The long axis of these domains is also oriented along the [001] direction [144]. The reason for this growth behaviour is rooted in the diffusion anisotropy present on this surface. The molecules can easily diffuse along the [001] direction guided by the oxygen rows. Analysing the width of the area in the trenches which is depleted from the small crystallites, one arrives at a ratio for the anisotropy between the diffusion along [001] and [10] of 4 to 64 [145]. This is clearly a property of the TiO2{110}–(11) substrate surface since second and third layer islands show an isotropic shape. All these structures formed by upright standing molecules grow on top of a wetting layer of flat lying molecules [146]. Such flat lying–to–upright transitions have been observed for 5A on Cu{110} [147] and other systems. For 5A on Cu{110}, the transition involves a flat lying wetting layer, which is followed by an intermediate layer having a herringbone structure with the long molecular axis parallel to the substrate. For layers thicker than 2 nm an upright standing orientation is found in this system.
Lowering the growth temperature to 300 K results in a complete change of growth morphology, molecular orientation, and mesoscopic structure orientation. The morphology presented in figure 14(b) is characterized by long and high polycrystalline 6P fibers. It is important to realize that these fibers run parallel to the [10] and thus perpendicular to the oxygen rows and the trenches observed at higher temperatures. These fibers are formed from flat lying molecules that have their long axis roughly parallel to the substrate surface and are oriented along the [001] direction of the TiO2{110} surface. In addition to the diffusion anisotropy active at high temperatures here the sticking probability for molecules to be incorporated into existing fibers plays an important role. The long side walls of the fibers are terminated by the hydrogen atoms at the long end of the molecules. This has to be compared to the short side of the fiber where the systems of the molecules are exposed. It is clear that the sticking probability at the short end will be substantially higher. Consequently the fibers will grow quickly along [10] but slower in width. An illustration of the situation is shown in figure 15.
An interesting mesoscopic approach to orient the fiber growth has been shown by Madsen et al. [148]. They used arrays of gold coated micro–ridges. Tuning the ridge width and deposition temperature, 6P fibers growing perpendicular to the ridges could be grown with a high yield.
3.3 Layer–by–layer growth of lying molecules
Although the above mentioned needle–like morphology might be useful for special applications, a smooth interface is required for most applications. This is in particular related to the fact that a lower number of defects at the interface facilitates higher charge carrier mobilities [22, 21, 19, 20]. As we have seen above films formed by upright standing molecules suffer in many cases from high step edge barriers that will ultimately lead to mound formation and rough interfaces. So far, efforts to obtain Layer–by–Layer growth have led only to limited success.
Wu et al. have achieved five layers in the desired LbL growth for the important case of 5A on SiOx by using SuMBD [149]. Using conventional OMBD, Zhang et al. showed the strain relaxation driven transition from LbL to rapid roughening after 5 layers for the plate–like molecule DIP [150]. In both studies, films formed from upright standing molecules have formed. However, some success has been obtained for flat lying molecules.
Recently, Layer–by–Layer growth of flat lying molecules has been obtained for 6P on the technological important substrate graphene [151, 152, 153]. Graphene [154, 155] can be used as a transparent, flexible and highly conductive electrode for organic electronic applications [156, 157]. The combination of optical active films of flat lying molecules on a transparent electrode materials is a promising route to high efficiency OLEDs.
The formation of the 6P film in LbL mode at 240 K has been monitored using in–situ real time Low Energy Electron Microscopy (LEEM) and micro Low Energy Electron Diffraction (LEED) for structural characterization. The growth proceeds via a multi–step process that involves the reorientation of a significant portion of already deposited molecules [151]. The process starts with the formation of a metastable layer of exclusively flat lying molecules (depicted in figure 16(a)).
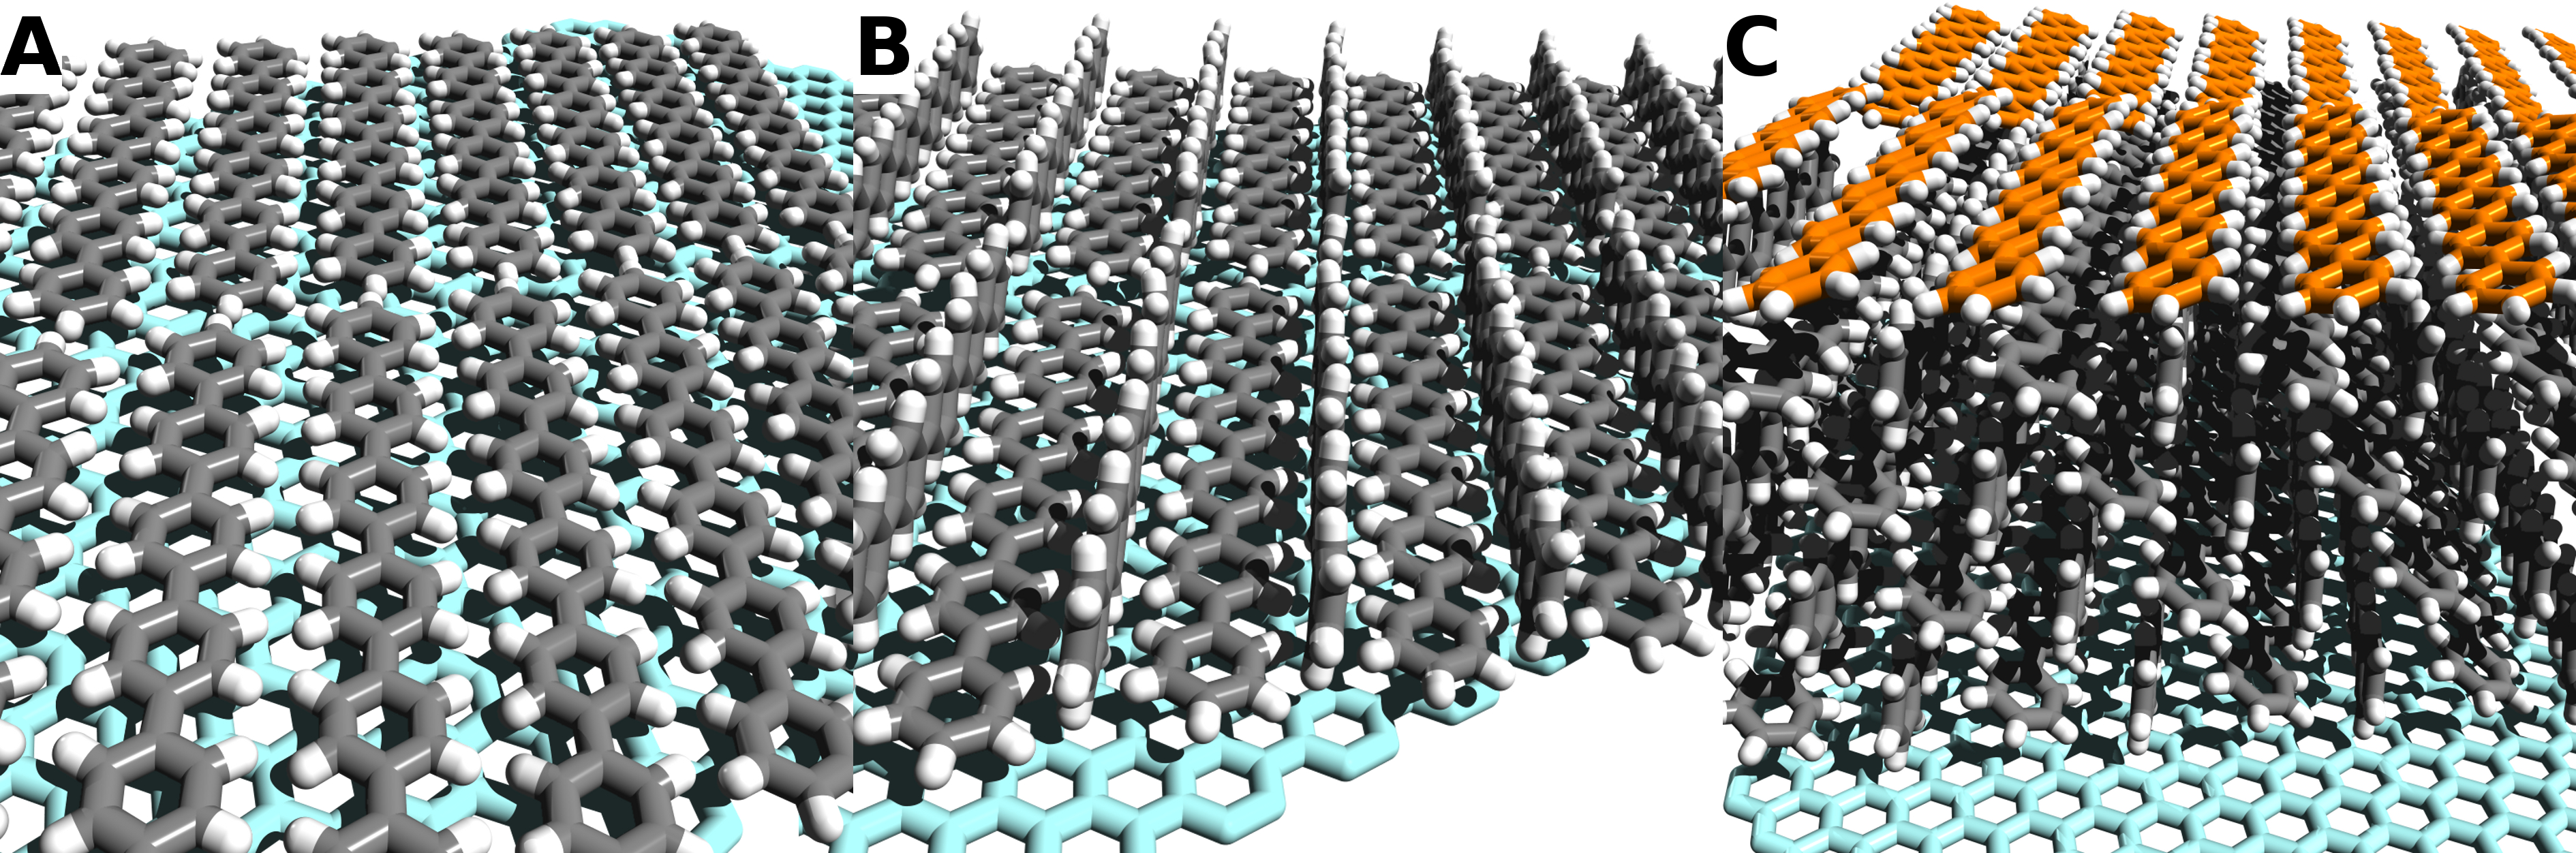
With ongoing deposition, this highly mobile initial layer [78, 153] transforms into a stable immobile layer having a higher packing density and a bulk like arrangement of the molecules (see figure 16(b)). The structure of this stable layer corresponds to the () plane of 6P. A similar growth process for the first monolayer has been reported for 6P on Au{111} [69]. However, on gold the growth at or above room temperature results in three–dimensional growth. It is important to understand the significance of the substrate for this process. Although earlier STM studies of 6P on graphite [158] also report flat lying molecules, the epitaxial relationship there is different to the one found on metal supported graphene. Using empirical force fields and total energy calculations it could be shown that indeed a different alignment of the long molecular axis is favored on the two substrates [151]. The Layer–by–Layer growth process continues with the repetition of the above two steps [151]. Every additional layer starts with the formation of the metastable initial layer of only flat lying molecules that transforms into a layer with the bulk structure once a critical coverage is reached. Figure 16(c) shows the final film structure obtained by (LEED) for 4.5 ML coverage. The achieved thin film structure bears the potential for high efficiency OLED structures on a transparent and flexible substrate [151].
4 Conclusion
In the first part, we have discussed the nucleation and growth behaviour of rodlike molecules. We presented several methods to determine the critical nucleus size. However, we also showed that due to the non–zero–dimensional nature of the molecules, care has to be taken when using formalisms originally introduced for atomic diffusion processes. Many problems—originally identified in inorganic systems—return in organic thin film growth. While phenomena like attachment limited aggregation have been observed in a few inorganic systems, they are encountered on a regular basis in organic systems. However, the biggest difference is due to the reorientation processes involved in the growth of films formed by upright standing molecules. Initial insight is gained mostly by using computational methods as the actual processes are difficult to monitor experimentally. The most difficult question to answer is related to the definition of the critical nucleus. Is an immobile cluster of flat lying molecules that finally nucleates a film formed by upright standing molecules the critical nucleus in a strict homoepitaxial sense? Although, this is to a certain level a semantic question, one has to realize that most experimental techniques to determine are insensitive to the orientation of the molecules. Consequently, this problem needs to be discussed when interpreting the results.
Furthermore, the molecular orientation plays a crucial role in defining the efficiency of organic electronic devices. We have shown several ways to influence the orientation. We pointed out that substrate order and defects plays a crucial role for switching from films formed by flat lying molecules to films made from upright standing molecules.
In the second part of this review we focused on diffusion processes that define the final film morphology. We extensively discussed mound formation in the presence of an effective Ehrlich–Schwoebel barrier and in particular the theoretical problems that arise when the critical nucleus becomes large. However, as expected a larger will not lead to a decrease of the involved step edge barriers. Two additional remarks have to be added to this discussion. First, given the size and the additional rotational degrees of freedom of molecules compared to atoms, the transition from the fluctuation determined regime to the mean field regime probably occurs at larger than in inorganic growth. Second, we briefly discussed how to extract the critical nucleus sizes for attachment limited aggregation (ALA) and diffusion limited aggregation (DLA). The latter is also observed in organic growth and leads to the formation of ramified islands. In the case of ALA, less molecules arrive at the lower step edge thus reducing the upward diffusion flux. For reasonable barrier heights this should facilitate LbL–like growth. In the case of DLA, the number of kink sites increases substantially, creating more low–barrier pathways over the step edge. While for ALA edge diffusion is in principle possible, this mechanism is not effective in DLA. Consequently, more and longer undesired domain boundaries are expected for DLA growth. The process of mound formation and its relation to Layer–by–Layer growth gets further complicated by the fact that the ESB can be layer dependent. In organic epitaxy often a change of molecular tilt angle is the root cause for this change of the barrier height and the growth mode.
Self–organization of the formed nano–structures can effectively be controlled by balancing the anisotropies present within the growth system. This includes—but is not limited to—diffusion and sticking anisotropy as well as the anisotropy of the substrate on an atomic, but also mesoscopic length scale. Also wetting layers play an important role for many organic systems. They are not necessary stable under ambient conditions. However, rearrangement processes mediated by the wetting layer—like the one observed for the crystallite chain formation—can therefore only happen during (U)HV growth. No change of morphology by such a process is possible once the wetting layer has dissolved.
In general, the anisotropy of the molecules leads to an anisotropy between the different diffusion processes. However, depending on the actual orientation of the molecules with respect to the substrate the diffusion pathways change their meaning. The path indicated by the red arrow in figure 17(a) for the step edge crossing has a low probability and results in the undesired mound formation.
However, for the case of flat lying molecules (figure 17(b)), the same diffusion process can actively be avoided. The small sticking probability at—what is now—the side of the fiber, allows the molecules to circumvent the red diffusion process by returning into the gas phase and reattachment at the small end. The consequence is the often observed fiber growth perpendicular to the long molecular axis. The same analogy holds for edge diffusion (upright standing molecules) and up hill diffusion (flat lying molecules).
Finally, we presented results of LbL growth of rodlike molecules and illustrated the often complicated rearrangement process occurring during growth of organic thin films (e.g. as for the above described low–temperature growth of 6P on graphene). Similar as above a deviation from the bulk structure goes hand in hand with a change of growth mode—in this case from three-dimensional needles to Layer-by-Layer growth of flat lying molecules. The involved metastable islands exhibit an interesting diffusion behaviour which is mediated by a delicate interplay of strains in film and substrate.
Considering the above presented information, two issues become immediately evident. Forcing the molecules to deviate from their desired bulk structure results in new and interesting growth phenomena and presents a viable route for controlling the film morphology. Secondly, the level of understanding of organic thin film epitaxy has increased dramatically within the last decade. However, there is still a large number of open questions. Having identified these questions, dedicated experiments—supported by computational methods—have to be designed to answer the existing challenges.
References
- [1] Markov I V 2003 Crystal Growth for Beginners: Fundamentals of Nucleation, Crystal Growth, and Epitaxy 2nd ed (World Scientific Publishing Company) ISBN 9812382453
- [2] Michely T and Krug J 2004 Islands, Mounds and Atoms (Springer Series in Surface Sciences vol 42) (Berlin, Heidelberg: Springer) ISBN 978-3-540-40728-7
- [3] Brune H 1998 Surf. Sci. Rep. 31 125–229 ISSN 01675729
- [4] Ratsch C and Venables J A 2003 J. Vac. Sci. Technol. A 21 S96–S109 ISSN 07342101
- [5] Venables J A, Spiller G D T and Hanbucken M 1984 Rep. Prog. Phys. 47 399–459 ISSN 0034-4885
- [6] Wagner S and Bauer S 2012 MRS Bulletin 37 207–213 ISSN 0883-7694
- [7] Campione M, Caprioli S, Moret M and Sassella A 2007 J. Phys. Chem. C 111 12741–12746 ISSN 1932-7447
- [8] Ruiz R, Nickel B, Koch N, Feldman L, Haglund R, Kahn A, Family F and Scoles G 2003 Phys. Rev. Lett. 91 1361021–1361024 ISSN 1079-7114
- [9] Stadlober B, Haas U, Maresch H and Haase A 2006 Phys. Rev. B 74 165302
- [10] Yang J, Wang T, Wang H, Zhu F, Li G and Yan D 2008 J. Phys. Chem. B 112 7816–7820
- [11] Ruiz R, Choudhary D, Nickel B, Toccoli T, Chang K C, Mayer A C, Clancy P, Blakely J M, Headrick R L, Iannotta S and Malliaras G G 2004 Chem. Mater. 16 4497–4508
- [12] Fichou D (ed) 1999 Handbook of oligo- and polythiophenes (Weinheim: Wiley-VCH) ISBN 9783527611713
- [13] Horowitz G, Fichou D, Peng X and Garnier F 1991 Synth. Met. 41 1127–1130 ISSN 03796779
- [14] Resel R 2003 Thin Solid Films 433 1–11 ISSN 00406090
- [15] Baker K N, Fratini A V, Resch T, Knachel H C, Adams W W, Socci E P and Farmer B L 1993 Polymer 34 1571–1587 ISSN 00323861
- [16] de Boer R W I, Gershenson M E, Morpurgo A F and Podzorov V 2004 phys. stat. sol. a 201 1302–1331 ISSN 0031-8965
- [17] Hu W S, Tao Y T, Chen Y F and Chang C S 2008 Appl. Phys. Lett. 93 053304
- [18] Bauer E 1958 Z. Kristallogr. 110 372–394 ISSN 0044-2968
- [19] Fritz S E, Kelley T W and Frisbie C D 2005 J. Phys. Chem. B 109 10574–10577 ISSN 1520-6106
- [20] Steudel S, De Vusser S, De Jonge S, Janssen D, Verlaak S, Genoe J and Heremans P 2004 Appl. Phys. Lett. 85 4400–4402 ISSN 00036951
- [21] Yan H, Swaraj S, Wang C, Hwang I, Greenham N C, Groves C, Ade H and McNeill C R 2010 Adv. Funct. Mater. 20 4329–4337 ISSN 1616301X
- [22] Schumacher D and Stark D 1982 Surf. Sci. 123 384–396 ISSN 00396028
- [23] Teichert C 2002 Phys. Rep. 365 335–432 ISSN 03701573
- [24] Teichert C, Ammer C and Klaua M 1994 phys. stat. sol. a 146 223–242 ISSN 00318965
- [25] Ehrlich G and Hudda F G 1966 J. Chem. Phys. 44 1039–1049
- [26] Schwoebel R L and Shipsey E J 1966 J. Appl. Phys. 37 3682–3686
- [27] Dodabalapur A, Torsi L and Katz H E 1995 Science 268 270–271 ISSN 0036-8075
- [28] Volmer M 1913 Ann. Phys. 345 775–796 ISSN 00033804
- [29] Koenigsberger J and Schilling K 1910 Ann. Phys. 337 179–230 ISSN 00033804
- [30] Pope M, Kallmann H P and Magnante P 1963 J. Chem. Phys. 38 2042–2043 ISSN 00219606
- [31] Helfrich W and Schneider W 1965 Phys. Rev. Lett. 14 229–231 ISSN 0031-9007
- [32] Chiang C, Fincher C, Park Y, Heeger A, Shirakawa H, Louis E, Gau S and MacDiarmid A 1977 Phys. Rev. Lett. 39 1098–1101 ISSN 0031-9007
- [33] Tang C W 1986 Appl. Phys. Lett. 48 183–185 ISSN 00036951
- [34] Horowitz G, Fichou D, Peng X, Xu Z and Garnier F 1989 Solid State Commun. 72 381–384 ISSN 00381098
- [35] Koezuka H, Tsumura A and Ando T 1987 Synth. Met. 18 699–704 ISSN 03796779
- [36] Burroughes J H, Jones C A and Friend R H 1988 Nature 335 137–141 ISSN 0028-0836
- [37] Burroughes J H, Bradley D D C, Brown A R, Marks R N, Mackay K, Friend R H, Burns P L and Holmes A B 1990 Nature 347 539–541 ISSN 0028-0836
- [38] Braun D and Heeger A J 1991 Appl. Phys. Lett. 58 1982–1984 ISSN 00036951
- [39] Tang C W and Van Slyke S A 1987 Appl. Phys. Lett. 51 913–915 ISSN 00036951
- [40] Tang C W, Van Slyke S A and Chen C H 1989 J. Appl. Phys. 65 3610–3616 ISSN 00218979
- [41] Reese C, Roberts M, Ling M m and Bao Z 2004 Mater. Today 7 20–27 ISSN 13697021
- [42] Samuel I D and Turnbull G A 2004 Mater. Today 7 28–35 ISSN 13697021
- [43] Sariciftci N S 2004 Mater. Today 7 36–40 ISSN 13697021
- [44] Borchardt J K 2004 Mater. Today 7 42–46 ISSN 13697021
- [45] Brütting W (ed) 2005 Physics of Organic Semiconductors 1st ed (Wiley-VCH) ISBN 352740550X
- [46] Swartzentruber B S 1996 Phys. Rev. Lett. 76 459–462 ISSN 0031-9007
- [47] Paserba K R and Gellman A J 2001 Phys. Rev. Lett. 86 4338–4341
- [48] Fichthorn K A and Miron R 2002 Phys. Rev. Lett. 89 196103 ISSN 0031-9007
- [49] Wöll C (ed) 2009 Physical and Chemical Aspects of Organic Electronics (Weinheim: Wiley-VCH) ISBN 9783527405404
- [50] Klauk H (ed) 2006 Organic Electronics: Materials, Manufacturing, and Applications (Weinheim: Wiley-VCH) ISBN 9783527312641
- [51] Kiel M, Duncker K, Hagendorf C and Widdra W 2007 Phys. Rev. B 75 195439
- [52] Yanagi H, Okamoto S and Mikami T 1997 Synth. Met. 91 91–93 ISSN 03796779
- [53] Yanagi H and Okamoto S 1997 Appl. Phys. Lett. 71 2563–2565 ISSN 00036951
- [54] Al-Shamery K H, Rubahn H G and Sitter H (eds) 2008 Organic nanostructures for next generation devices (Springer Series in Materials Science vol 101) (Berlin: Springer) ISBN 9783540719229
- [55] Guha S, Graupner W, Resel R, Chandrasekhar M, Chandrasekhar H R, Glaser R and Leising G 1999 Phys. Rev. Lett. 82 3625–3628
- [56] Bartelt M and Evans J 1992 Phys. Rev. B 46 12675–12687 ISSN 0163-1829
- [57] Bartelt M and Evans J 1996 Phys. Rev. B 54 R17359–R17362 ISSN 0163-1829
- [58] Amar J and Family F 1995 Phys. Rev. Lett. 74 2066–2069 ISSN 0031-9007
- [59] Pimpinelli A and Einstein T L 2007 Phys. Rev. Lett. 99 226102 ISSN 0031-9007
- [60] Pimpinelli A and Einstein T L 2010 Phys. Rev. Lett. 104 149602 ISSN 0031-9007
- [61] Mulheran P A and Blackman J A 1996 Phys. Rev. B 53 10261–10267
- [62] Potocar T, Lorbek S, Nabok D, Shen Q, Tumbek L, Hlawacek G, Puschnig P, Ambrosch-Draxl C, Teichert C and Winkler A 2011 Phys. Rev. B 83 075423 ISSN 1098-0121
- [63] Tejima M, Kita K, Kyuno K and Toriumi A 2004 Appl. Phys. Lett. 85 3746–3748 ISSN 0003-6951
- [64] Lorbek S, Hlawacek G and Teichert C 2011 Eur. Phys. J.-Appl. Phys. 55 23902 ISSN 1286-0042
- [65] Conrad B, Gomar-Nadal E, Cullen W, Pimpinelli A, Einstein T L and Williams E 2008 Phys. Rev. B 77 205328 ISSN 1098-0121
- [66] Miyamoto S, Moutanabbir O, Haller E and Itoh K 2009 Phys. Rev. B 79 1–6 ISSN 1098-0121
- [67] Meyer zu Heringdorf F J, Reuter M C and Tromp R M 2004 Appl. Phys. A 78 787–791
- [68] Meyer zu Heringdorf F J, Reuter M C and Tromp R M 2001 Nature 412 517–520
- [69] Müllegger S and Winkler A 2006 Surf. Sci. 600 1290–1299 ISSN 00396028
- [70] Becker K E and Fichthorn K A 2006 J. Chem. Phys. 125 184706 ISSN 0021-9606
- [71] Fichthorn K A, Becker K E and Miron R A 2007 Catal. Today 123 71–76 ISSN 09205861
- [72] Frank P, Djuric T, Koini M, Salzmann I, Rieger R, Müllen K, Resel R, Koch N and Winkler A 2010 J. Phys. Chem. C 114 6650–6657
- [73] Tait S L, Dohnálek Z, Campbell C T and Kay B D 2005 J. Chem. Phys. 122 164708 ISSN 0021-9606
- [74] Winkler A 2009 Thermal Desorption Of Organic Molecules Interface Controlled Organic Thin Films (Springer Proceedings in Physics vol 129) ed Rubahn H G, Sitter H, Horowitz G and Al-Shamery K (Springer Berlin Heidelberg) book chapter/section 5, pp 29–36 ISBN 978-3-540-95929-8
- [75] Zhdanov V 1991 Surf. Sci. Rep. 12 185–242 ISSN 01675729
- [76] Hlawacek G, Puschnig P, Frank P, Winkler A, Ambrosch-Draxl C and Teichert C 2008 Science 321 108–11 ISSN 1095-9203
- [77] Goose J E, First E L and Clancy P 2010 Phys. Rev. B 81 205310 ISSN 1098-0121
- [78] Hlawacek G, Khokar F S, van Gastel R, Teichert C and Poelsema B 2011 IBM J. Res. Dev. 55 15:1–15:7 ISSN 0018-8646
- [79] Schroeder M and Wolf D 1995 Phys. Rev. Lett. 74 2062–2065 ISSN 0031-9007
- [80] Filimonov S, Cherepanov V, Hervieu Y and Voigtländer B 2007 Phys. Rev. B 76 035428 ISSN 1098-0121
- [81] Filimonov S N and Hervieu Y Y 2012 Phys. Rev. B 85 045423 ISSN 1098-0121
- [82] Tsetseris L and Pantelides S T 2005 Appl. Phys. Lett. 87 233109
- [83] Andreev A, Montaigne A, Hlawacek G, Sitter H and Teichert C 2006 J. Vac. Sci. Technol. A 24 1660 ISSN 07342101
- [84] Fichou D and Ziegler C 2007 Structure and Properties of Oligothiophenes in the Solid State: Single Crystals and Thin Films Handbook of Oligo- and Polythiophenes ed Fichou D (Weinheim: Wiley-VCH) book chapter/section 4, pp 183–282 ISBN 9783527611713
- [85] Tumbek L and Winkler A 2012 Surf. Sci. 606 L55–L58 ISSN 00396028
- [86] Akai-Kasaya M, Ohmori C, Kawanishi T, Nashiki M, Saito A, Aono M and Kuwahara Y 2010 Nanotechnology 21 365601 ISSN 1361-6528
- [87] Andreev A, Matt G, Brabec C J, Sitter H, Badt D, Seyringer H and Sariciftci N S 2000 Adv. Mater. 12 629–633 ISSN 0935-9648
- [88] Teichert C, Hlawacek G, Andreev A, Sitter H, Frank P, Winkler A and Sariciftci N 2005 Appl. Phys. A 82 665–669 ISSN 0947-8396
- [89] Kankate L, Balzer F, Niehus H and Rubahn H G 2009 Thin Solid Films 518 130–137 ISSN 00406090
- [90] Balzer F, Kankate L, Niehus H and Rubahn H G 2005 Nanoaggregates from oligothiophenes and oligophenylenes: a systematic growth survey Proceedings of SPIE - The International Society for Optical Engineering vol 5724 ed Osinski M, Jiang S, Grote J G, Tsen K T, Hwu R J, Eldada L A, Razeghi M, Cohen M J, Sidorin Y, Kubby J A, Heyler R A, Huffaker D L, Wu M H, Coufal H J, Andrews D L, Mermelstein C, Lei C, Stockman S A, Chien L C, Jeong T H, Bjelkhagen H I, Yao H W, Choquette K D, Bour D P, Hasan Z U, Bhattacharya P K, Chen R T, Jabbour G E, Waechter C A, Dereniak E L, Brown G J, Lee E H, Linden K J, Song J J, Kaino T, Digonnet M J, Henneberger F, Amano H, Kajzar F, Jiang H, Craig A E and Schubert E F (San Jose, CA, USA: SPIE) pp 285–294 ISSN 0277786X
- [91] Rubahn H G, Sitter H, Horowitz G and Al-Shamery K (eds) 2009 Interface Controlled Organic Thin Films (Springer Proceedings in Physics vol 129) (Berlin: Springer) ISBN 978-3-540-95929-8
- [92] Frank P, Hlawacek G, Lengyel O, Satka A, Teichert C, Resel R and Winkler A 2007 Surf. Sci. 601 2152–2160 ISSN 00396028
- [93] Hlawacek G, Shen Q, Teichert C, Resel R and Smilgies D M 2007 Surf. Sci. 601 2584–2587 ISSN 00396028
- [94] Balzer F, Kintzel, Jr E J, Skofronick J G, Safron S A and Rubahn H G 2003 Analysis of nanostructured blue light-emitting p-6P films on mica Organic Light-Emitting Materials and Devices VI vol 4800 ed Khoo I C (Seattle, WA, USA) pp 216–222
- [95] Kadashchuk A, Andreev A, Sitter H, Sariciftci N S, Skryshevski Y, Piryatinski Y, Blonsky I and Meissner D 2004 Adv. Funct. Mater. 14 970–978 ISSN 1616-301X
- [96] Hlawacek G, Teichert C, Müllegger S, Resel R and Winkler A 2004 Synth. Met. 146 383–386 ISSN 03796779
- [97] Resel R, Oehzelt M, Haber T, Hlawacek G, Teichert C, Müllegger S and Winkler A 2005 J. Cryst. Growth 283 397–403
- [98] Müllegger S and Winkler A 2005 Surf. Sci. 574 322–330 ISSN 00396028
- [99] Putsche B, Tumbek L and Winkler A 2012 J. Chem. Phys. 137 134701 ISSN 1089-7690
- [100] Cranney M, Chalopin Y, Mayne A J and Dujardin G 2009 Appl. Phys. A 94 767–773 ISSN 0947-8396
- [101] Khokhar F S, Hlawacek G, van Gastel R, Zandvliet H J W, Teichert C and Poelsema B 2012 Surf. Sci. 606 475–480 ISSN 0039-6028 (Preprint 1107.0373)
- [102] Conrad B, Cullen W, Riddick B and Williams E 2009 Surf. Sci. 603 L27–L30 ISSN 00396028
- [103] Loi M A, da Como E, Dinelli F, Murgia M, Zamboni R, Biscarini F and Muccini M 2004 Nat. Mater. 4 81–85 ISSN 1476-1122
- [104] Balzer F, Beermann J, Bozhevolnyi S I, Simonsen A C and Rubahn H G 2003 Nano Lett. 3 1311–1314 ISSN 1530-6984
- [105] Nishimura S, Scales P J, Tateyama H, Tsunematsu K and Healy T W 1995 Langmuir 11 291–295 ISSN 0743-7463
- [106] Nishimura S, Biggs S, Scales P J, Healy T W, Tsunematsu K and Tateyama T 1994 Langmuir 10 4554–4559 ISSN 0743-7463
- [107] Kowarik S, Gerlach A, Sellner S, Schreiber F, Pflaum J, Cavalcanti L and Konovalov O 2006 Phys. Chem. Chem. Phys. 8 1834–1836
- [108] Dürr A C, Schreiber F, Ritley K A, Kruppa V, Krug J, Dosch H and Struth B 2003 Phys. Rev. Lett. 90 016104
- [109] Mikami T and Yanagi H 1998 Appl. Phys. Lett. 73 563 ISSN 00036951
- [110] Verlaak S, Rolin C and Heremans P 2007 J. Phys. Chem. B 111 139–150
- [111] Verlaak S, Steudel S, Heremans P, Janssen D and Deleuze M S 2003 Phys. Rev. B 68 195409
- [112] Horowitz G, Hajlaoui R, Bourguiga R and Hajlaoui M 1999 Synth. Met. 101 401–404
- [113] Tkaczyk S W, Kityk I V and Viennois R 2004 J. Chem. Phys. 121 517–524
- [114] Balzer F, Bordo V G, Simonsen A C and Rubahn H G 2003 Phys. Rev. B 67 115408 ISSN 0163-1829
- [115] Andreev A, Quochi F, Cordella F, Mura A, Bongiovanni G, Sitter H, Hlawacek G, Teichert C and Sariciftci N S 2006 J. Appl. Phys. 99 034305 ISSN 00218979
- [116] Cordella F, Quochi F, Saba M, Andreev A, Sitter H, Sariciftci N S, Mura A and Bongiovanni G 2007 Adv. Mater. 19 2252–2256 ISSN 09359648
- [117] Hill I G, Weinert C M, Kreplak L and Zyl B P 2008 Appl. Phys. A 95 81–87 ISSN 0947-8396
- [118] Wu Y, Toccoli T, Koch N, Iacob E, Pallaoro A, Rudolf P and Iannotta S 2007 Phys. Rev. Lett. 98 076601
- [119] Zhang X, Barrena E, Goswami D, de Oteyza D G, Weis C and Dosch H 2009 Phys. Rev. Lett. 103 136101 ISSN 0031-9007
- [120] Zhu Y, Sun Z, Yan Z, Jin Z and Tour J M 2011 ACS nano 5 6472–9 ISSN 1936-086X
- [121] Seah M P 1972 Surf. Sci. 32 703–728 ISSN 00396028
- [122] Meinel K, Klaua M and Bethge H 1988 J. Cryst. Growth 89 447–458 ISSN 00220248
- [123] Elkinani I and Villain J 1994 J. Phys. I 4 947–973 ISSN 1155-4304
- [124] Elkinani I and Villain J 1993 Solid State Commun. 87 105–108 ISSN 00381098
- [125] Krug J, Politi P and Michely T 2000 Phys. Rev. B 61 14037–14046 ISSN 0163-1829
- [126] Krug J 2000 Eur. Phys. J. B 18 713–719 ISSN 1434-6028
- [127] Rottler J and Maass P 1999 Phys. Rev. Lett. 83 3490–3493
- [128] Heinrichs S, Rottler J and Maass P 2000 Phys. Rev. B 62 8338–8359 ISSN 0163-1829
- [129] Zorba S, Shapir Y and Gao Y 2006 Phys. Rev. B 74 245410 ISSN 1098-0121
- [130] Politi P 1997 J. Phys. I 7 797–806
- [131] Kalff M, Šmilauer P, Comsa G and Michely T 1999 Surf. Sci. 426 L447–L453 ISSN 00396028
- [132] Fendrich M and Krug J 2007 Phys. Rev. B 76 121302 ISSN 1098-0121
- [133] Tersoff J, Denier van der Gon A and Tromp R M 1994 Phys. Rev. Lett. 72 266–269 ISSN 0031-9007
- [134] Kandel D 1997 Phys. Rev. Lett. 78 499–502 ISSN 0031-9007
- [135] Teichert C, Hlawacek G, Winkler A, Puschnig P and Ambrosch-Draxl C 2013 Ehrlich-Schwoebel barriers and island nucleation in organic thin film growth Small Organic Molecules on Surfaces Springer Series in Materials Science ed Sitter H, Ambrosch-Draxl C and Ramsey M G (Berlin: Springer) chap 4 ISBN 978-3-642-33847-2
- [136] Quochi F, Andreev A, Cordella F, Orrù R, Mura A, Bongiovanni G, Hoppe H, Sitter H and Sariciftci N S 2005 J. Lumin. 112 321–324
- [137] Balzer F and Rubahn H G 2005 Adv. Funct. Mater. 15 17–24 ISSN 1616-301X
- [138] Simbrunner C, Nabok D, Hernandez-Sosa G, Oehzelt M, Djuric T, Resel R, Romaner L, Puschnig P, Ambrosch-Draxl C, Salzmann I, Schwabegger G, Watzinger I and Sitter H 2011 J. Am. Chem. Soc. 133 3056–3062
- [139] Andreev A, Teichert C, Hlawacek G, Hoppe H, Resel R, Smilgies D M, Sitter H and Sariciftci N S 2004 Org. Electron. 5 23–27 ISSN 15661199
- [140] Tumbek L, Gleichweit C, Zojer K and Winkler A 2012 Phys. Rev. B 86 085402 ISSN 1098-0121
- [141] Diebold U 2003 Surf. Sci. Rep. 48 53–229
- [142] Hlawacek G, Teichert C, Andreev A, Sitter H, Berkebile S, Koller G, Ramsey M G and Resel R 2005 phys. stat. sol. a 202 2376–2385 ISSN 0031-8965
- [143] Koller G, Berkebile S, Krenn J R, Tzvetkov G, Hlawacek G, Lengyel O, Netzer F P, Teichert C, Resel R and Ramsey M G 2004 Adv. Mater. 16 2159–2162 ISSN 0935-9648
- [144] Resel R, Oehzelt M, Lengyel O, Haber T, Schülli T, Thierry A, Hlawacek G, Teichert C, Berkebile S, Koller G and Ramsey M G 2006 Surf. Sci. 600 4645–4649 ISSN 00396028
- [145] Berkebile S, Koller G, Hlawacek G, Teichert C, Netzer F P and Ramsey M G 2006 Surf. Sci. 600 L313–L317 ISSN 00396028
- [146] Sun L, Berkebile S, Weidlinger G, Koller G, Hohage M, Netzer F P, Ramsey M G and Zeppenfeld P 2010 Phys. Chem. Chem. Phys. 12 3141–4 ISSN 1463-9084
- [147] Söhnchen S, Lukas S and Witte G 2004 J. Chem. Phys. 121 525–34 ISSN 0021-9606
- [148] Madsen M, Kjelstrup-Hansen J and Rubahn H G 2009 Nanotechnology 20 115601 ISSN 1361-6528
- [149] Wu Y, Toccoli T, Zhang J, Koch N, Iacob E, Pallaoro A, Iannotta S and Rudolf P 2009 Appl. Phys. A 95 21–27 ISSN 0947-8396
- [150] Zhang X, Barrena E, de Oteyza D G and Dosch H 2007 Surf. Sci. 601 2420–2425 ISSN 00396028
- [151] Hlawacek G, Khokhar F S, van Gastel R, Poelsema B and Teichert C 2011 Nano Lett. 11 333–7 ISSN 1530-6992
- [152] Lu W, Soukiassian P and Boeckl J 2012 MRS Bulletin 37 1119–1124 ISSN 0883-7694
- [153] Hlawacek G, Khokhar F S, van Gastel R, Zandvliet H J W, Poelsema B and Teichert C 2013 In situ observation of organic thin film growth on graphene Small Organic Molecules on Surfaces Springer Series in Materials Science ed Sitter H, Ambrosch-Draxl C and Ramsey M G (Berlin: Springer) chap 5 ISBN 978-3-642-33847-2
- [154] Geim A K and Novoselov K S 2007 Nat. Mater. 6 183–191 ISSN 1476-1122
- [155] Echtermeyer T J, Lemme M C, Baus M, Szafranek B N, Geim A K and Kurz H 2008 IEEE Electr. Device L. 29 952–954
- [156] Wang Q H and Hersam M C 2009 Nat. Chem. 1 206–211
- [157] Lauffer P, Emtsev K V, Graupner R, Seyller T and Ley L 2008 phys. stat. sol. b 245 2064–2067
- [158] Wang Z H, Kanai K, Iketaki K, Ouchi Y and Seki K 2008 Thin Solid Films 516 2711–2715