![[Uncaptioned image]](/html/1301.4244/assets/x1.png)
The AGN dusty torus as a clumpy two-phase medium: radiative transfer
modeling with SKIRT
Marko Stalevski1,2,
Jacopo Fritz2,
Maarten Baes2,
and
Luka Č. Popović1,3
1
Astronomical Observatory, Volgina 7, 11060 Belgrade, Serbia
2 Sterrenkundig Observatorium, Universiteit Gent, Krijgslaan 281-S9, Gent, 9000, Belgium
3 Department of Astronomy, Faculty of Mathematics, University of Belgrade
Abstract
We modeled the AGN dusty torus as a clumpy two-phase medium, with high-density clumps embedded in a low-density interclump dust. To obtain spectral energy distributions and images of the torus at different wavelengths, we employed the 3D Monte Carlo radiative transfer code skirt. Apart from the grid of two-phase models, we calculated the corresponding sets of clumps-only models and models with a smooth dust distribution for comparison. We found that the most striking feature of the two-phase model is that it might offer a natural solution to the common issue reported in a number of papers — the observed excess of the near-infrared emission.
1 Introduction
The unification model of active galactic nuclei (AGN) requires a roughly toroidal structure of dust and gas that surrounds the central regions. In order to prevent the dust grains from being destroyed by the hot surrounding gas, it has been suggested that the dust in the torus is organized in a large number of optically thick clumps [11]. However, due to the difficulties in handling clumpy media and lack of computational power, early works adopted a smooth dust distribution, e.g. [17, 7, 6]. Later on, several authors undertook different efforts for the treatment of clumpy media, e.g. [9, 15, 22] (for an overview of different AGN torus models see contribution by Sebastian Hönig in this proceedings, [8]). A problem which the obscuring torus hypothesis faced from the beginning was formation of the dynamically stable structure and maintenance of the required scale-height. According to one scenario, the scale-height is maintained through regular elastic collisions between the clumps [11]. In the case of a smooth dust distribution, radiation pressure within the torus may be enough to support the structure [17, 10]. Hydrodynamical simulations, taking into account processes as self-gravity of the gas, radiative cooling and heating due to supernovae, found that such a turbulent interstellar medium in AGN would result in a multiphase filamentary (sponge-like) structure, rather then isolated clumps [26, 25]. Although the current observational facilities can resolve the structure of only a few nearby AGN tori, there are indications that it indeed consists of thick clumps embedded in a diffuse interclump medium [1]. Also, such two-phase structures have been actually observed in the central regions of Milky Way (the so-called Central Molecular Zone and Circumnuclear Disk) and it has been suggested that they represent a remnant of a dusty torus that may have played a role in past AGN phases of our Galaxy [13, 19]. Our aim was to take a step further toward a more realistic model by treating the dusty torus as a two-phase medium, with high density clumps and low density medium filling the space between them. To calculate spectral energy distributions (SEDs) and images of the torus, we used the 3D Monte Carlo radiative transfer code skirt [2, 3]. The approach we adopted for building our model enables us to, for each two-phase model, calculate a corresponding clumps-only model (with dust distributed to the clumps exclusively, without any dust between them) and a smooth model, with the same global physical parameters, allowing a consistent comparison between them [23].
2 Model
2.1 Dust distribution and properties
For the detailed description of the model and its parameters, we refer the reader to [23]; here we will present only the most important properties and general approach. The primary continuum source of dust heating is the intense UV-optical continuum coming from the accretion disk. A very good approximation of its emission is a central, point-like energy source, whose SED is very well approximated by a composition of power laws [23]. We approximate the spatial dust distribution around the primary continuum source with a conical torus (i.e. a flared disk), whose characteristics are defined by the half opening angle and the inner and outer radii. For the inner radius we adopted the value of pc, at wich the dust grains are heated to the temperature of K, according to the prescription given by [4]. We describe the spatial distribution of the dust density with a law that allows a density gradient along the radial direction and with polar angle. The dust mixture consists of separate populations of graphite and silicate dust grains with a classical MRN size distribution [12].
The dust is distributed on a 3D cartesian grid composed of a large number of cubic cells. The standard resolution for our simulations is 200 cells along each axis ( cells in total). To ensure that the adopted resolution is sufficient to properly sample the dust, for each simulation we compare the actual and expected values of (a) the face-on and edge-on central surface density and (b) the total dust mass. The emission for all models was calculated on an equally spaced logarithmic wavelength grid ranging from to m. A finer wavelength sampling was adopted between and m, in order to better resolve the shape of and m silicate features. Each simulation is calculated using photon packages.
2.2 Two-phase medium: the approach
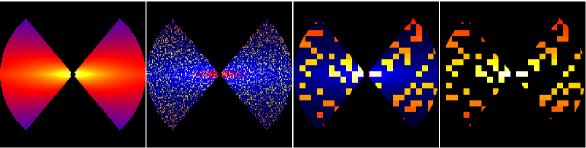
In the approach we adopted to build a two-phase model, the dust is first distributed smoothly within the toroidal region, according to the adopted density law. The total amount of dust is fixed based on the equatorial optical depth at m. Then, to generate a two-phase clumpy medium, we apply the algorithm described by [27]. According to this algorithm, each individual cell in the grid is assigned randomly to either a high- or low-density state by a Monte Carlo process. The medium created in such a way is statistically homogeneous, but clumpy. The filling factor determines the statistical frequency of the cells in the high-density state and can take values between and . For example, a filling factor of represents a case of rare, single high-density clumps in an extended low-density medium. The process for the clump generation is random with respect to the spatial coordinates of the individual clumps themselves. Thus, as the filling factor is allowed to increase, the likelihood that adjoining cells are occupied by clumps increases as well. This leads to the appearance of complex structures formed by several merged clumps. For filling factor values , clumps start to form an interconnected sponge-like structure, with low-density medium filling the voids. We form larger clumps by forcing several adjoining cells into a high-density state. To tune the density of the clumps and the inter-clump medium, we use the ‘contrast parameter’, defined as the ratio of the dust density in the high- and low-density phase. This parameter can be assigned any positive value. For example, setting the contrast to one would result in a smooth model. Setting extremely high value of contrast () effectively puts all the dust into the clumps, without low-density medium between them. An example of dust density distributions in the meridional plane for smooth, two-phase and clumps-only models is given in Fig. 1.
3 Results and Discussion
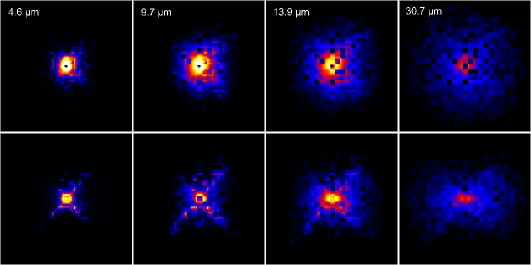
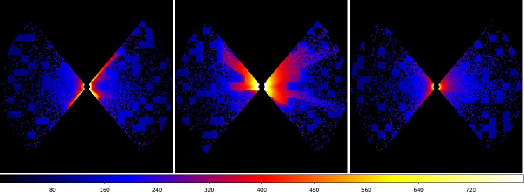
An example of images of the torus for typical parameters at different wavelengths is shown in Fig. 2. Movies, in which each frame represents an image of the torus at different wavelength between and m, are available at following hyper-links: face-on and edge-on view (note that the images presented in these movies were calculated with updated model where clumps are in the form of spheres). It is apparent that the size of the torus is wavelength dependent: at shorter wavelengths, it is the radiation from the inner (and hotter) region that dominates, while at longer wavelengths, the emission arises from the dust placed further away. A detailed analysis of the properties of the dusty torus infrared emission can be found in [23]. In the remainder of this contribution, we will bring to focus only several of the most interesting results. A grid of calculated SEDs is publicly available at https://sites.google.com/site/skirtorus/.
3.1 Two-phase medium: a natural solution to the near-IR excess?
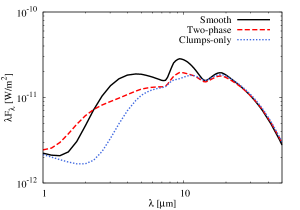
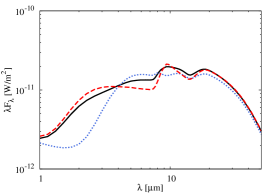
In Fig. 3, SEDs of smooth, two-phase and clumps-only models are compared. The major difference between SEDs of two-phase and clumps-only models arises in the near-IR range and mainly for the face-on view. At these wavelengths, the most of the two-phase models with the type 1 inclination have a flatter SED when compared to the corresponding clumps-only models. This difference is caused by the presence of the smooth component in which the clumps are embedded. Dust in this component can reach high temperatures and will give rise to the higher luminosity in the m range. Regarding the m silicate feature, we do not find any significant difference between the two dust configurations: depending on parameters, in clumps-only models it could be slightly attenuated compared to the one in the two-phase models, but the difference is in most cases marginal. A similar behavior can be observed in the SEDs corresponding to edge-on views, in which the smooth low-density component is responsible for an additional absorption, so the silicate feature is slightly deeper in the two-phase models.
It is very interesting to note that such a behavior of the near- and mid-IR emission of the two-phase dust distribution, may in some cases overcome an issue that seems to be common to the clumpy models currently available in the literature. A number of papers studying properties of infrared emission of different samples of AGNs reported the need of an extra hot-dust component to reproduce observed SEDs [18, 14, 5, 24]. In these cases, adopted clumpy models were not able to simultaneously reproduce the intensity of the silicate feature and the near-IR continuum emission: models that would properly fit the near-IR were overestimating the silicate feature emission. It has been suggested that graphite at the sublimation limit could be responsible for the extra near-IR emission. Although this graphite is a plausible source of an additional near-IR emission, it has yet to be confirmed by modeling. Rather than simply adding a black-body component to the fitting procedure, the dust component responsible for the observed near-IR excess must be consistently included and present in the model during the radiative transfer simulation itself.
On the other hand, as we have shown, a torus model with the dust distributed in a two-phase medium, has a more pronounced (‘hotter’) emission in the m range while displaying, at the same time, a silicate feature whose intensity is almost identical to that of the corresponding clumps-only model. Thus, it seems that the two-phase models may offer a natural solution to the observed excess of near-IR emission. This is supported by a recent study by [20]. The authors considered the optical to mid-IR properties of a sample of quasars and estimated a number of properties, including the IR SED shape characterized by the ratio of near-IR ( m ) to total IR luminosity. The typical ratio of the near-IR to the total IR luminosity in their sample is %. They found that this ratio is achievable in the CLUMPY models [15] only in a limited range of parameter values. On the other hand, in the set of two-phase models, they found that near-IR to total IR luminosity ratios similar to that in the observed sample are easily achievable.
3.2 Anisotropic accretion disk emission
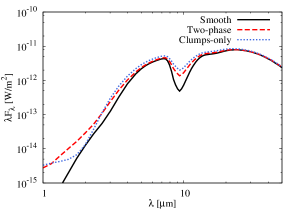
An isotropic source emission is commonly adopted in the radiative transfer modeling of the dusty tori. However, owing to the change in the projected surface area and limb darkening, the accretion disk emission is actually anisotropic [16]. We took this into account as a dependence of the accretion disk radiation on the direction and with the corresponding change of the dust sublimation radius [23]. In Fig. 4 we present the resulting model SEDs if the anisotropic radiation of the primary source is assumed (dotted line) and compare them to the corresponding SEDs obtained in the case of the isotropic source (solid line) for different inclinations.
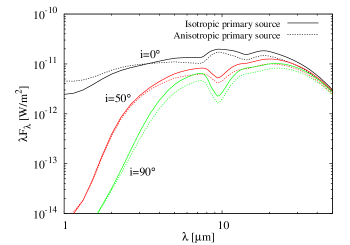
We found that, when anisotropy of the central source is assumed, the infrared SED can indeed change, resulting in a lower emission, though roughly keeping the same shape. This is a logical consequence coming from the fact that, for a given bolometric luminosity of the accretion disk, an anisotropic source is emitting more power in the dust-free region: the overall result is a less luminous torus. We found that the shape and the features of the SED (e.g. the m feature) are only marginally affected. It is interesting to note the additional emission shortward of m, seen in the dust-free lines of sight. However, in the current simulations, we were limited by the memory requirements; a better resolution in the inner regions is needed to study the effects of anisotropic source and possible relevance for the issue of the near-IR excess. The adaptive octree grid that is implemented in the skirt code [21] will allow us to do this.
3.3 Degeneracy due to the random distribution of clumps
The shape and overall near- and mid-IR emission strongly depend on the distribution of dust in the innermost region. Changing the random arrangement of clumps, along with choosing a particular line of sight, can affect the resulting SED significantly, as illustrated in Fig. 5. This characteristic imports a degree of the degeneracy in the features of SEDs, which will depend less directly on the physical input parameters. Even though the spatial position of the clumps is not related to the physical properties of the dusty tori, their re-arrangement has a clear impact on the infrared emission. It is, in some way, mimicking a change in the optical depth, which might appear either to increase or decrease, depending on the clumps re-arrangement, especially in the innermost regions. For example, in models with a higher concentration of clumps in the innermost region, due to the shadowing effect, the absorption is increased and the silicate feature is suppressed. However, we stress that the SEDs shown in Fig. 5 present the extreme examples; many other random distributions of clumps would not result in such a drastic differences. Also, due to the tidal shearing, clumps at the inner rim should be smaller than clumps further away. This could potentially reduce the differences seen in SEDs, as they are most affected by the dust properties in the innermost region. Further simulations with higher resolution will enable us to estimate the degree and importance of degeneracy introduced by random arrangements of clumps.
Acknowledgments
This work was supported by the Ministry of Education, Science and Technological Development of the Republic of Serbia through the projects ‘Astrophysical Spectroscopy of Extragalactic Objects’ (176001) and ‘Gravitation and the Large Scale Structure of the Universe’ (176003).
References
- [1] Assef, R. J., Stern, D., Kochanek, C. S., et al. 2012, ApJ, submitted, arXiv:1209.6055
- [2] Baes M., Davies J. I., Dejonghe H., Sabatini S., Roberts S., Evans R., Linder S. M., Smith R. M., de Blok W. J. G., 2003, MNRAS, 343, 1081
- [3] Baes M., Verstappen J., De Looze I., Fritz J., Saftly W., Vidal Pérez E., Stalevski M., Valcke S., 2011, ApJS, 196, 22
- [4] Barvainis R., 1987, ApJ, 320, 537
- [5] Deo, R. P., Richards, G. T., Nikutta, R., Elitzur, M., Gallagher, S. C., Ivezić, Ž., & Hines, D. 2011, ApJ, 729, 108
- [6] Fritz J., Franceschini A., Hatziminaoglou E., 2006, MNRAS, 366, 767
- [7] Granato G. L., Danese L., 1994, MNRAS, 268, 235
- [8] Hoenig, S. F. 2013, arXiv:1301.1349
- [9] Hönig S. F., Beckert T., Ohnaka K., Weigelt G., 2006, A&A, 452, 459
- [10] Krolik J. H., 2007, ApJ, 661, 52
- [11] Krolik J. H., Begelman M. C., 1988, ApJ, 329, 702
- [12] Mathis J. S., Rumpl W., Nordsieck K. H., 1977, ApJ, 217, 425
- [13] Molinari, S., Bally, J., Noriega-Crespo, A., et al. 2011, ApJL, 735, L33
- [14] Mor, R., Netzer, H.,& Elitzur, M. 2009, ApJ, 705, 298
- [15] Nenkova M., Sirocky M. M., Ivezić Ž., Elitzur M., 2008a, ApJ, 685, 147
- [16] Netzer, H. 1987, MNRAS, 225, 55
- [17] Pier E. A., Krolik J. H., 1992, ApJ, 401, 99
- [18] Polletta, M., Weedman, D., Hönig, S., Lonsdale, C. J., Smith, H. E., & Houck, J. 2008, ApJ, 675, 960
- [19] Ponti, G., Morris, M. R., Terrier, R., & Goldwurm, A. 2012, arXiv:1210.3034
- [20] Roseboom, I. G., Lawrence, A., Elvis, M., et al. 2012, MNRAS, 406
- [21] Saftly, W., Camps, P., Baes, M., Gordon, K. D., Vandewoude, S., Rahimi, A., Stalevski, M., 2013, A&A, submitted
- [22] Schartmann M., Meisenheimer K., Camenzind M., Wolf S., Tristram K. R. W., Henning T., 2008, A&A, 482, 67
- [23] Stalevski, M., Fritz, J., Baes, M., Nakos, T., & Popović, L. Č. 2012, MNRAS, 420, 2756
- [24] Vignali, C., Piconcelli, E., Lanzuisi, G., et al. 2011, MNRAS, 416, 2068
- [25] Wada, K. 2012, ApJ, 758, 66
- [26] Wada K., Papadopoulos P. P., Spaans M., 2009, ApJ, 702, 63
- [27] Witt A. N., Gordon K. D., 1996, ApJ, 463, 681