HST/COS Spectra of Three QSOs that Probe the Circumgalactic Medium of a Single Spiral Galaxy: Evidence for Gas Recycling and Outflow**affiliation: Based on observations with the NASA/ESA Hubble Space Telescope, obtained at the Space Telescope Science Institute, which is operated by the Associated Universities for Research in Astronomy, Inc., under NASA contract NAS 5-26555.
Abstract
We have used the Cosmic Origins Spectrograph (COS) to obtain far-UV spectra of three closely-spaced QSO sight lines that probe the circumgalactic medium (CGM) of an edge-on spiral galaxy, ESO 157–49, at impact parameters of 74 and 93 kpc near its major axis and 172 kpc along its minor axis. H I absorption is detected at the galaxy redshift in the spectra of all three QSOs, and metal lines of Si III, Si IV, and C IV are detected along the two major-axis sight lines. Photoionization models of these clouds suggest metallicities close to the galaxy metallicity, cloud sizes of kpc, and gas masses of . Given the high covering factor of these clouds, ESO 157–49 could harbor of warm CGM gas. We detect no metals in the sight line that probes the galaxy along its minor axis, but gas at the galaxy metallicity would not have detectable metal absorption with ionization conditions similar to the major-axis clouds. The kinematics of the major-axis clouds favor these being portions of a “galactic fountain” of recycled gas, while two of the three minor-axis clouds are constrained geometrically to be outflowing gas.
In addition, one of our QSO sight lines probes a second more distant spiral, ESO 157–50, along its major axis at an impact parameter of 88 kpc. Strong H I and C IV absorption only are detected in the QSO spectrum at the redshift of ESO 157–50.
Subject headings:
galaxies: halos — intergalactic medium — quasars: absorption lines — galaxies: individual (ESO 157–49, ESO 157–50) — quasars: individual (RX J0439.6–5311, HE 0439–5254, HE 0435–5304)1. Introduction
Prior to the UV spectrographs of the Hubble Space Telescope (HST), the study of the gaseous halos of external galaxies was limited. Initially, only a very small number of H I 21-cm and low-ion (Na I and Ca II) absorbing clouds associated with galaxy halos had been discovered (e.g., Haschick & Burke, 1975; Boksenberg & Sargent, 1978; Stocke et al., 1991; Carilli & van Gorkom, 1992). In the 1990s ground-based spectroscopy of bright QSOs began to discover distant galaxies selected by detecting strong, redshifted Mg II absorption in their halos (Bergeron & Boissé, 1991; Steidel & Sargent, 1992). The near-UV rest-frame wavelength of the strong, low-ion Mg II doublet (2795.5, 2802.7 Å) allowed the detection of halo clouds sufficiently nearby to permit the discovery and study of their associated galaxies. Beyond these pioneering Mg II studies, statistical studies of the absorption-line frequency of C IV and absorbers in high- QSO spectra suggested that, if these absorbers were related to individual galaxies, their gaseous halos must be extremely large ( kpc and 250 kpc respectively; Steidel, 1993; Chen, Lanzetta & Webb, 2001a, b) at high covering factor.
When HST opened the study of the forest at low redshift (Bahcall et al., 1991, 1993; Morris et al., 1991; Jannuzi et al., 1998; Impey, Petry, & Flint, 1999; Penton, Shull, & Stocke, 2000, 2000, 2002, 2004; Lehner et al., 2007; Danforth & Shull, 2008; Tripp et al., 2008), the very low- absorption discovered allowed more in-depth studies of the relationship between absorbers and galaxies (Morris et al., 1993; Lanzetta et al., 1995; Chen et al., 1998, 2001b; Chen & Mulchaey, 2009; Tripp, Lu, & Savage, 1998; Bowen, Tripp, & Jenkins, 2001; Penton, Stocke, & Shull, 2002; Stocke et al., 2006; Wakker & Savage, 2009; Prochaska et al., 2011). While many close absorber/galaxy pairs were found by these studies, it also became apparent that the majority of low- absorbers could not be ascribed easily to individual foreground galaxies, but rather to intergalactic gas in large-scale filamentary structures (Rosenberg et al., 2003), and some absorbers were even found in galaxy voids (Stocke et al., 1995, 2007). Despite the limited sensitivity of the early generations of HST UV spectrographs, some important studies of individual galaxy halos were conducted (Bowen & Blades, 1993; Bowen, Pettini, & Blades, 2002; Chen et al., 1998, 2001b; Chen & Mulchaey, 2009; Ding et al., 2003, 2005; Stocke et al., 2004, 2010; Keeney et al., 2005, 2006b; Kacprzak et al., 2007, 2008, 2010; Prochaska et al., 2011).
Historically, the paucity of UV-bright QSOs that could be observed at high spectral resolution and high signal-to-noise with HST in reasonable exposure times severely constrained the number of galaxy halos that could be studied. This situation changed in May 2009 when the Cosmic Origins Spectrograph (COS) was installed aboard HST because COS has 10–20 times the throughput of HST’s previous UV spectrographs at comparable resolution (Osterman et al., 2011; Green et al., 2012). The dramatic increase in the number of QSOs that can feasibly be observed by HST with COS has enabled several new, important studies of galaxy halos. COS era results include the discovery of very broad and shallow O VI without associated H I absorption (Savage et al., 2010) that is probably tracing gas with –6.2 associated with a pair of late-type galaxies, the discovery of K gas in a nearby galaxy filament (Narayanan et al., 2010), and the detection of a multi-phase absorber containing O VI and very broad H I absorption tracing K gas toward HE 0153–4520 (Savage et al., 2011). COS is also providing good evidence in individual cases for both infalling and outflowing gas in galaxy halos: Thom et al. (2011) and Ribaudo et al. (2011) found evidence for low-metallicity gas accreting onto luminous galaxies at , and Tripp et al. (2011) discovered a post-starburst galaxy whose wind extends to 68 kpc and has 10–150 times more mass in “warm-hot” gas at K than in cooler gas. Finally and importantly, in the first-published systematic survey of halos of galaxies made with COS, Tumlinson et al. (2011) found that star-forming galaxies have large (150 kpc), high covering factor halos of O VI-absorbing gas, while passive galaxies do not.
UV spectroscopy of QSOs also allows us to study the gaseous halo of the Milky Way via discovery and detailed modeling of high velocity clouds (HVCs; Savage & Sembach, 1991; Shull & Slavin, 1994; Shull et al., 2009, 2011; Collins, Shull, & Giroux, 2003, 2004, 2005, 2007, 2009; Tripp et al., 2003; Indebetouw & Shull, 2004; Fox et al., 2004, 2005, 2010, 2006; Keeney et al., 2006a; Lehner & Howk, 2010, 2011). UV spectra of QSOs show HVC absorption from neutral and low ions (e.g., H I, O I, C II, Si II, S II) as well as higher ions (e.g., C III, C IV, N V, O VI, Si III, Si IV) that may be photo- or collisionally-ionized. The unprecedented throughput of COS has enabled the discovery of highly ionized HVC absorption in distant high latitude Galactic stars (Lehner & Howk, 2010, 2011), demonstrating that diffuse highly ionized HVCs can be located at Galactic distances similar to their denser, low-ionization counterparts first discovered in H I 21-cm emission (Wakker, 2001; Wakker et al., 2007, 2008; Putman et al., 2003; Thom et al., 2008). Highly ionized HVCs have also been shown to constitute a large reservoir () of low-metallicity (–) gas with high covering factor (80% in Si III) that rains onto the Galactic disk at a rate of to fuel new star formation (Shull et al., 2009). Recently, Richter (2012) used the distribution of H I 21-cm detected HVCs around the Milky Way and M 31 to model their three dimensional distribution as an exponentially decaying function of galactocentric radius. He finds a mass and accretion rate for low-ionization HVCs comparable to that found for highly ionized HVCs. Thus, HST UV spectroscopy is providing new details of the Milky Way’s halo which then can be extrapolated to other spiral galaxies via the “Copernican Principle”.
In the recent literature (e.g., Yao et al., 2010; Prochaska et al., 2011; Tumlinson et al., 2011), the outskirts of galaxy halos, which are fed both by galaxy outflows and accretion from the surrounding intergalactic medium (IGM), are often referred to as the “circumgalactic medium” (CGM). Theoretical models suggest that the CGM extends to approximately the virial radius () and is enriched with metals by supernova-driven galactic winds (Stinson et al., 2012; van de Voort & Schaye, 2012), which may or may not escape the galaxy’s gravitational potential (escaping winds are more likely for low mass galaxies; Côté et al., 2012). Observational studies of the CGM like those summarized above are limited to single “pencil beam” probes for galaxies outside of the Local Group and so require a statistical sample of QSO/galaxy pairs before firm conclusions can be drawn as to the distribution and kinematics of CGM gas as a function of radius and position angle with respect to the galaxy. The HST/COS O VI absorber study of Tumlinson et al. (2011) is the first attempt, in which an overall picture of the CGM is constructed using single QSO sight line probes of a large number of luminous galaxies at –0.3. The Guaranteed Time Observers (GTOs) of the COS Science Team are conducting a similar, largely single-probe survey, concentrating on very low-redshift () spiral and irregular galaxies at a variety of luminosities (Stocke et al., 2013). The sample presented in this paper is a special member of this larger COS GTO study.
An alternative approach to the single-probe method of Tumlinson et al. (2011) and Stocke et al. (2013) is one by which a galaxy’s CGM is probed by multiple QSO sight lines at several impact parameters and at a variety of position angles relative to the galactic disk. However, even with the greatly enhanced UV sensitivity of HST/COS, locating examples for such studies has proven difficult; ultimately, the COS GTOs were able to locate only a single, good example of a galaxy probed by multiple QSOs bright enough to observe with COS in only a few orbits. This paper presents far-UV spectra obtained with HST/COS of three QSOs that probe the galaxy ESO 157–49 at impact parameters kpc.
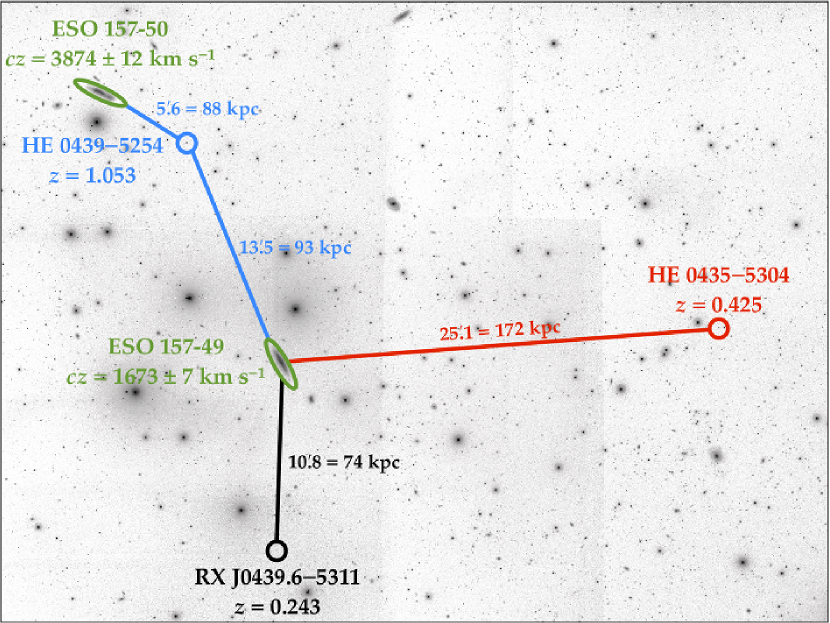
Figure 1 shows the region around ESO 157–49 and labels its position and redshift along with those of the QSOs that probe its CGM: RX J0439.6–5311, HE 0439–5254, and HE 0435–5304. The position and redshift of the galaxy ESO 157–50, whose CGM is serendipitously probed by HE 0439–5254, are also shown. In Section 2 we present our HST/COS spectra of RX J0439.6–5311, HE 0439–5254, and HE 0435–5304 and discuss the absorption line systems detected in these spectra at the redshifts of ESO 157–49 and ESO 157–50. We present optical images and spectra and H I 21-cm images of ESO 157–49 and ESO 157–50 in Section 3. In Section 4 we use CLOUDY photoionization models to constrain the physical properties of the absorption line systems at the redshifts of ESO 157–49 and ESO 157–50. Finally, Section 5 discusses and summarizes our results and most important conclusions.
2. QSO Spectra
The three QSO probes of ESO 157–49 were observed with HST/COS as part of the COS guaranteed observing time (GTO) program (PID 11520, PI: J. Green). Each QSO was observed with four different wavelength settings in both of the medium resolution far-UV (FUV) gratings to dither known instrumental features in wavelength space and provide continuous spectral coverage from 1135–1795 Å with a resolving power of . Each QSO was also observed at Mg II in the near-UV (NUV) with the G285M grating at a central wavelength of 2695 Å, covering the wavelength ranges from 2547–2602 Å, 2666–2719 Å, and 2786–2836 Å with a resolving power of . Details of the COS instrument design and on-orbit performance are given in Green et al. (2012) and Osterman et al. (2011).
All exposures were reduced with CalCOS v2.17.3A after being downloaded from the archive. Alignment and coaddition of the processed FUV exposures were carried out using IDL routines developed by the COS GTO team specifically for COS FUV data000IDL routines for coadding COS data are available at http://casa.colorado.edu/$∼$danforth/science/cos/costools.html. and described in Danforth et al. (2010). We used the most recent version of our coaddition code, which minimizes the contribution of non-Poissonian noise in the coadded data, as described in Keeney et al. (2012).
Briefly, our code works as follows. Flux values near the edge of the detector or the positions of the ion-repellor grid wires are less trustworthy than at other wavelengths. Since our coaddition scheme utilizes exposure-time weighting, these suspect regions (fixed in pixel but not wavelength space) are de-weighted on an exposure-by-exposure basis by reducing their local exposure time by a factor of two. With four central wavelength settings per grating, any residual instrumental artifacts from grid-wire shadows and detector boundaries have negligible effect on the final spectrum. Next, strong ISM features in each exposure are aligned via cross-correlation, and individual exposures are scaled to have the same mean continuum flux and placed onto a common wavelength grid using nearest-neighbor interpolation. The wavelength shifts were typically on the order of a resolution element (0.07 Å for our FUV data; Ghavamian et al., 2009; Kriss, 2011) or less. The coadded flux at each wavelength was taken to be the mean of the scaled fluxes in the individual exposures, weighted by the exposure time. Since our NUV data were all taken at the same central wavelength setting, we used the x1dsum files produced by CalCOS as our final data product.
| Target | aaThe emission line redshift of the QSO as listed in the NASA Extragalactic Database (NED), except for HE 0435–5304, whose redshift was measured from its coadded COS spectrum (NED lists for this QSO). | Grating | Obs. Date | bbContinuum level as measured at 1250, 1550, and 2800 Å in the coadded G130M, G160M, and G285M spectra, respectively. Flux levels are listed in femto-erg flux units (FEFUs), where 1 FEFU = . | ccMedian signal-to-noise ratio per resolution element in the grating passband, as measured by rms continuum deviations in the coadded spectra. | |
|---|---|---|---|---|---|---|
| (s) | (FEFU) | |||||
| RX J0439.6–5311 | 0.243 | G130M | 2010 Feb 07 | 8177 | 4.3 | 19 |
| G160M | 2010 Feb 07 | 8934 | 3.1 | 11 | ||
| G285M | 2010 May 26 | 4286 | 1.1 | 2 | ||
| HE 0439–5254 | 1.053 | G130M | 2010 Jun 10 | 8403 | 4.6 | 17 |
| G160M | 2010 Jun 10 | 8936 | 4.1 | 12 | ||
| G285M | 2010 Mar 28 | 4316 | 2.2 | 4 | ||
| HE 0435–5304 | 0.425 | G130M | 2010 Apr 13 | 8373 | 2.5 | 15 |
| G160M | 2010 Apr 13 | 8936 | 2.0 | 11 | ||
| G285M | 2010 Mar 31 | 4286 | 0.9 | 2 |
Continua are fit to the coadded data for each QSO using a semi-automated line-identification and spline-fitting technique as follows. First, the spectra are split into 5-10 Å segments. Continuum pixels within each segment are identified as those for which the signal-to-noise (defined here as flux/error) value is less than 1.5 below the median value for all the pixels in the segment. Thus, absorption lines (flux significantly lower than the segment average) are excluded, as are regions of increased noise (error higher than segment average). The process is iterated until minimal change occurs between one iteration and the next. The continuum pixels in a particular bin are then set and the median continuum flux node is recorded. A spline function is fitted between continuum nodes. The continuum fit of each entire spectrum is checked manually, and the continuum region identifications are adjusted as needed. The continuum identification and spline-fitting processes work reasonably well for smoothly varying data, but they were augmented with piecewise-continuous Legendre polynomial fits in a few cases. In particular, spline fits perform poorly in regions of sharp spectral curvature, such as the Galactic absorption and at the peaks of cuspy emission lines. More details on this process are given elsewhere (C. W. Danforth et al. 2013, in prep.).
Table 1 presents a summary of all of our HST/COS data. We list the target name and redshift, date of observation, total exposure time, flux level, and signal-to-noise ratio per resolution element for all gratings used. Our coadded FUV spectrum of HE 0439–5254 shows no emission lines so we have tabulated its redshift as listed in the NASA/IPAC Extragalactic Database111The NASA/IPAC Extragalactic Database is operated by the Jet Propulsion Laboratory, California Institute of Technology, under contract with the National Aeronautics and Space Administration. (NED). Interestingly, HE 0439–5254 shows a two-component partial Lyman-limit system (total ; hereafter all column densities have units of ) at that reduces the flux blueward of Å by %. Several emission lines are present in our COS spectra of RX J0439.6–5311 and HE 0435–5304, allowing us to measure their redshifts directly. The redshift of RX J0439.6–5311 agrees with the value listed in NED () but we have measured a much lower redshift of for HE 0435–5304. The previously reported NED redshift of HE 0435–5304 is as determined from the Hamburg/ESO survey for bright QSOs (Wisotzki et al., 2000); our updated redshift is derived from and N V emission in the COS spectrum.
Before searching the QSO spectra for absorption associated with ESO 157–49 or ESO 157–50, some care was taken to verify the accuracy of the COS wavelength scales. We measured the LSR velocity (13, 11, and 11 for RX J0439.6–5311, HE 0439–5254, and HE 0435–5304, respectively) of the peak of the H I 21-cm emission profile in the Leiden/Argentine/Bonn Galactic H I Survey (Kalberla et al., 2005; Bajaja et al., 2005; Arnal et al., 2000) and determined the corresponding heliocentric velocity (31, 29, and 29 for RX J0439.6–5311, HE 0439–5254, and HE 0435–5304, respectively, assuming a solar motion with respect to the LSR of 20 toward (18h,) at epoch 1900.0; Kerr & Lynden-Bell, 1986) toward the QSO lines of sight. We then measured the centroids of the low-ionization interstellar N I 1199.5, 1200.2, 1200.7 Å, S II 1250.6, 1253.8, 1259.5 Å, C II 1334.5 Å, Si II 1526.7 Å, Fe II 1608.5 Å, and Al II 1670.8 Å absorption lines in our coadded data, and found that their measured velocities were all within 15 of the predicted heliocentric velocities. Internal wavelength uncertainties (e.g., accuracy of the dispersion relation and the geometric distortion and grating mechanism drift models) limit the relative wavelength accuracy to 15 in the COS medium resolution gratings (Dixon et al., 2011). Thus, a systematic error of 15 is added in quadrature to the centroid-fitting errors of all measured absorption lines to produce our final error estimates for absorption line velocities (see Tables 2 & 3).
All lines in the COS spectra have been identified using an iterative procedure to determine the most likely transition associated with a given absorption feature. First we identified and metal-line absorption from the Milky Way ISM () and intrinsic absorption () associated with the AGN itself; all other absorption features are IGM absorbers (), which we assume to be by default. We searched for higher-order H I Lyman series lines and metal lines associated with individual absorbers, starting with the highest redshift IGM absorbers and proceeding toward . Before changing an absorber identification from we checked the new identification for physical consistency (e.g., a line with a small oscillator strength should not be stronger than a line of the same species with a large oscillator strength). In some cases, particularly in the high redshift HE 0439–5254 sight line, blending of H I or metal-line absorption at multiple redshifts was invoked to explain the strength of a particular feature when there was corroborating evidence (e.g., many Lyman series lines are detected at a particular redshift but the strength of one of them is inconsistent with the strength of the others). When these issues come up, the most likely identification(s) of a potentially-blended absorption feature are not always clear and the final choice is ultimately subjective. A full atlas specifying the redshifts, equivalent widths, and identifications of all absorption features in our COS spectra will be presented in Danforth et al. (2013, in prep.).
The rest of this Section describes and metal-line absorbers in the spectra of RX J0439.6–5311, HE 0439–5254, and HE 0435–5304 that are associated with the foreground galaxies ESO 157–49 and ESO 157–50 (see Fig. 1). We adopt the H I 21-cm emission centroids of ESO 157–49 and ESO 157–50 as found by the H I Parkes All-Sky Survey (HIPASS; Meyer et al., 2004) as the systemic velocities of these galaxies.
2.1. Absorption Lines Associated with ESO 157–49
| Species | aaThe line centroid as determined from direct line integration. | bbRest-frame equivalent widths as calculated from direct line integration. | SLccSignificance level of the detection or limit, expressed as a multiple of . | ddHeliocentric velocity of the line centroid derived from Voigt profile fits to the data. | eeDoppler parameter derived from Voigt profile fits to the data. Values without errors are the -values assumed for significance level calculation. | ffIonic column density derived from Voigt profile fits to the data. For upper limits, the values are calculated from the equivalent width limits assuming a linear curve of growth. | |
|---|---|---|---|---|---|---|---|
| (Å) | (Å) | (mÅ) | () | () | |||
| Lines Detected Toward RX J0439.6–5311 ( kpc)**The average velocity of the H i , C iv , Si iii , and Si iv detections toward RX J0439.6–5311 is . | |||||||
| H i | 1215.67 | ||||||
| C ii | 1334.53 | 25 | |||||
| C iv | 1548.20 | ||||||
| C iv | 1550.78 | ||||||
| Si ii | 1190.42 | 20 | |||||
| Si ii | 1193.29 | 20 | |||||
| Si ii | 1260.42 | 20 | |||||
| Si ii | 1304.37 | 20 | |||||
| Si ii | 1526.71 | 20 | |||||
| Si iii | 1206.50 | ||||||
| Si iv | 1393.75 | ||||||
| Si iv | 1402.77 | 16 | |||||
| Mg ii | 2796.35 | 25 | |||||
| Mg ii | 2803.53 | 25 | |||||
| Lines Detected Toward HE 0439–5254 ( kpc)****The average velocity of the H i , C iv , Si iii , and Si iv detections toward HE 0439–5254 is . | |||||||
| H i | 1215.67 | ||||||
| C ii | 1334.53 | 14 | |||||
| C iv | 1548.20 | ||||||
| C iv | 1550.78 | ||||||
| Si ii | 1190.42 | 25 | |||||
| Si ii | 1193.29 | 25 | |||||
| Si ii | 1260.42 | 25 | |||||
| Si ii | 1304.37 | 25 | |||||
| Si ii | 1526.71 | 25 | |||||
| Si iii | 1206.50 |
ggWe list these as Si III components, which are labeled with question marks in Figure 2 for completeness only. See Section 2.1.2 for details.
|
|||||
|
ggWe list these as Si III components, which are labeled with question marks in Figure 2 for completeness only. See Section 2.1.2 for details.
|
|||||||
| Si iv | 1393.75 | ||||||
| Si iv | 1402.77 | ||||||
| Mg ii | 2796.35 | 25 | |||||
| Mg ii | 2803.53 | 25 | |||||
| Lines Detected Toward HE 0435–5304 ( kpc)******The average velocity of the H i absorption detected toward HE 0435–5304 is . | |||||||
| H i | 1215.67 | ||||||
| C ii | 1334.53 | 25 | |||||
| C iv | 1548.20 | 25 | |||||
| C iv | 1550.78 | 25 | |||||
| Si ii | 1190.42 | 25 | |||||
| Si ii | 1193.29 | 25 | |||||
| Si ii | 1260.42 | 25 | |||||
| Si ii | 1304.37 | 25 | |||||
| Si ii | 1526.71 | 25 | |||||
| Si iii | 1206.50 | 25 | |||||
| Si iv | 1393.75 | 25 | |||||
| Si iv | 1402.77 | 25 | |||||
| Mg ii | 2796.35 | 25 | |||||
| Mg ii | 2803.53 | 25 | |||||
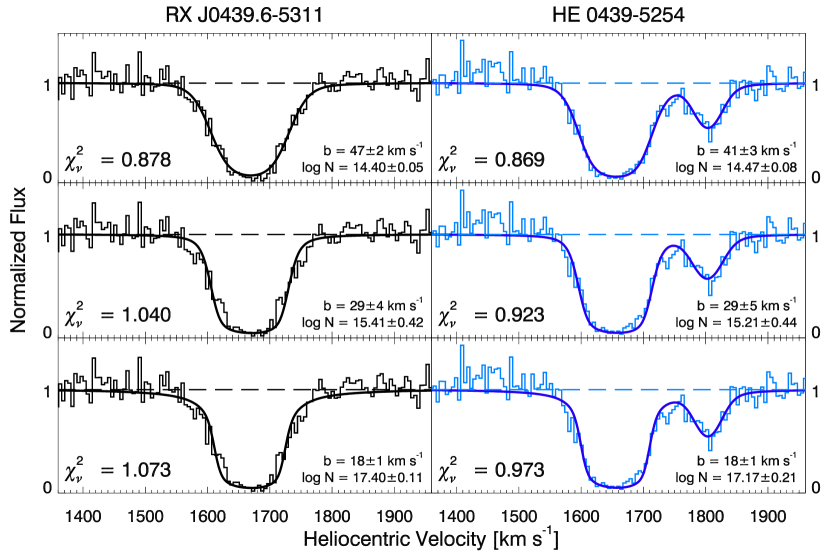
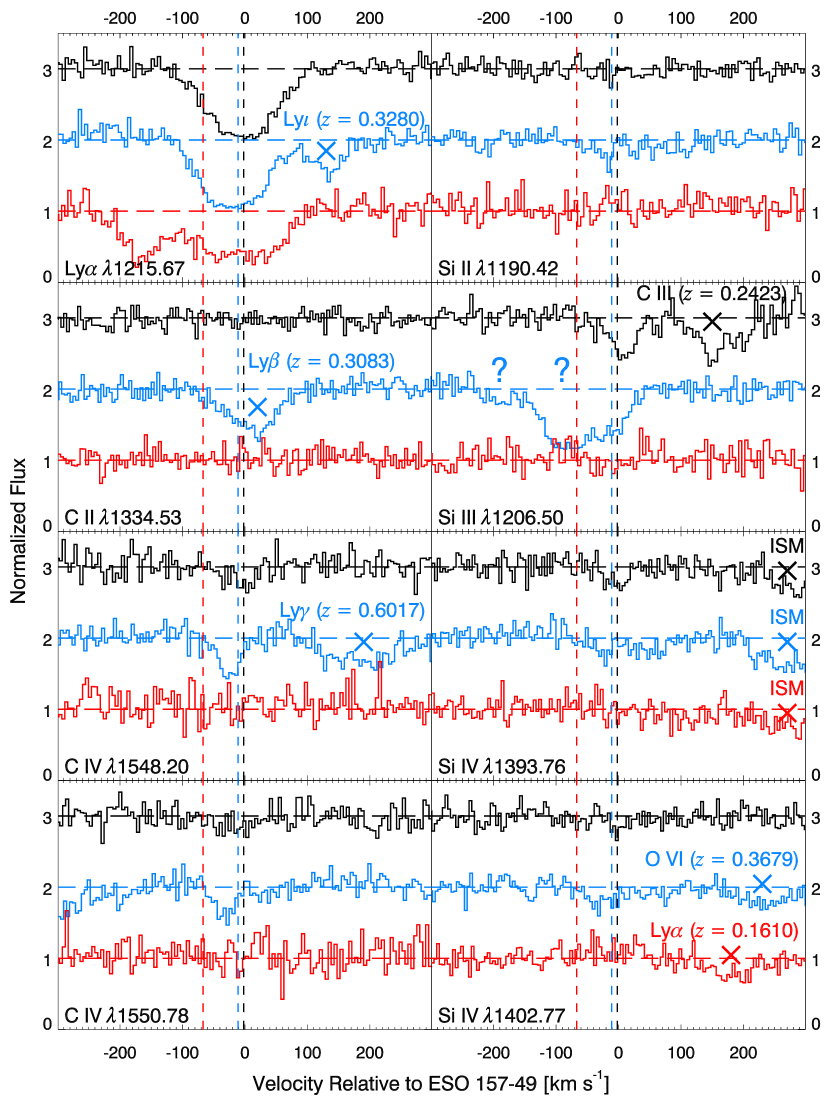
Figure 2 displays the absorption lines associated with ESO 157–49 in our HST/COS spectra of RX J0439.6–5311 (top, black), HE 0439–5254 (middle, blue), and HE 0435–5304 (bottom, red). Normalized absorption-line profiles of , C II , C IV , Si II , Si III , and Si IV are shown as a function of velocity relative to the galaxy’s systemic velocity of . While Si II and are more sensitive transitions than Si II , they both suffer from intervening absorption222We use the term “intervening absorption” as shorthand to indicate absorption features unassociated with ESO 157–49 or ESO 157–50 that are located near the expected position of absorption features that are associated with these galaxies. These absorbers are labelled with an “” or “?” in Figs. 2 and 4. in two of the three sight lines at the redshift of ESO 157–49, so we have chosen to display the weaker 1190 Å transition in Figure 2. The dashed vertical lines show the average velocity of the line detections toward RX J0439.6–5311 ( ), HE 0439–5254 ( ), and HE 0435–5304 ( ).
Table 2 lists the species, rest wavelength, observed wavelength, rest-frame equivalent width, and significance level for all transitions shown in Figure 2, along with all accessible Si II transitions and the Mg II doublet. The observed wavelength and equivalent width are calculated from direct line integration. The methodology of our significance level calculations, which take into account the effects of the non-Gaussian COS on-orbit line spread function and the presence of non-Poissonian noise in our data, are detailed in Keeney et al. (2012). For non-detections we list 3 equivalent width limits and their corresponding column density limits assuming a linear curve of growth. As described in Keeney et al. (2012), determining the significance level of a line detection (or equivalent width limit for a non-detection) requires knowing or assuming a -value for the line; thus, we list the assumed -values for our non-detections in Table 2. When possible, we use the -value of a line detection for the same species to inform our assumed -values for non-detections; otherwise we assume a -value of 25 . For intervening lines we list the equivalent width of the line integrated over the same velocity range that was used for H I (1534–1808 for RX J0439.6–5311, 1541–1756 for HE 0439–5254, and 1421–1790 for HE 0435–5304) and calculate the column density as for non-detections.
Table 2 also lists best-fit absorption velocities, Doppler parameters, and ionic column densities from Voigt profile fits to the detected lines. All rest wavelengths, oscillator strengths, and transition rates required to determine the Voigt profile of a transition with a given -value and column density are taken from Morton (2003). The fits themselves are performed with custom IDL routines that convolve the idealized Voigt profile with the COS line spread function of Kriss (2011) to properly account for instrumental resolution effects. If both lines of a doublet (i.e., C IV or Si IV) are detected we perform a simultaneous fit to both lines.
Since the observed profiles in the RX J0439.6–5311 and HE 0439–5254 sight lines reside in the flat part of the H I curve of growth, their Voigt profile fits require special consideration. The best fits based on minimization are double-valued: , and , for RX J0439.6–5311, and , and , for HE 0439–5254. Both solutions have (see Figure 3), which we interpret to mean that our data for these sight lines cannot constrain the H I column density very well. We do not find the same ambiguity in the H I column density for the HE 0435–5304 sight line because each of the three components have significantly smaller equivalent widths than the profiles of RX J0439.6–5311 and HE 0439–5254, and they are not saturated. Table 2 lists the full formal range of -value and column density permitted by our fits for the three QSO sight lines.
Figure 3 shows the observed profiles for RX J0439.6–5311 (left panels, black) and HE 0439–5254 (right panels, blue). The top panels show the high -value, low column density solutions for each sight line and their associated values, and the lower panels show the low -value, high column density solutions for each sight line and their associated values. The middle panels show intermediate solutions using additional information from photoionization modeling (see Section 4) and their associated values. The best-fit -values and column densities for these intermediate solutions are: , for RX J0439.6–5311, and , for HE 0439–5254. The adoption of these intermediate values is justified in Section 4.1.
Figure 2 and Table 2 show that H I is the only species detected in all three QSO sight lines. Intermediate-ionization metal lines (Si III, Si IV, and C IV) are detected toward RX J0439.6–5311 and HE 0439–5254, but no metals are detected toward HE 0435–5304. No low ions (i.e., C II, Si II, or Mg II) are detected at the redshift of ESO 157–49 in any of the sight lines. Lyman limit systems (–) tend to have strong associated Mg II ( Å) and other low ion absorption. While we can only rule out the presence of strong Mg II absorption in one of our sight lines (see Table 2), we can rule out the presence of C II or Si II absorption with in all of them, so we feel confident in ruling out our high H I column density solutions for the RX J0439.6–5311 and HE 0439–5254 absorbers associated with ESO 157–49; we elaborate further on this point in Section 4.1. Our spectra do not cover the wavelengths of higher ions such as O VI and Ne VIII, but no N V absorption is detected at the redshift of ESO 157–49 in any of our QSO sight lines.
The following subsections detail the individual absorption lines detected in each QSO sight line, including discussions of which lines are contaminated by intervening absorbers, which lines provide the most stringent ionic column density constraints in a given sight line, and which lines have unsatisfactory identifications. Readers not interested in these details may wish to skip to Section 2.2.
2.1.1 Absorption toward RX J0439.6–5311
We detect absorption from H I , C IV , Si III , and Si IV in the spectrum of RX J0439.6–5311 at an average velocity of , only lower than the systemic velocity of ESO 157–49. No other absorption is detected near the redshift of ESO 157–49 at confidence except for an intervening line coincident with the expected location of Si II . Even though the Si II region is contaminated by a absorber at , it still provides a more stringent constraint on the Si II column density than the uncontaminated Si II and Si II transitions due to its much larger oscillator strength (see Table 2; Morton, 2003).
| Species | aaThe line centroid as determined from direct line integration. | bbRest-frame equivalent widths as calculated from direct line integration. | SLccSignificance level of the detection or limit, expressed as a multiple of . | ddLSR velocity of the line centroid derived from Voigt profile fits to the data. | eeDoppler parameter derived from Voigt profile fits to the data. Values without errors are the -values assumed for significance level calculation. |
ffIonic column density derived from Voigt profile fits to the data. For upper limits, the values are calculated from the equivalent width limits assuming a linear curve of growth.
|
|
|---|---|---|---|---|---|---|---|
| (Å) | (Å) | (mÅ) | () | () | |||
| Lines Detected Toward HE 0439–5254 ( kpc)**The average velocity of the H i and C iv detections toward HE 0439–5254 is . | |||||||
| H i | 1215.67 | ||||||
| C ii | 1334.53 | 30 | |||||
| C iv | 1548.20 | ||||||
| C iv | 1550.78 | 30 | |||||
| Si ii | 1190.42 | 30 | |||||
| Si ii | 1193.29 | 30 | |||||
| Si ii | 1260.42 | 30 | |||||
| Si ii | 1304.37 | 30 | |||||
| Si ii | 1526.71 | 30 | |||||
| Si iii | 1206.50 | 30 | |||||
| Si iv | 1393.75 | 30 | |||||
| Si iv | 1402.77 | 30 | |||||
2.1.2 Absorption toward HE 0439–5254
We detect absorption from H I , C IV , Si III , and Si IV at an average velocity of , or lower than the systemic velocity of ESO 157–49. Intervening absorption plagues this sight line more than the others due to its long redshift pathlength (see Fig. 2 and Table 1); intervening lines contaminate the expected locations of C II , Si II , Si II , and Si II . As for the absorption toward RX J0439.6–5311, the Si II column density limit derived from the contaminated Si II region is comparable to the limit derived from the uncontaminated Si II line.
The Si III region shows a complex absorption profile with contributions from three distinct components (see Fig. 2). The red-most component is coincident with the H I , C IV , and Si IV velocity centroids but the centroids of the other two components span velocities not seen in any other metal line, including adjacent ionization states of silicon (e.g., Si II 1190 and Si IV ). Furthermore, there is no indication of velocity components that coincide with these Si III components; thus, we doubt that these features are Si III absorption associated with ESO 157–49. However, since they lie blueward of the rest wavelength of , we cannot identify them as intergalactic absorbers nor can we plausibly associate them with any other absorption line system in the spectrum of HE 0439–5254. We have marked these components with question marks in Figure 2 and included them as Si III components in Table 2 for completeness. However, our reservations remain, and we only treat the red-most component at as Si III absorption associated with ESO 157–49 from here onward.
2.1.3 Absorption toward HE 0435–5304
We detect absorption from three H I components in the spectrum of HE 0435–5304 at , , and . These components have velocities of , , and with respect to the systemic velocity of ESO 157–49. No other absorption is detected near the redshift of ESO 157–49 at confidence except for intervening lines at other redshifts coincident with the expected locations of Si II and Si II . Equivalent width and column density limits for these intervening lines were calculated by integrating over the full velocity range spanned by all three components (1421–1790 ).
The HE 0435–5304 sight line is located near the minor axis of ESO 157–49 (see Fig. 5) where one might expect to find signatures of an outflowing galactic wind. Indeed, the H I absorption in this sight line shows the largest deviation from the galaxy’s systemic velocity of any absorption associated with ESO 157–49 in the three QSO sight lines. However, one would expect a galactic-scale outflow to be driven by supernova explosions, and thus enriched with metals, which we do not detect in this sight line. We return to the issue of whether the high velocity absorber in the HE 0435–5304 spectrum is consistent with an outflowing wind from ESO 157–49 in Sections 3.1.1 and 5.
2.2. Absorption Lines Associated with ESO 157–50
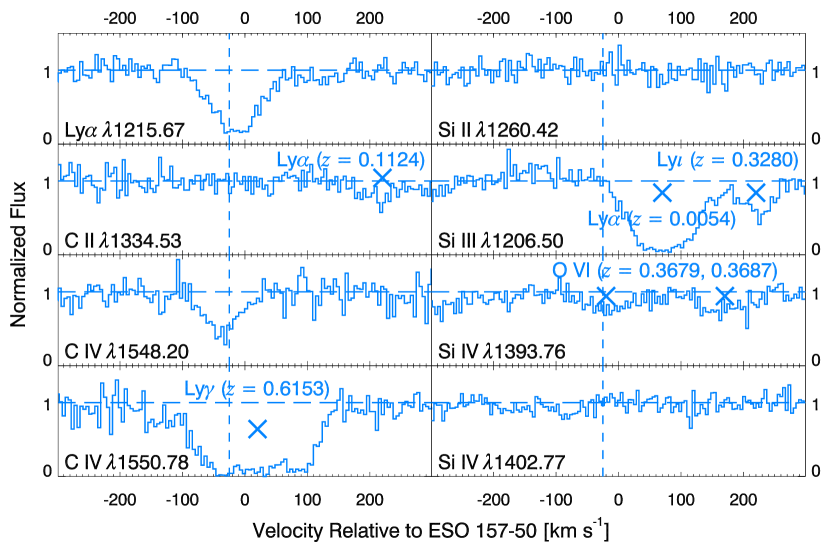
Figure 4 displays the absorption lines associated with ESO 157–50 in our HST/COS spectrum of HE 0439–5254; the other two QSOs are both located at impact parameters kpc and show no absorption associated with ESO 157–50. Normalized absorption-line profiles of , C II , C IV , Si II , Si III , and Si IV are shown as a function of velocity relative to the galaxy’s systemic velocity of . H I and C IV are clearly detected, but other potential detections of C IV , Si III , and Si IV have other, more plausible, identifications as indicated in Figure 4. The dashed vertical line in Figure 4 shows the average velocity ( ) of the H I and C IV detections, which is less than the galaxy’s systemic velocity.
Table 3 lists the observed properties of the transitions shown in Figure 4, along with all accessible Si II transitions. The columns are defined as for Table 2. For intervening lines we list the equivalent width of the intervening line integrated over the same velocity range that was used for (3758–3938 ) and calculate the column density as for non-detections. Our COS G285M NUV spectra do not cover the wavelengths of the Mg II doublet at the redshift of ESO 157–50.
We find the same ambiguity in the H I column density of the absorption associated with ESO 157–50 as we did for the absorption associated with ESO 157–49 in the RX J0439.6–5311 and HE 0439–5254 sight lines. In this case, the two solutions have with and , and with and . Even though we have reservations about the physical plausibility of a +C IV absorber with (implying a temperature of K), Table 3 lists the full range of -value and column density allowed by our fits.
3. Galaxy Observations
We have acquired optical imaging and spectroscopy and H I 21-cm emission maps of the galaxies ESO 157–49 and ESO 157–50 to complement our HST/COS QSO spectra. Table 3.1 summarizes the properties of these galaxies, which are derived in the subsections below.
3.1. Optical Imaging
ESO 157–49 and ESO 157–50 were observed with the CFCCD imager of the CTIO 0.9m telescope on 22-25 August 2003. Each galaxy was observed in broadband and filters and a narrowband filter. All observations were taken under photometric conditions with seeing ranging from –. All images were processed with standard IRAF procedures and surface brightness profiles of both galaxies were generated using the ISOPHOTE package of STSDAS333STSDAS is a product of the Space Telescope Science Institute, which is operated by AURA for NASA..
The CCD field-of-view (FOV) is approximately with a pixel scale of , but the FOV of some of our filters underfilled the detector so after co-addition of exposures with identical pointings taken through the same filter we restrict our analysis to an unvignetted FOV centered on each galaxy. Limiting magnitudes for point sources in our - and -band images are 25.4 and 24.5, respectively; limiting surface brightnesses are 24.0, 22.9, and 22.2 in the , , and images, respectively. All limits have been quoted to confidence and the surface brightness limit corresponds to a limiting areal star formation rate (SFR) of using the to SFR conversion of Calzetti et al. (2010).
| Galaxy | Morph. | Incl. | SFR | |||||||
|---|---|---|---|---|---|---|---|---|---|---|
| Type | () | ( kpc) | (kpc) | () | () | () | () | |||
| ESO 157–49 | Sb? | 0.2–1.1 | 90–170 | 40–270 | ||||||
| ESO 157–50 | Sc | 0.6–4.4 | 130–230 | 120–690 |
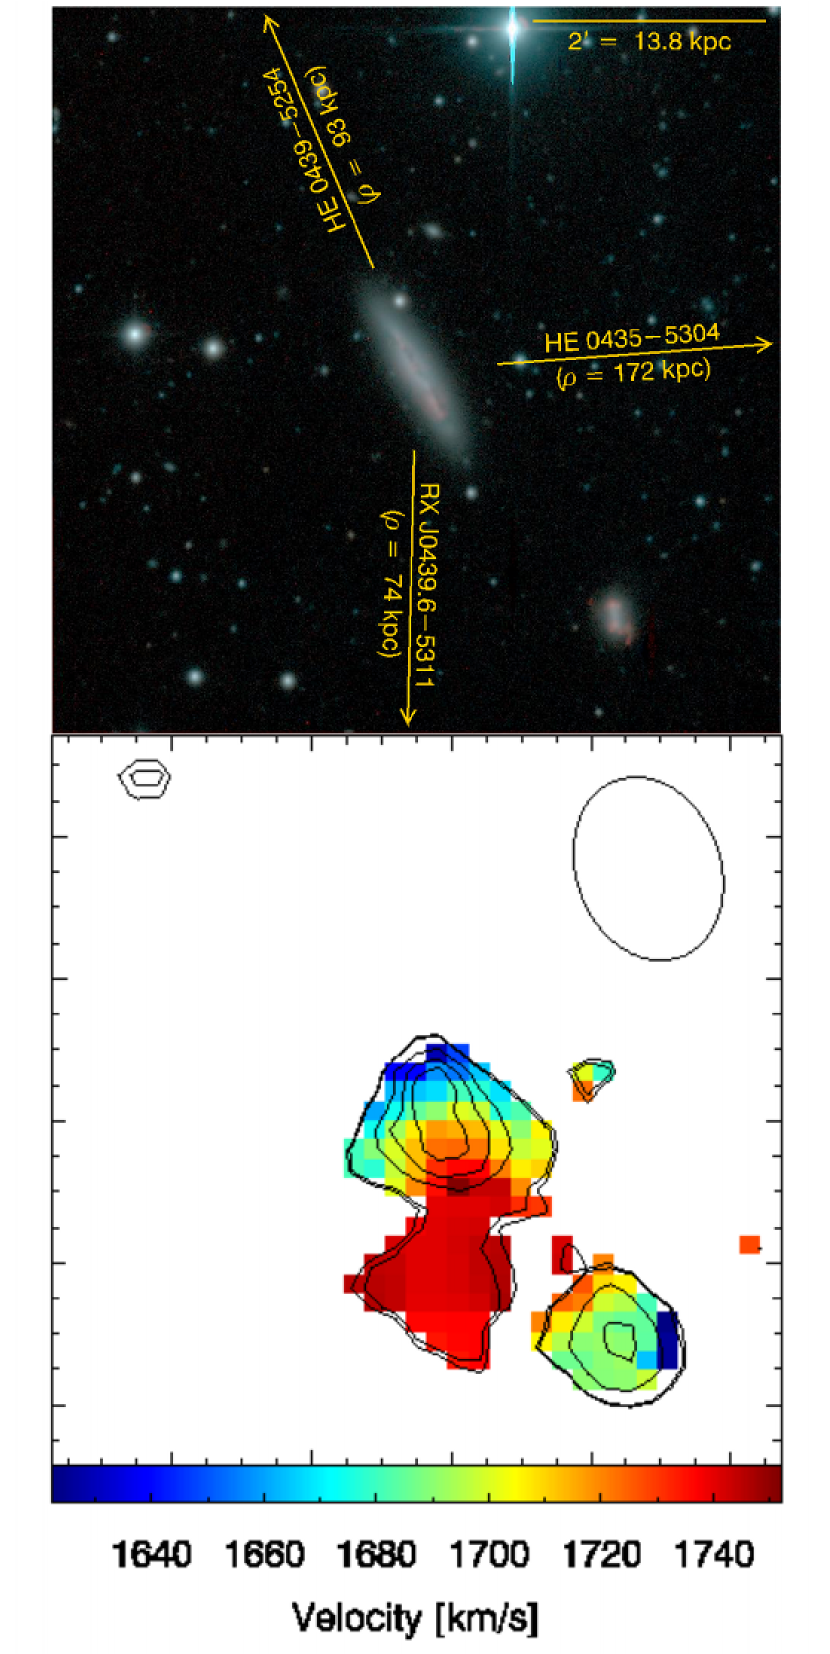
3.1.1 ESO 157–49
The top panel of Figure 5 shows a color composite of our - and -band images of ESO 157–49 with emission overlaid in red. The direction and impact parameter to each of the nearby QSOs is labeled, from which one can see that RX J0439.6–5311 and HE 0439–5254 probe ESO 157–49 near its major axis and HE 0435–5304 is located near the galaxy’s minor axis. ESO 157–49 is observed to be nearly edge-on, with an inclination of assuming an intrinsic axial ratio of 0.175 appropriate for Sc galaxies (see, e.g., Table 1 of Masters et al., 2010).
There is a prominent dust lane on the western side of the galaxy (i.e., the side towards HE 0435–5304; see Fig. 5), indicating that it is more distant than the galaxy’s eastern side. This orientation implies that outflowing gas will be blueshifted with respect to the galaxy’s systemic velocity if we assume that a galaxy-scale wind travels approximately perpendicular to the galactic disk at large distances (gas falling toward the disk would be redshifted with respect to the galaxy’s systemic velocity assuming this geometry; Stocke et al., 2010). The high velocity H I component detected in the COS spectrum of HE 0435–5304 has a velocity of with respect to the systemic velocity of ESO 157–49 (see Fig. 2 and Table 2), making it kinematically consistent with outflowing gas.
We measure a total -band magnitude of for this galaxy by extrapolation of its surface brightness profile via a best-fit exponential disk model. This same surface brightness profile predicts a radius of kpc to the 25 -band isophote, which we use in Section 3.3.1 to constrain the dynamical mass of ESO 157–49. Given the high inclination of ESO 157–49, a significant portion of its -band flux can be obscured by internal dust extinction, so we have corrected our observed magnitude to a face-on magnitude of using the parameterization of Driver et al. (2008). Driver et al. (2008) apply their inclination correction to all galaxies in the Millennium Galaxy Catalogue (Liske et al., 2003; Driver et al., 2005; Allen et al., 2006) to derive a luminosity function with best-fit Schechter parameters of and . This calibration implies that ESO 157–49 has a -band luminosity of .
We used our -band images to remove continuum emission from the narrowband images following the procedure detailed in Kennicutt et al. (2008). We then corrected for the presence of [N II] in the filter bandpass using the measured [N II]/ ratio from our optical spectra of ESO 157–49 (see Section 3.3.1), allowing us to measure an integrated flux of for the galaxy. At a distance of Mpc (Willick et al., 1997; Tully et al., 2009) this corresponds to an luminosity of or a SFR of (Calzetti et al., 2010). However, the observed flux is likely attenuated by dust due to the high inclination of ESO 157–49; if we assume that the Driver et al. (2008) -band paramaterization is appropriate to apply to our images then the SFR of ESO 157–49 could be as high as .
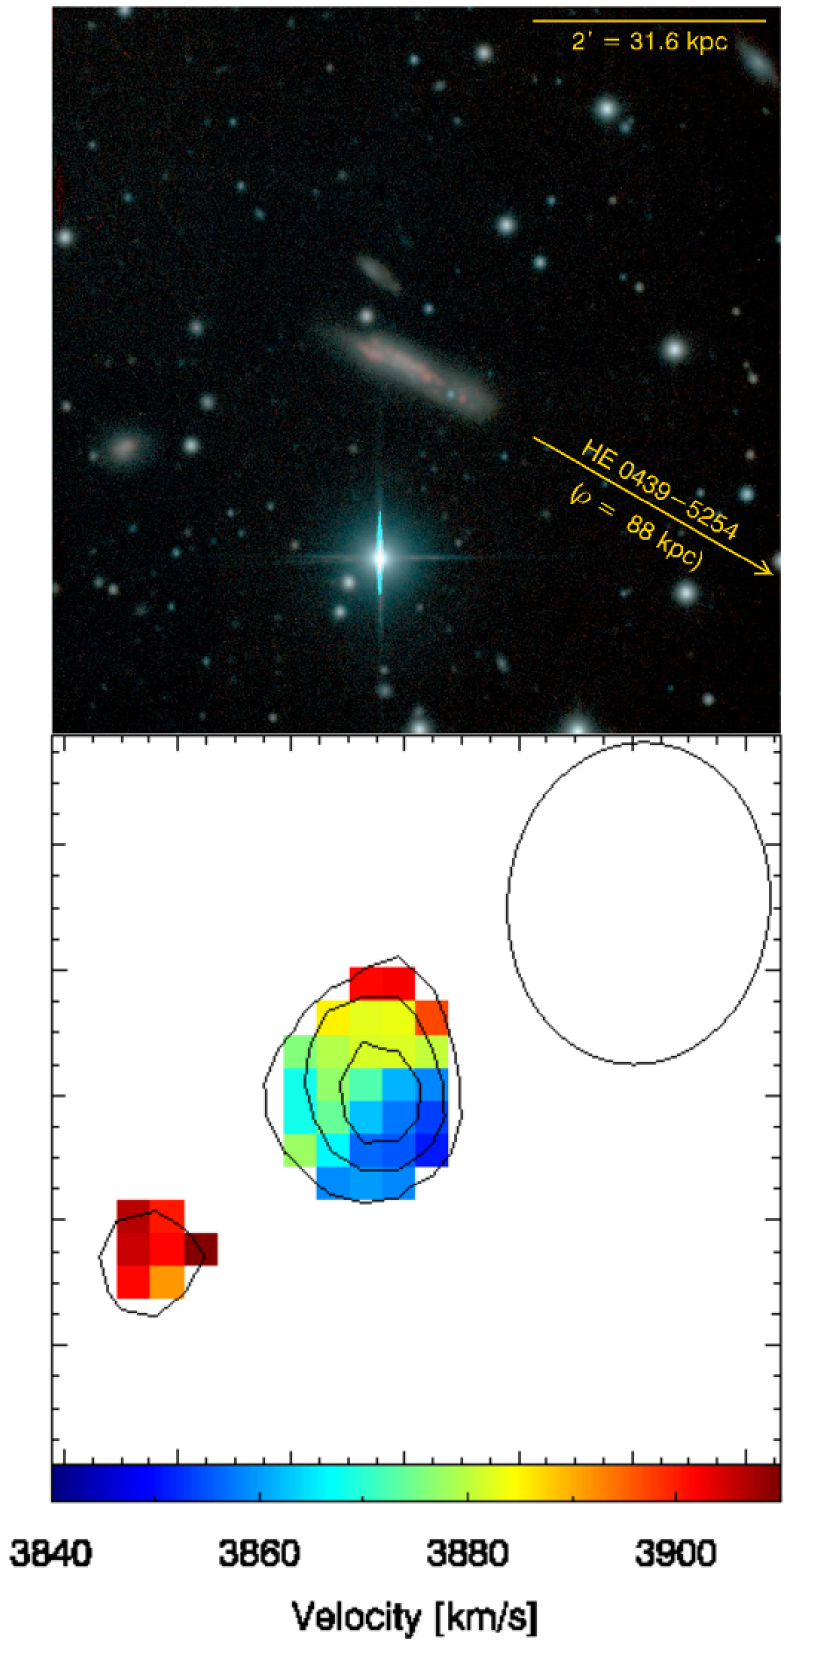
3.1.2 ESO 157–50
The top panel of Figure 6 shows a color composite of our - and -band images of ESO 157–50 with emission overlaid in red. The direction and impact parameter to HE 0439–5254 is labeled, showing that the QSO sight line probes the galaxy along its major axis. Like ESO 157–49, ESO 157–50 is seen nearly edge-on, with an inclination of assuming an intrinsic axial ratio of 0.175. We measure a total -band magnitude of for ESO 157–50, which corresponds to a face-on magnitude of and a luminosity of (Driver et al., 2008). The measured flux of ESO 157–50 is , which corresponds to a SFR of (Calzetti et al., 2010) assuming a Hubble-flow distance of Mpc. Given the high inclination of ESO 157–50, its SFR could be as high as if the extinction corrections of Driver et al. (2008) apply. Our best-fit surface brightness model predicts that ESO 157–50 has an optical size of kpc.
3.2. H I 21-cm Imaging
The H I 21-cm data for this project was obtained at the Australia Telescope Compact Array (ATCA) on 30 December 2002 (ESO 157–50) and 23 February 2003 (ESO 157–49). ESO 157–50 was observed for 3 hours with the EW 367 array with 2049 channels covering a 4 MHz bandpass centered on 1402 MHz. ESO 157–49 was observed for 3 hours using the 750D array with 2049 channels covering a 4 MHz bandpass centered on 1412 MHz. The data were reduced with MIRIAD using standard methods. The resulting data for ESO 157–49 have a velocity resolution of 4.1 and a beam size of . The data for ESO 157–50 have a velocity resolution of 4.1 and a beam size of .
H I 21-cm contours and velocities for ESO 157–49 and ESO 157–50 are shown in the lower panels of Figures 5 and 6, respectively. These maps were generated by calculating the zeroth and first moments of the ESO 157–49 and ESO 157–50 data cubes after blanking channels. At each position in the map, the spectra were smoothed by 5 pixels and channels that do not exceed were blanked in the unsmoothed spectra. The unsmoothed rms is 5.5 for ESO 157–49 and 5.9 for ESO 157–50, corresponding to column density limits over 5 channels of and , respectively.
3.2.1 ESO 157–49
Figure 5 shows that ESO 157–49 has a small companion galaxy, ESO 157–48, located 20 kpc to the southwest and detected in both and H I 21-cm emission. We measure this galaxy to have and an integrated flux of , corresponding to a luminosity of and SFR , respectively. We also detect tidal debris between ESO 157–49 and ESO 157–48 in the direction of RX J0439.6–5311; however, since this tidally stripped gas has a velocity higher than the QSO absorption toward this sight line, we do not believe that the QSO absorption originates in this tidally stripped, H I 21-cm emitting gas (see Fig. 5).
ESO 157–49 has an H I mass of as measured by HIPASS (Meyer et al., 2004). We choose to adopt the HIPASS mass as rather than calculate it from our ATCA data because it is a single-dish measurement and thus more complete on large scales. However, we note that this value is an overestimate of the true mass of ESO 157–49 since ESO 157–48 and the tidal debris fall within the HIPASS beam with velocities comparable to ESO 157–49, so their 21-cm emission profiles are undoubtedly confused at HIPASS resolution. Our ATCA data (Fig. 5) show that ESO 157–49 has a H I 21-cm flux that is % of the total flux in the region. ESO 157–48 contributes and the tidal material % of the total flux. If we assume this same ratio holds for the HIPASS data, then ESO 157–49 has an H I mass of .
3.2.2 ESO 157–50
Figure 6 shows that ESO 157–50 also has a small companion, located 40 kpc to the ESE, that is detected in emission. This galaxy has and a luminosity of . Its integrated flux is , corresponding to a SFR of approximately . Our broadband optical images also show an edge-on disk galaxy just to the north of ESO 157–50, but since it is not detected in emission we believe it to be a background galaxy (given the large beam size and proximity of this disk to ESO 157–50 we are not able to resolve H I 21-cm emission from this putative background galaxy).
The companion to ESO 157–50 is also tentatively detected in H I 21-cm emission at significance. Its 21-cm centroid is offset to the south of the optical position but the H I beam size is so large that the and H I emission could be spatially coincident. ESO 157–50 has an H I mass of as measured by HIPASS (Meyer et al., 2004), but our ATCA data (Fig. 6) show that the companion’s mass is % of the mass of ESO 157–50. If we assume that this ratio holds in the HIPASS data as well, ESO 157–50 has an H I mass of .
3.3. Optical Spectra
The optical spectroscopy for this project was performed using the double-beam spectrograph on the 2.3m telescope at the Mount Stromlo Siding Springs Observatory on 23 October 2003. The spectrograph was set up to use the 600 grating on the blue side covering a wavelength range of approximately 3450–5350 Å. On the red side we used the higher resolution 1200 grating, which covered a wavelength range of approximately 6500–7500 Å. For this work we focus primarily on the results from the red side of the spectrum, which has a dispersion of 0.52 Å/pixel ( at ) and a pixel scale in the spatial direction of (100 pc/pixel and 240 pc/pixel for ESO 157–49 and ESO 157–50, respectively). Three 2000-s exposures were taken of each galaxy using a slit; the seeing was .
Data reduction was done following standard procedures using IRAF with the blue and red spectra reduced independently. Once the basic CCD data processing was complete, cosmic rays were removed and the wavelength scale was established. For the purpose of measuring emission lines, one dimensional spectra were extracted from the data. For each galaxy, the extraction was done both for the continuum region and also for a region that included line emission that extended beyond the continuum region. Line measurements using the two different methods of extraction were compared and found to be consistent. Software specifically designed for the extraction of rotation curves (written by A. West) was used to measure the rotation from the line. Since the seeing was and the rotation curves are generated on a pixel-by-pixel basis, any 2–3 adjacent data points will have correlated velocities and errors.
3.3.1 ESO 157–49
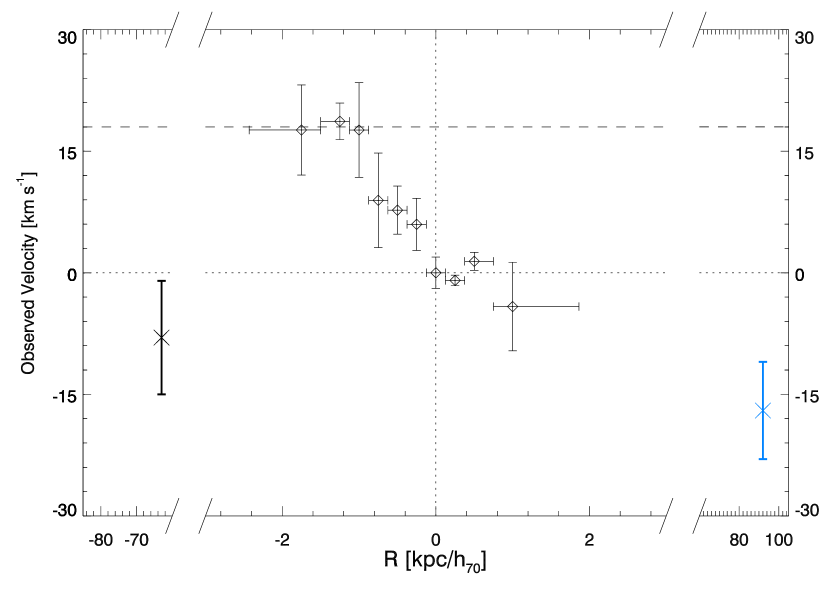
Figure 7 shows the rotation curve of ESO 157–49 derived from our spectrum. The galaxy has an centroid velocity of , which is consistent with the galaxy’s HIPASS velocity of . Our rotation curve shows some evidence for ordered rotation in ESO 157–49 at velocities consistent with our ATCA observations (Fig. 5) within kpc, but is not detected beyond that radius. Our narrowband image (see Fig. 5) shows emission extending to radii of 3.4 kpc and 2.7 kpc for the receding (SW) and approaching (NE) sides of the galaxy, respectively, measured with respect to the galaxy’s -band isophotal center. Our H I 21-cm emission map of ESO 157–49 is truncated on the galaxy’s approaching side, explaining why our rotation curve is also truncated on that side of the galaxy.
Figure 7 also shows the velocities of the two QSO absorbers located near the galaxy’s major axis with respect to the centroid velocity. The absorber velocities are displayed at their projected distances along the galaxy’s major axis (i.e., , where is the impact parameter and is the position angle between the QSO sight line and the galaxy’s major axis). Both absorbers are blueshifted with respect to the centroid velocity and only one, the HE 0439–5254 absorber, is located on the approaching side of the galaxy. While we think it unlikely that the HE 0439–5254 absorber is associated with galactic rotation since we see little evidence for rotation in ESO 157–49, if we interpret its velocity offset of in the context of galaxy rotation we find a dynamical mass of within kpc.
Since the rotation curve of ESO 157–49 is truncated, we resort to scaling relations to estimate its dynamical mass. If we assume a gas fraction of as is typical for nearby late-type galaxies (Roberts & Haynes, 1994) we find a mass444The “total mass” listed by Roberts & Haynes (1994) is an estimate of the mass within . of for ESO 157–49 within . This mass yields a mass-to-light ratio of in solar units, which is consistent with values found in nearby late-type galaxies (Roberts & Haynes, 1994).
As noted previously (see Sections 2.1.3 and 3.1.1), the HE 0435–5304 sight line probes ESO 157–49 near its minor axis, has a high velocity component at with respect to the galaxy’s systemic velocity, and the sign of the velocity offset is consistent with outflowing gas travelling perpendicular to the galaxy disk. We now turn our attention to whether this gas has sufficient velocity to escape the galaxy’s gravitational potential. The prescription of Prochaska et al. (2011) and halo abundance matching model of Stocke et al. (2013) predict that ESO 157–49 has a virial radius of 90–170 kpc from its -band luminosity (see Section 3.1.1; Table 3.1). Since the HE 0435–5304 absorbers are located at an impact parameter of kpc, which is comparable to the galaxy’s virial radius, the virial mass is an appropriate estimate of the enclosed mass from which the absorbing gas must escape. The range of plausible virial radii imply that ESO 157–49 has a virial mass of –11.4, suggesting an escape velocity at the absorber location of –115 . Thus, we conclude that the high velocity component in the HE 0435–5304 spectrum will escape the gravitational potential of ESO 157–49 if it is entrained in an outflowing starburst wind.
We have estimated the metallicity of ESO 157–49 using the Pettini & Pagel (2004) calibration of the index with galaxy metallicity (Storchi-Bergmann, Calzetti, & Kinney, 1994; Raimann et al., 2000; Denicoló, Terlevich, & Terlevich, 2002). Assuming the solar oxygen abundance of Asplund et al. (2009), we find that ESO 157–49 has a metallicity of .
3.3.2 ESO 157–50
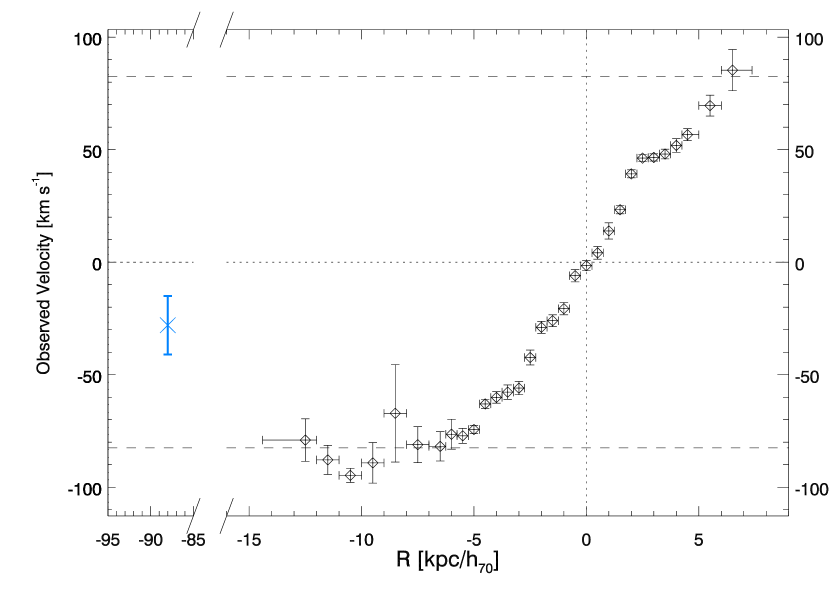
Figure 8 shows the rotation curve of ESO 157–50 derived from our spectrum. Unlike ESO 157–49, this galaxy shows clear signs of solid-body rotation within kpc of galaxy center with a flat rotation curve at larger radii. Figure 8 also shows the location of the HE 0439–5254 sight line along the galaxy’s major axis and the velocity of the + C IV absorber detected toward this sight line with respect to the galaxy’s centroid velocity of . This velocity is consistent with the galaxy’s HIPASS velocity of and the sense of rotation is also consistent with the spatially resolved H I data.
The dynamical mass of ESO 157–50 is straightforwardly calculated from its rotation curve, which flattens at an observed velocity of , corresponding to a rotation velocity assuming an inclination of for ESO 157–50 as calculated from our broadband optical images (see Section 3.1.2). The approaching (SW) side of the galaxy shows emission at this velocity out to (15 kpc), which implies that ESO 157–50 has a dynamical mass of interior to this radius. This mass implies that ESO 157–50 has a gas fraction of and a mass-to-light ratio of in solar units, both of which suggest that the total mass of ESO 157–50 within is slightly lower than the typical values found for nearby late-type spirals (e.g., Roberts & Haynes, 1994).
The H I + C IV absorber associated with ESO 157–50 is located along the galaxy’s major axis at kpc and has a velocity of with respect to the galaxy’s centroid velocity. If we interpret it in terms of a rotation velocity we find that ESO 157–50 has a dynamical mass of interior to the absorber position, comparable to but slightly less than the mass inside inferred from the data alone. Thus, we see no evidence that the QSO absorber is co-rotating disk gas.
We have estimated the metallicity of ESO 157–50 using the same method as for ESO 157–49 and find it to have .
4. Photoionization Modeling
To constrain the physical conditions in the absorbing gas, we constructed a grid of plane-parallel photoionization models with CLOUDY v08.00 (last described in Ferland et al., 1998). We have used the extragalactic ionizing radiation field of Haardt & Madau (2012) as our illuminating source, but find little difference if we use the radiation field of Shull, Smith, & Danforth (2012) instead. These absorbers are well beyond the “proximity effect” radius ( kpc for ESO 157–49 and kpc for ESO 157–50), which we calculate from the observed SFR using the prescriptions of Giroux & Shull (1997) and Kennicutt (1998) assuming an escape fraction of ionizing photons from these galaxies of %, so we include only an extragalactic ionizing flux, not any flux which might “leak” out of the galaxies themselves.
Our photoionization models vary the metallicity, , by steps of 0.2 dex in the range to 1 (solar abundance ratios were assumed; Grevesse et al., 2010), and the ionization parameter, , by steps of 0.2 dex in the range to 1. Assuming a fixed radiation field, we interpret changes in the ionization parameter to correspond to changes in cloud density, ; the two quantities are related by in our models. Column densities for H I and all metal ions commonly seen in UV absorption spectra were calculated at each grid point, but since all column densities scale with the assumed cloud dimensions in the optically thin regime, we compare model column density ratios with observed quantities only. For our final analysis, we interpolate the column densities from our model grid positions to a finer resolution (1000 steps in both and ).
| Sight Line | |||||||
|---|---|---|---|---|---|---|---|
| () | (kpc) | ||||||
| RX J0439.6–5311 | 1.2 | 4.0 | |||||
| HE 0439–5254 | 1.1 | 3.7 |
Note. — Column densities are given in units of and densities in .
4.1. Absorption Associated with ESO 157–49
We detect H I absorption associated with ESO 157–49 in all three QSO sight lines, and metal-line absorption from C IV, Si III, and Si IV toward RX J0439.6–5311 and HE 0439–5254. In the subsections below we detail our CLOUDY models of the absorption associated with ESO 157–49 in these two sight lines. The results of this modeling are summarized in Table 5.
Since we detect no metal lines toward HE 0435–5304 detailed modeling of the absorbers detected in this sight line is not possible. We note, however, that since the H I column densities for the absorbers in the HE 0435–5304 sight line are significantly smaller than the H I column densities in the two metal-bearing sight lines (see Tables 2 and 5), our spectrum of HE 0435–5304 is not sensitive enough to detect metal lines associated with these absorbers if they have similar metallicity and ionization parameter to what we find for the metal-line absorbers below. Thus, we cannot rule out the possibility that the absorbers detected toward HE 0435–5304 are scaled-down versions of the metal-bearing clouds detected in the other two sight lines. Of course they may also be more highly ionized, in which case they may even be larger and more massive than the metal-bearing clouds (see Equations 1 and 2).
4.1.1 RX J0439.6–5311
As described in Section 2.1, the H I column density of the absorption associated with ESO 157–49 in the RX J0439.6–5311 sight line is very uncertain because the equivalent width lies on the flat part of the curve of growth and no higher-order Lyman series lines are available in our spectrum. Voigt profile fits to the absorption find both a high -value, low column density solution ( , ) and a low -value, high column density solution ( , ). The low column density solution has the lowest reduced value (see top-left panel of Figure 3), and in the absence of other information would be preferred; however, our photoionization models suggest that an absorber with will not be able to reproduce the observed Si III column density, even at a metallicity of 10 times solar. If we were to adopt the high column density solution, we find that an absorber metallicity of is required to explain the absence of C II and Si II absorption in our COS spectrum. At this metallicity, we cannot simultaneously reproduce our observed Si III, Si IV, and C IV column densities. The grid point that comes closest has and , but this ionization parameter implies an unphysically large line-of-sight thickness ( kpc) and cloud mass ().
Rather than adopting either of these unsatisfactory solutions, we have assumed that the H I and metal lines reside in the same, purely-photoionized phase in order to infer the plausible range of H I column densities for this absorber. Specifically, we have bounded the H I column density by searching for the extrema that allow all of the measured metal-line column densities and upper limits to be explained simultaneously. This procedure yields for this absorber, which we adopt in our final CLOUDY model. The middle-left panel of Figure 3 shows a Voigt profile with this column density overlaid on our observed data.
Figure 9 shows our final CLOUDY model for the absorber in the RX J0439.6–5311 sight line. Contours indicate the region of - parameter space allowed by the observed metal-line column densities (solid lines) and upper limits (dot-dashed lines, with hash marks indicating the allowable portion of parameter space). The dashed lines bracketing the solid contours indicate the errors on the measured column density; to determine these values the systematic error in the H I column density has been added in quadrature with the metal-line uncertainties in Table 2. The gray shaded area shows the region of parameter space that is permitted by all of our measured column densities and upper limits, and the black star is located at the position where the solid Si III, Si IV, and C IV contours intersect. Under our assumptions for this absorber, the black star is located at the preferred values: and . The errors indicate the extrema of the permitted ionization parameters and metallicities. The dashed horizontal lines indicate the bounds on the galaxy metallicity from Section 3.3.1, which are consistent with the broad range of permitted absorber metallicities.
The preferred values of and imply a total hydrogen density of , a temperature of , and an ionization fraction of for this absorber using the relations in Stocke et al. (2007). From these values we can calculate an indicative line-of-sight cloud thickness of
| (1) |
Assuming spherical clouds with diameter , we estimate the total (hydrogen+helium) mass of warm photoinized gas in these absorbers to be
| (2) |
where is the mass of a hydrogen atom and is the primordial helium abundance (Peimbert, Luridiana, & Peimbert, 2007). We caution, however, that small changes in , on which and sensitively depend, can lead to large changes in inferred cloud sizes and masses (as can changes in ).
4.1.2 HE 0439–5254
The H I column density for the absorber toward HE 0439–5254 is also uncertain, and the column density solutions preferred by our Voigt profile fits (see Section 2.1) fail in the same ways detailed for the RX J0439.6–5311 absorber in Section 4.1.1 (i.e., we cannot reproduce all of the observed metal-line column densities for either of the H I column densities preferred by the Voigt profile fits). Again assuming that the H I and metal-line absorbers reside in a single photoionized phase, we adopt an H I column density of for our final CLOUDY models. The middle-right panel of Figure 3 shows a Voigt profile with this column density overlaid on the observed data.
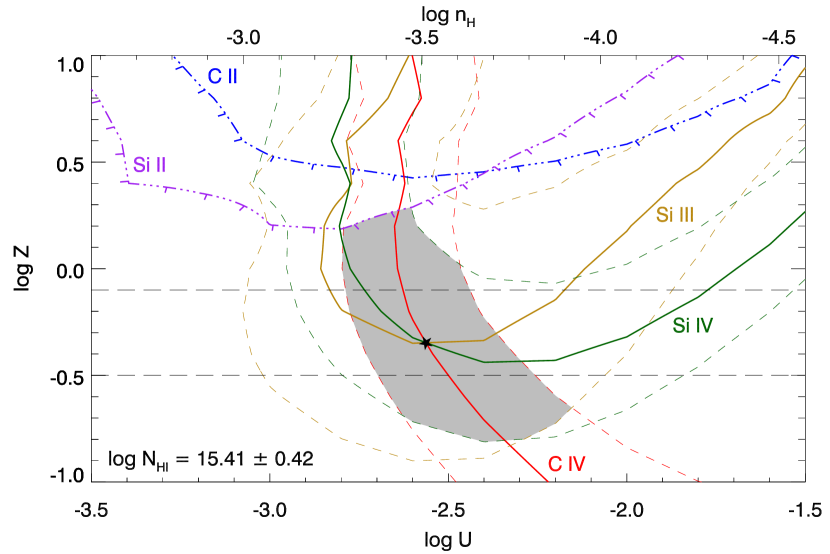
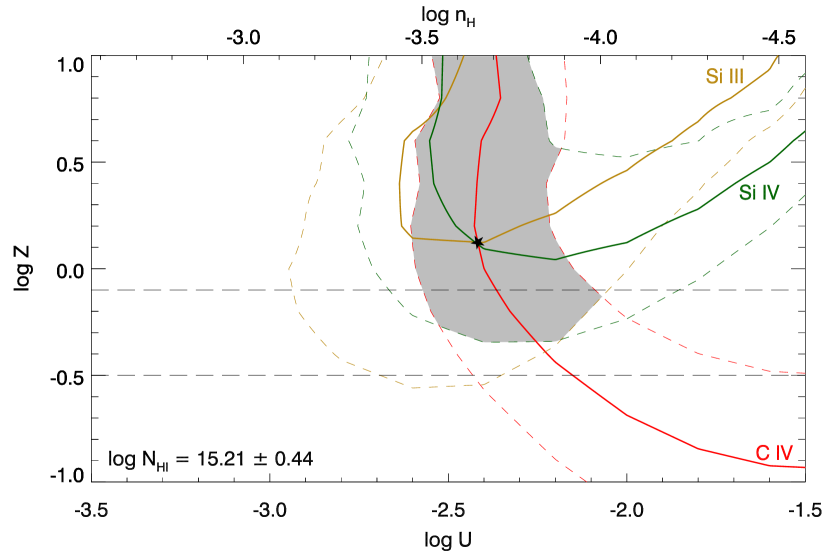
Figure 10 shows our final CLOUDY model for the HE 0439–5254 absorber associated with ESO 157–49. The smaller Si III/Si IV ratio for this absorber compared to the RX J0439.6–5311 absorber (see Table 2) favors larger ionization parameters than we found in Section 4.1.1. The preferred values for this absorber are and , but the upper bound on metallicity is not well constrained since it abuts the edge of our grid. The lower bound on the absorber metallicity is consistent with the galaxy metallicity of (dashed horizontal lines in Figure 10).
The preferred values of ionization parameter and metallicity for this absorber imply a total hydrogen density of , a temperature of , and an ionization fraction of using the relations in Stocke et al. (2007). These values in turn imply indicative values for the line-of-sight thickness and mass of the absorbing gas of kpc and , which are similar to those derived for the RX J0439.6–5311 absorber (see Equations 1 and 2). These indicative values come into even closer agreement with the values for the RX J0439.6–5311 absorber if we adopt and as our fiducial value instead (i.e., enforce ); the cloud size and mass at this grid point are kpc and , respectively.
The physical properties of the absorbing clouds toward RX J0439.6–5311 and HE 0439–5254 are very similar. While we may have biased our results in this regard by assuming a single photoionized phase for these absorbers, the H I column density, ionization parameter, metallicity, line-of-sight thickness, and mass of the absorbing clouds in the two sight lines were all calculated independently. The absorber in the HE 0439–5254 sight line shows evidence of being more highly ionized and more metal-rich than the RX J0439.6–5311 absorber, but all of the modeled and derived cloud parameters overlap within the errors for the two systems.
4.2. Absorption Associated with ESO 157–50
We detect H I and C IV absorption associated with ESO 157–50 in the COS spectrum of HE 0439–5254 (see Section 2.2). The H I column density for this absorber is uncertain because the equivalent width lies on the flat part of the curve of growth. Since the H I column density is so poorly constrained and the only metal line detected is C IV, we did not attempt detailed photoionization modeling of this absorber. However, considering that the C IV column density for this absorber is significantly stronger than the C IV column density detected for the absorbers associated with ESO 157–49 (see Tables 2 and 3) and we detect no lower ions, it is quite likely that this absorber is more highly ionized than those modeled in Section 4.1.
5. Discussion and Conclusions
The detection of multiple absorbers with projected distances less than or roughly equal to the virial radius of a single, rather normal spiral galaxy gives us the opportunity to characterize the CGM of late-type galaxies in general. Stocke et al. (2013) expand this effort to include all of the QSO/galaxy pairs observed by the COS GTO team, but this example is rather representative and provides a detailed look at modeling CGM clouds and the CGM in general.
Photoionization modeling of the metal-bearing clouds along the major axis of ESO 157–49 is uncertain because is determined only from a fit to a saturated (but not damped) line. Because of this, we have taken the tactic of using the observed galaxy metallicity as an upper bound on the absorber metallicity. This upper bound plus the observed metal line strengths create a lower bound on in the context of photoionization modeling. ESO 157–49 is relatively isolated, and while it has a small companion, we expect that the companion’s metallicity is less than the value for ESO 157–49 itself (; see Table 3.1). Further, any dilution of halo gas would be due to rather pristine IGM gas (the canonical present-day IGM metallicity is with considerable scatter; Danforth & Shull, 2008), also reducing the metallicity of these clouds to values below .
Assuming that the H I and metal lines reside in a single photoionized phase requires that for the RX J0439.6–5311 absorber and for the HE 0439–5254 absorber (see Section 4.1). Photoionization models using this restriced range of H I column densities for these absorbers find similar cloud properties for both systems (, kpc, and ; see Table 5). They also find absorber metallicities consistent with the galaxy metallicity to within the rather large uncertainties for both absorbers without the need to explicitly constrain .
With only and no metal-lines detected in the minor axis absorbers, their physical nature is poorly constrained. The absorption is unsaturated in the minor axis sight line, implying that the minor axis clouds have significantly less H I than the major axis clouds. Thus, the lack of metal absorption in this spectrum cannot exclude the possibility that the minor axis clouds have a metallicity similar to the disk of ESO 157–49. The three-dimensional orientation of ESO 157–49 requires that the blueshifted minor axis absorbers are outflowing. Further, the highest velocity absorber at will escape this galaxy into the IGM if the clouds are moving close to perpendicular to the galaxy’s disk.
The best-fit photionization models for the major axis clouds have ionization parameters of , midway between typical IGM absorbers (; Danforth & Shull, 2008) and Milky Way Si III-detected highly ionized HVCs (; Shull et al., 2009). This suggests that the clouds we have detected are more distant HVC-like objects, which are recycled gas that will eventually fall back onto the disk of ESO 157–49, contributing to future star formation in this galaxy. The kinematics of these clouds supports this interpretation because they are both blueshifted small amounts with respect to the galaxy’s systemic velocity (see Figure 7) and, therefore, cannot both be interpreted as distant disk gas. Both of these clouds are highly ionized HVCs given their kinematics, and are most easily interpreted as “galactic fountain” gas regardless of whether they are outflowing or infalling at the observed time ( and for both clouds; Stocke et al., 2013).
The “triple probe” of this galaxy’s CGM has resulted in the detection of five CGM clouds within the virial radius of ESO 157–49 (two metal-bearing major axis absorbers and three velocity components along the minor axis), suggesting a high covering factor of such clouds (see also Stocke et al., 2013 for more complete statistics). At least two, and maybe all five, of these clouds possess metals at levels. Using the estimated sizes (diameters) of these clouds from our photoionization models and assuming a covering factor of unity out to kpc radius (this radius could be larger if the minor axis clouds are also metal-bearing), we estimate several thousand of these clouds reside in the CGM of this galaxy. Because we are viewing the CGM of ESO 157–49 from afar, a high covering factor does not necessarily translate into a large filling factor (see description and formalism in Stocke et al., 2013). Even for several thousand clouds similar to those we have detected around this galaxy, the filling factor can be only a few percent. If we were looking outward from this galaxy’s disk, a highly ionized HVC at 50–100 kpc distance would be detected in only a small percentage of sight lines, consistent with the Milky Way’s HVC population.
In our galaxy, the highly ionized HVCs are found in most (%; Shull et al., 2009) sight lines studied in Si III absorption but, evidently, many are much closer to the disk than those we have described here (few kpc above the disk; Lehner & Howk, 2011). Therefore, studies of the Milky Way’s highly ionized HVC population are biased towards finding clouds close to the disk, since these provide a high covering and filling factor out to 10–20 kpc distances. QSO absorption line probes of the CGM of other galaxies find clouds at larger distances with lower filling factors. These two complementary approaches (Milky Way HVCs and QSO absorbers) allow us to study the full population of CGM gas around galaxies.
Using the cloud parameters derived by photoionization models and assuming a near unity covering factor for the warm CGM cloud population around ESO 157–49, the total mass in warm CGM gas around this galaxy is . This result is insensitive to the specific cloud size found in the photoionization modeling; larger cloud sizes lead to larger cloud masses but fewer clouds are needed to create a high covering factor. This mass is comparable to the mass of stars, gas, and dust in the disk of ESO 157–49. While extrapolating the results for this one galaxy to the CGM of late-type galaxies in general is very uncertain, the total CGM mass for ESO 157–49 that we calculate here is in good agreement with the results for an ensemble of low-, late-type galaxies in Stocke et al. (2013).
In addition to ESO 157–49, one of our sight lines probes a second edge-on spiral, ESO 157–50. and C IV absorption are detected at with respect to the galaxy’s systemic velocity. Unfortunately, an uncertain H I column density and the fact that only one metal line is detected preclude detailed photoionization modeling of this absorber, but the low and the presence of C IV absorption suggest that this absorber may also be recycling “galactic fountain” gas.
Recently, Chen (2012) has combined her own observations of C IV absorption associated with galaxies at (Chen et al., 2001a) with the high- CGM absorber sample of Steidel et al. (2010) to conclude that the spatial extent of CGM metal-line absorption ( kpc) hasn’t changed much in the last 11 Gyr. Tumlinson et al. (2011) found a similar extent for O VI absorption around star-forming galaxies at –0.3. Taken together, these results hint that if more sensitive spectra were available our minor axis clouds would be found to be metal-bearing (i.e., the only reason we don’t detect the metals in our spectra is due to their low H I column density).
These CGM absorbers are detected in similar ions to those detected in highly ionized HVCs around the Milky Way and represent a reservoir of circumgalactic gas that is perhaps ten times more massive (Shull et al., 2009; Richter, 2012). Given the low velocities of all of our metal-bearing absorbers with respect to the systemic velocities of ESO 157–49 and ESO 157–50, this reservoir may be largely invisible to an observer located within one of these galaxies. Thus, there may be large amounts of gas yet to be discovered in the halo of the Milky Way that will serve to fuel future episodes of Galactic star formation.
References
- Allen et al. (2006) Allen, P., Driver, S. P., Graham, A. W., et al. 2006, MNRAS, 371, 2
- Arnal et al. (2000) Arnal, E. M., Bajaja, E., Larrarte, J. J., Morras, R., & Pöppel, W. G. L. 2000, A&AS, 142, 35
- Asplund et al. (2009) Asplund, M., Grevesse, N., Sauval, A. J., & Scott, P. 2009, ARA&A, 47, 481
- Bahcall et al. (1991) Bahcall, J. N., Jannuzi, B. T., Schneider, D. P., et al. 1991, ApJ, 377, L5
- Bahcall et al. (1993) Bahcall, J. N., Bergeron, J., Boksenberg, A., et al. 1993, ApJS, 87, 1
- Bajaja et al. (2005) Bajaja, E., Arnal, E. M., Larrarte, J. J., et al. 2005, A&A, 440, 767
- Bergeron & Boissé (1991) Bergeron, J. & Boissé, P. 1991, A&A, 243, 344
- Boksenberg & Sargent (1978) Boksenberg, A. & Sargent, W. L. W. 1978, ApJ, 220, 42
- Bowen & Blades (1993) Bowen, D. V. & Blades, J. C. 1993, ApJ, 403, L55
- Bowen et al. (2001) Bowen, D. V., Tripp, T. M., & Jenkins, E. B. 2001, AJ, 121, 1456
- Bowen et al. (2002) Bowen, D. V., Pettini, M., & Blades, J. C. 2002, ApJ, 580, 169
- Calzetti et al. (2010) Calzetti, D., Wu, S.-Y., Hong, S., et al. 2010, ApJ, 714, 1256
- Carilli & van Gorkom (1992) Carilli, C. L. & van Gorkom, J. H. 1992, ApJ, 399, 373
- Chen et al. (1998) Chen, H.-W., Lanzetta, K. M., Webb, J. K., & Barcons, X. 1998, ApJ, 498, 77
- Chen et al. (2001a) Chen, H.-W., Lanzetta, K. M. & Webb, J. K. 2001a, ApJ, 556, 158
- Chen et al. (2001b) Chen, H.-W., Lanzetta, K. M., Webb, J. K., & Barcons, X. 2001b, ApJ, 559, 654
- Chen & Mulchaey (2009) Chen, H.-W. & Mulchaey, J. S. 2009, ApJ, 701, 1219
- Chen (2012) Chen, H. W. 2012, MNRAS, 427, 1238
- Collins et al. (2003) Collins, J. A., Shull, J. M., & Giroux, M. L. 2003, ApJ, 585, 336
- Collins et al. (2004) Collins, J. A., Shull, J. M., & Giroux, M. L. 2004, ApJ, 605, 216
- Collins et al. (2005) Collins, J. A., Shull, J. M., & Giroux, M. L. 2005, ApJ, 623, 196
- Collins et al. (2007) Collins, J. A., Shull, J. M., & Giroux, M. L. 2007, ApJ, 657, 271
- Collins et al. (2009) Collins, J. A., Shull, J. M., & Giroux, M. L. 2009, ApJ, 705, 962
- Côté et al. (2012) Côté, B., Martel, H., Drissen, L., & Robert, C. 2012, MNRAS, 421, 847
- Danforth & Shull (2008) Danforth, C. W. & Shull, J. M. 2008, ApJ, 679, 194
- Danforth et al. (2010) Danforth, C. W., Keeney, B. A., Stocke, J. T., Shull, J. M., & Yao, Y. 2010, ApJ, 720, 976
- Denicoló et al. (2002) Denicoló, G., Terlevich, R., & Terlevich, E. 2002, MNRAS, 330, 69
- Ding et al. (2003) Ding, J., Charlton, J. C., Bond, N. A., Zonak, S. G., & Churchill, C. W. 2003, ApJ, 587, 551
- Ding et al. (2005) Ding, J., Charlton, J. C., & Churchill, C. W. 2005, ApJ, 621, 615
- Dixon et al. (2011) Dixon, W. V., et al. 2011, Cosmic Origins Spectrograph Instrument Handbook, Version 4.0 (Baltimore: STScI)
- Driver et al. (2005) Driver, S. P., Liske, J., Cross, N. J. G., De Propris, R., & Allen, P. D. 2005, MNRAS, 360, 81
- Driver et al. (2008) Driver, S. P., Popescu, C. C., Tuffs, R. J., et al. 2008, ApJ, 678, L101
- Ferland et al. (1998) Ferland, G. J., Korista, K. T., Verner, D. A., et al. 1998, PASP, 110, 761
- Fox et al. (2004) Fox, A. J., Savage, B. D., Wakker, B. P., et al. 2004, ApJ, 602, 738
- Fox et al. (2005) Fox, A. J., Wakker, B. P., Savage, B. D., et al. 2005, ApJ, 630, 332
- Fox et al. (2006) Fox, A. J., Savage, B. D., & Wakker, B. P. 2006, ApJS, 165, 229
- Fox et al. (2010) Fox, A. J., Wakker, B. P., Smoker, J. V., et al. 2010, ApJ, 718, 1046
- Ghavamian et al. (2009) Ghavamian, P., et al. 2009, COS Instrument Science Report 2009-01(v1), Preliminary Characterization of the Post-Launch Line Spread Function of COS (Baltimore: STScI)
- Giroux & Shull (1997) Giroux, M. L. & Shull, J. M. 1997, AJ, 113, 1505
- Green et al. (2012) Green, J. C., Froning, C. S., Osterman, S., et al. 2012, ApJ, 744, 60
- Grevesse et al. (2010) Grevesse, N., Asplund, M., Sauval, A. J., & Scott, P. 2010, Ap&SS, 328, 179
- Haardt & Madau (2012) Haardt, F. & Madau, P. 2012, ApJ, 746, 125
- Haschick & Burke (1975) Haschick, A. D. & Burke, B. F., 1975, ApJ, 200, L137
- Impey et al. (1999) Impey, C. D., Petry, C. E., & Flint, K. P. 1999, ApJ, 524, 536
- Indebetouw & Shull (2004) Indebetouw, R. & Shull, J. M. 2004, ApJ, 607, 309
- Jannuzi et al. (1998) Jannuzi, B. T., Bahcall, J. N., Bergeron, J., et al. 1998, ApJS, 118, 1
- Kacprzak et al. (2007) Kacprzak, G. G., Churchill, C. W., Steidel, C. C., Murphy, M. T., & Evans, J. L. 2007, ApJ, 662, 909
- Kacprzak et al. (2008) Kacprzak, G. G., Churchill, C. W., Steidel, C. C., & Murphy, M. T. 2008, AJ, 135, 922
- Kacprzak et al. (2010) Kacprzak, G. G., Churchill, C. W., Ceverino, D., et al. 2010, ApJ, 711, 533
- Kalberla et al. (2005) Kalberla, P. M. W., Burton, W. B., Hartmann, D., et al. 2005, A&A, 440, 775
- Keeney et al. (2005) Keeney, B. A., Momjian, E., Stocke, J. T., Carilli, C. L., & Tumlinson, J. 2005, ApJ, 622, 267
- Keeney et al. (2006a) Keeney, B. A., Danforth, C. W., Stocke, J. T., et al. 2006a, ApJ, 646, 951
- Keeney et al. (2006b) Keeney, B. A., Stocke, J. T., Rosenberg, J. L., Tumlinson, J., & York, D. G. 2006b, AJ, 132, 2496
- Keeney et al. (2012) Keeney, B. A., Danforth, C. W., Stocke, J. T., France, K., & Green, J. C. 2012, PASP, 124, 830
- Kennicutt (1998) Kennicutt, R. C., Jr. 1998, ARA&A, 36, 189
- Kennicutt et al. (2008) Kennicutt, R. C., Jr., Lee, J. C., Funes, S. J., José, G., Sakai, S., & Sanae, A. 2008, ApJS, 178, 247
- Kerr & Lynden-Bell (1986) Kerr, F. J. & Lynden-Bell, D. 1986, MNRAS, 221, 1023
- Kriss (2011) Kriss, G. A. 2011, COS Instrument Science Report 2011-01(v1), Improved Medium Resolution Line Spread Functions for COS FUV Spectra (Baltimore: STScI)
- Lanzetta et al. (1995) Lanzetta, K. M., Bowen, D. V., Tytler, D., & Webb, J. K. 1995, ApJ, 442, 538
- Lauberts (1982) Lauberts, A. 1982, ESO/Uppsala Survey of the ESO(B) Atlas, (Garching: ESO)
- Lehner et al. (2007) Lehner, N., Savage, B. D., Richter, P., et al. 2007, ApJ, 658, 680
- Lehner & Howk (2010) Lehner, N. & Howk, J. C. 2010, ApJ, 709, L138
- Lehner & Howk (2011) Lehner, N. & Howk, J. C. 2011, Science, 334, 955
- Liske et al. (2003) Liske, J., Lemon, D. J., Driver, S. P., Cross, N. J. G., & Couch, W. J. 2003, MNRAS, 344, 307
- Masters et al. (2010) Masters, K. L., Nichol, R., Bamford, S., et al. 2010, MNRAS, 404, 792
- Meyer et al. (2004) Meyer, M. J., Zwaan, M. A., Webster, R. L., et al. 2004, MNRAS, 350, 1195
- Morris et al. (1991) Morris, S. L., Weymann, R. J., Savage, B. D., & Gilliland, R. L. 1991, ApJ, 377, L21
- Morris et al. (1993) Morris, S. L., Weymann, R. J., Dressler, A., et al. 1993, ApJ, 419, 524
- Morton (2003) Morton, D. C. 2003, ApJS, 149, 205
- Narayanan et al. (2010) Narayanan, A., Wakker, B. P., Savage, B. D., et al. 2010, ApJ, 721, 960
- Osterman et al. (2011) Osterman, S., Green, J., Froning, C., et al. 2011, Ap&SS, 335, 257
- Peimbert et al. (2007) Peimbert, M., Luridiana, V., & Peimbert, A. 2007, ApJ, 666, 636
- Penton et al. (2000) Penton, S. V., Shull, J. M., & Stocke, J. T. 2000, ApJ, 544, 150
- Penton et al. (2000) Penton, S. V., Stocke, J. T., & Shull, J. M. 2000, ApJS, 130, 121
- Penton et al. (2002) Penton, S. V., Stocke, J. T., & Shull, J. M. 2002, ApJ, 565, 720
- Penton et al. (2004) Penton, S. V., Stocke, J. T., & Shull, J. M. 2004, ApJS, 152, 29
- Pettini & Pagel (2004) Pettini, M. & Pagel, B. E. J. 2004, MNRAS, 348, L59
- Prochaska et al. (2011) Prochaska, J. X., Weiner, B., Chen, H.-W., Mulchaey, J., & Cooksey, K. 2011, ApJ, 740, 91
- Putman et al. (2003) Putman, M. E., Bland-Hawthorn, J., Veilleux, S., 2003, ApJ, 597, 948
- Raimann et al. (2000) Raimann, D., Storchi-Bergmann, T., Bica, E., Melnick, J., & Schmitt, H. 2000, MNRAS, 316, 559
- Ribaudo et al. (2011) Ribaudo, J., Lehner, N., Howk, J. C., et al. 2011, ApJ, 743, 207
- Richter (2012) Richter, P. 2012, ApJ, 750, 165
- Roberts & Haynes (1994) Roberts, M. S. & Haynes, M. P. 1994, ARA&A, 32, 115
- Rosenberg et al. (2003) Rosenberg, J. L., Ganguly, R., Giroux, M. L., & Stocke, J. T. 2003, ApJ, 597, 677
- Savage & Sembach (1991) Savage, B. D. & Sembach, K. R. 1991, ApJ, 379, 245
- Savage et al. (2010) Savage, B. D., Narayanan, A., Wakker, B. P., et al. 2010, ApJ, 721, 960
- Savage et al. (2011) Savage, B. D., Narayanan, A., Lehner, N., & Wakker, B. P. 2011, ApJ, 731, 14
- Shull & Slavin (1994) Shull, J. M. & Slavin, J. D. 1994, ApJ, 427, 784
- Shull et al. (2009) Shull, J. M., Jones, J. R., Danforth, C. W., & Collins, J. A. 2009, ApJ, 699, 754
- Shull et al. (2011) Shull, J. M., Stevans, M., Danforth, C., et al. 2011, ApJ, 739, 105
- Shull et al. (2012) Shull, J. M., Smith, B. D., & Danforth, C. W. 2012, ApJ, 759, 23
- Steidel & Sargent (1992) Steidel, C. C. & Sargent, W. L. W. 1992, ApJS, 80, 1
- Steidel (1993) Steidel, C. C. 1993, in The Environment and Evolution of Galaxies, ed. J. M. Shull & H. A. Thronson (Dordrecht: Kluwer), 263
- Steidel et al. (2010) Steidel, C. C., Erb, D. K., Shapley, A. E., et al. 2010, ApJ, 717, 289
- Stinson et al. (2012) Stinson, G., Brook, C., Prochaska, J. X., et al. 2012, MNRAS, 425, 1270
- Stocke et al. (1991) Stocke, J. T., Case, J., Donahue, M., Shull, J. M., & Snow, T. P. 1991, ApJ, 374, 72
- Stocke et al. (1995) Stocke, J. T., Shull, J. M., Penton, S., Donahue, M., & Carilli, C. 1995, ApJ, 451, 24
- Stocke et al. (2004) Stocke, J. T., Keeney, B. A., McLin, K. M., et al. 2004, ApJ, 609, 94
- Stocke et al. (2006) Stocke, J. T., Penton, S. V., Danforth, C. W., et al. 2006, ApJ, 641, 217
- Stocke et al. (2007) Stocke, J. T., Danforth, C. W., Shull, J. M., Penton, S. V., & Giroux, M. L. 2007, ApJ, 671, 146
- Stocke et al. (2010) Stocke, J. T., Keeney, B. A., & Danforth, C. W. 2010, PASA, 27, 256
- Stocke et al. (2013) Stocke, J. T., Keeney, B. A., Danforth, C. W., et al. 2013, ApJ, in press (arXiv:1212.5658)
- Storchi-Bergmann et al. (1994) Storchi-Bergmann, T., Calzetti, D., & Kinney, A. L. 1994, ApJ, 429, 572
- Thom et al. (2008) Thom, C., Peek, J. E. G., Putman, M. E., et al. 2008, ApJ, 684, 364
- Thom et al. (2011) Thom, C., Werk, J. K., Tumlinson, J., et al. 2011, ApJ, 736, 1
- Tripp et al. (1998) Tripp, T. M., Lu, L., & Savage, B. D. 1998, ApJ, 508, 200
- Tripp et al. (2003) Tripp, T. M., Wakker, B. P., Jenkins, E. B., et al. 2003, AJ, 125, 3122
- Tripp et al. (2008) Tripp, T. M., Sembach, K. R., Bowen, D. V., et al. 2008, ApJS, 177, 39
- Tripp et al. (2011) Tripp, T. M., Meiring, J. D., Prochaska, J. X., et al. 2011, Science, 334, 952
- Tully et al. (2009) Tully, B. R., Rizzi, L., Shaya, E. J., et al. 2009, AJ, 138, 323
- Tumlinson et al. (2011) Tumlinson, J., Thom, C., Werk, J. K., et al. 2011, Science, 334, 948
- van de Voort & Schaye (2012) van de Voort, F. & Schaye, J. 2012, MNRAS, 423, 2991
- Wakker (2001) Wakker, B. P. 2001, ApJS, 136, 463
- Wakker et al. (2007) Wakker, B. P., York, D. G., Howk, J. C., et al. 2007, ApJ, 670, L113
- Wakker et al. (2008) Wakker, B. P., York, D. G., Wilhelm, R., et al. 2008, ApJ, 672, 298
- Wakker & Savage (2009) Wakker, B. P. & Savage, B. D. 2009, ApJS, 182, 378
- Willick et al. (1997) Willick, J. A., Courteau, S., Faber, S. M., et al. 1997, ApJS, 109, 333
- Wisotzki et al. (2000) Wisotzki, L., Christlieb, N., Bade, N., et al. 2000, A&A, 358, 77
- Yao et al. (2010) Yao, Y., Wang, Q. D., Penton, S. V., et al. 2010, ApJ, 716, 1514