Impact of metallicity on the evolution of young star clusters
Abstract
We discuss the results of body simulations of intermediate-mass young star clusters (SCs) with three different metallicities (, 0.1 and 1 Z⊙), including metallicity-dependent stellar evolution recipes and metallicity-dependent prescriptions for stellar winds and remnant formation. The initial half-mass relaxation time of the simulated young SCs ( Myr) is comparable to the lifetime of massive stars. We show that mass-loss by stellar winds influences the reversal of core collapse and the expansion of the half-mass radius. In particular, the post-collapse re-expansion of the core is weaker for metal-poor SCs than for metal-rich SCs, because the former lose less mass (through stellar winds) than the latter. As a consequence, the half-mass radius expands faster in metal-poor SCs. The difference in the half-light radius between metal-poor SCs and metal-rich SCs is (up to a factor of two) larger than the difference in the half-mass radius.
keywords:
stars: binaries: general – stars: evolution – stars: mass-loss – galaxies: star clusters: general – methods: numerical – stars: kinematics and dynamics.1 Introduction
It is well known that metallicity plays an important role in the evolution of massive stars. First, it affects directly the luminosity and effective temperature of massive stars (e.g., Hurley, Pols & Tout 2000; Tumlinson & Shull 2000; Baraffe, Heger & Woosley 2001; Bromm, Kudritzki & Loeb 2001). Secondly, the metallicity has a strong effect on the mass-loss rate by stellar winds (e.g. Kudritzki, Pauldrach & Puls 1987; Leitherer, Robert & Drissen 1992; Maeder 1992; Portinari, Chiosi & Bressan 1998; Kudritzki & Puls 2000; Vink, de Koter & Lamers 2001; Kudritzki 2002; Belkus, Van Bever & Vanbeveren 2007; Pauldrach, Vanbeveren & Hoffmann 2012). This may deeply affect the evolutionary path in the HR diagram up to the formation of the final remnant (e.g. Heger et al. 2003a; Mapelli, Colpi & Zampieri 2009a; Belczynski et al. 2010, hereafter B10). An interesting question is whether, and how much, the above effects can influence the overall evolution of star clusters (SCs).
Observations indicate that there is a trend with metallicity, at least for globular clusters (GCs). In fact, blue (i.e. generally metal-poor) GCs in the Milky Way and in some nearby galaxies tend to have a larger half-light radius (by per cent) than red (i.e. generally metal-rich) GCs (Kundu & Whitmore 1998, 2001; Kundu et al. 1999; Puzia et al. 1999; Larsen et al. 2001; Larsen, Forbes & Brodie 2001; Barmby, Holland & Huchra 2002; Harris et al. 2002; Jordán 2004; Jordán et al. 2005, 2009; Harris 2009; Woodley & Gómez 2010; Strader et al. 2012). No similar studies have been done for young SCs ( Myr) and for open clusters.
Jordán (2004) explains the difference in the half-light radii of blue and red GCs as a result of mass segregation combined with the dependence of main sequence (MS) lifetime on metallicity, by means of multimass isotropic Michie-King models. According to Jordán (2004), the observed difference in the half-light radii does not imply a difference in the half-mass radii. Recent Monte Carlo (Downing 2012) and -body (Sippel et al. 2012; see also Hurley et al. 2004) simulations of GCs confirm the results by Jordán (2004), finding that the difference in the half-light radii arises from the dependence of luminosity and stellar lifetime on metallicity. According to Downing (2012), there may be even a difference in the half-mass radii, but only as a consequence of dynamical interactions, mainly due to the presence of massive stellar black holes (BHs). Finally, Schulman, Glebbeek & Sills (2012) ran -body simulations of young intermediate-mass ( M⊙) SCs with different metallicities. They find a per cent difference also in the half-mass radius, between metal-poor SCs and metal-rich SCs.
In this paper, we discuss the results of -body simulations of young intermediate-mass SCs with different metallicity and different recipes for stellar winds and remnant formation. Our aim is to investigate the core collapse and post-collapse evolution of young intermediate-mass SCs, to better understand the interplay between dynamics, metallicity-dependent stellar evolution and formation of stellar remnants.
2 The impact of three-body encounters and stellar evolution on core collapse
The evaporation of stars from the core of a SC removes part of its kinetic energy (Spitzer 1987). Since a SC has negative heat capacity, this leads to gravothermal instability and to the collapse of the core (Binney & Tremaine 1987). Core collapse in SCs is reversed mostly by three-body encounters (i.e. close encounters between stars and binaries). In fact, binaries have a energy reservoir (their internal energy, e.g. Binney & Tremaine 1987), which can be exchanged with single stars. In particular, hard binaries (i.e. binaries with binding energy higher than the average kinetic energy of a star in the SC) tend to transfer kinetic energy to single stars as a consequence of three-body encounters (Heggie 1975). The stars that receive this kinetic energy are either ejected from the entire SC or remain in the periphery of the SC. It is worth mentioning that the more massive a binary is, the higher its expected encounter rate (e.g. Portegies Zwart 2004). Thus, the most massive binaries in the SC tend to dominate the dynamical evolution of the system (Spitzer 1987; Hurley 2007; Aarseth 2012; Hurley & Shara 2012).
It has long been debated whether mass-loss by stellar winds and/or supernovae (SNe) is efficient in affecting core collapse (e.g. Angeletti & Giannone 1977, 1980; Applegate 1986; Chernoff & Shapiro 1987; Chernoff & Weinberg 1990; Hurley et al. 2004; Schulman et al. 2012; Downing 2012; Sippel et al. 2012). In fact, stellar winds and SNe eject mass from a SC, making the central potential well shallower and quenching the onset of gravothermal instability. SCs with a broad mass-range initial mass function (IMF) undergo core collapse on a timescale , where is the half-mass relaxation timescale (e.g. Portegies Zwart & McMillan 2002). For most GCs, Gyr, whereas in young dense SCs Myr. This means that core collapse in GCs is expected to occur on a timescale (much) longer than the lifetime of massive ( M⊙) stars. Thus, the stages of core collapse and post-core collapse are expected to be barely affected by SNe and stellar winds. Instead, the timescale for core collapse in young dense SCs is expected to be of the same order of magnitude as the lifetime of massive stars. Thus, mass-loss by stellar winds and SNe peaks during the epochs of core collapse and post-core collapse. Actually, mass-loss by stellar evolution is expected to delay the core collapse (quenching the gravothermal instability) and/or to reverse more rapidly the core collapse, depending on the interplay between core collapse timescale and massive star lifetime.
Two further ingredients of this scenario are the dependence of mass-loss on stellar metallicity and the formation of stellar remnants. Stellar winds are suppressed at low metallicity (e.g. Kudritzki, Pauldrach & Puls 1987; Maeder 1992; Kudritzki & Puls 2000; Vink, de Koter & Lamers 2001). Thus, metal-rich SCs are expected to lose more mass by stellar winds than metal-poor ones.
Massive stars that end their life with mass higher than M⊙ are expected to collapse directly into BHs, with no or faint SN explosion (e.g. Fryer 1999; Fryer & Kalogera 2001). Massive metal-poor stars lose less mass by stellar winds, and thus are more likely to collapse directly into BHs. This mechanism allows to form BHs with mass higher than 25 M⊙ (e.g. Mapelli et al. 2009a; B10). If retained inside the SC, these BHs become the most massive objects in the SC after a few tens Myr, dominating the energy budget of three-body encounters.
3 Method
The simulations were done using the starlab111http://www.sns.ias.edu/starlab/ public software environment (Portegies Zwart et al. 2001; see also Portegies Zwart & Verbunt 1996; Nelemans et al. 2001; Anders et al. 2009), which allows to integrate the dynamical evolution of a SC, resolving binaries and three-body encounters. In particular, we used the modified version of starlab described in Mapelli et al. (2013, hereafter M13). This version of starlab includes recipes for the metallicity dependence of stellar radius, temperature and luminosity, using the polynomial fitting formulae by Hurley, Pols & Tout (2000). It also includes new recipes for mass-loss by winds for MS stars, based on the metallicity-dependent fitting formulae given by Vink et al. (2001; see also B10).
We added an approximate treatment for luminous blue variable (LBV) and for Wolf-Rayet (WR) stars. In particular, we assume that a post-MS star becomes a LBV when its luminosity and radius satisfy the requirement that and (Humphreys & Davidson 1994). The mass-loss rate by stellar winds for a LBV is then calculated as M⊙ yr-1, where (B10).
Naked helium giants coming from stars with zero age MS (ZAMS) mass M⊙ (e.g., van der Hucht 1991 and references therein) are labelled as WR stars in the new version of the code and undergo a mass-loss rate by stellar winds defined by M⊙ yr-1, where . This formula was first used by B10, and is a combination of the Hamann & Koesterke (1998) wind rate estimate (taking into account WR wind clumping) and Vink & de Koter (2005) wind -dependence for WR stars. Stellar winds in asymptotic giant branch (AGB) stars are modelled as in the standard version of starlab (Portegies Zwart & Verbunt 1996), i.e. the code does not include any recipes for metallicity-dependent stellar winds in AGB stars.
The formation of stellar remnants is implemented as described in M13. In particular, BH masses for various metallicities follow the distribution described in fig. 1 of M13 (see also Fryer et al. 1999; Fryer & Kalogera 2001; B10; Fryer et al. 2012). If the final mass222We call ‘final mass’, , of a star the mass bound to the star immediately before the collapse. of the progenitor star is M⊙, we assume that the SN fails and that the star collapses quietly to a BH. The requirement that M⊙ implies that only stars with ZAMS mass and M⊙, can undergo a failed SN at and 0.1 Z⊙, respectively. If M⊙, the mass of the BH is derived as , where is the final mass of the Carbon Oxygen (CO) content of the progenitor, while and are the residual mass of Helium (He) and of Hydrogen (H), respectively. is the fraction of He and H mass that collapses to the BH in the failed SN scenario. The value of is uncertain. We assume to match the maximum values of at low derived by B10. In this scenario, BHs with mass up to M⊙ ( M⊙) can form if the metallicity of the progenitor is Z⊙ ( Z⊙). BHs that form from quiet collapse are assumed to receive no natal kick (see Fryer et al. 2012). For BHs that form from a SN explosion, the natal kicks were drawn from the same distribution as neutron stars but scaled with the square root of the mass (see M13 for details).
We assume that the mass lost by stellar winds and SNe is immediately removed from the simulation. This assumption is correct for SN ejecta and also for the winds of massive stars, which are expected to move fast ( km s-1 for the O stars, e.g. Muijres et al. 2012; km s-1 for the WR stars, e.g. Vink & De Koter 2005; Martins et al. 2008) with respect to the escape velocity of the simulated SCs ( km s-1). Stellar winds by AGB stars have much smaller velocities ( km s-1, Loup et al. 1993), but still sufficiently high to escape from our simulated SCs. Furthermore, we show in Section 4 that AGB stars do not play an important role for the results presented in this paper.
3.1 Initial conditions and simulation grid
The main properties of the simulated SCs are the same as described in M13. In particular, we focus on intermediate-mass ( M⊙) young ( Myr) SCs. We assume a spherical King profile with central dimensionless potential (King 1966), initial core radius pc, concentration (where is the tidal radius). The resulting half-mass radius is pc. The basic SC properties are listed in Table 1.
| Parameter | Values |
|---|---|
| 5 | |
| 5500 | |
| (pc) | 0.4 |
| 1.03 | |
| IMF | Kroupa (2001) |
| (M⊙) | 0.1 |
| (M⊙) | 150 |
| 0.0, 0.1 | |
| 0.01, 0.1, 1.0 |
: central dimensionless potential in the King (1966) model; : number of stars per SC; : initial core radius; : concentration ( is the initial tidal radius); and : minimum and maximum simulated stellar mass, respectively; : fraction of primordial binaries, defined as the number of primordial binaries in each SC divided by the number of ‘centres of mass’ (CMs) in the SC. In each simulated SC, there are initially 5000 CMs, among which 500 are designated as ‘binaries’ and 4500 are ‘single stars’ (see Downing et al. 2010 for a description of this formalism). Thus, 1000 stars per SC are initially in binaries.
The initial centres of mass (CMs) of the particles in each simulation are 5000. Each CM corresponds either to a single star or to the CM of a binary. This formalism is commonly used in simulations of SCs including primordial binaries (e.g., Downing et al. 2010). Note that the fraction of primordial binaries is defined as the number of binaries, divided by the total number of CMs. Thus, means that there are 500 binaries over 5000 CMs (i.e. 5500 stars). The single stars and the primary members of a binary follow a Kroupa initial mass function (IMF, Kroupa 2001), with minimum and maximum mass equal to 0.1 and 150 M⊙, respectively. The masses of the secondary stars () are generated according to a uniform distribution between and (where is the mass of the primary). The initial semi-major axis of a binary is chosen from a distribution (Sigurdsson & Phinney 1993; Portegies Zwart & Verbunt 1996), consistent with the observations of binary stars in the Solar neighbourhood (e.g. Kraicheva et al. 1978; Duquennoy & Mayor 1991). We generate between R⊙ and R⊙, but discarding systems where the distance between the two stars at the pericentre is smaller than the sum of their radii (Portegies Zwart, McMillan & Makino 2007). The initial eccentricity of a binary is chosen from a thermal distribution , in the range (Heggie 1975).
The half-mass relaxation time for the simulated SCs is . Thus, the core collapse time (Portegies Zwart & McMillan 2002) is . We integrate the evolution of the SCs for the first 100 Myr, i.e. the epoch when the interplay between strong dynamical interactions and massive stellar evolution is more important. The properties of the grid of simulations are summarized in Table 2. For each SC model, we run a number of single realizations (changing only the random seeds), to filter out the fluctuations associated with each single realization and to get an ‘average’ model. Runs A1, B and C are our fiducial runs (i.e. the models described in M13) and differ only for the metallicity (, 0.1 and 1 Z⊙, respectively333In our simulations, we assume Z.). The runs labelled with A (where ) have the same metallicity ( Z⊙) as our fiducial runs A1, and differ from A1 for other parameters. In particular, (i) in A2 , (ii) in A3 the maximum allowed BH mass is M⊙, (iii) in A4 all BHs receive a natal kick km s-1 (set to an unrealistically high value to eject all BHs from the SC, for comparison with Downing 2012), and (iv) in A5 no mass-loss by stellar winds was implemented.
| Name | Z | Stellar winds | BH kick | |||
|---|---|---|---|---|---|---|
| (Z⊙) | (M⊙) | |||||
| A1 | 100 | 0.01 | YES | LOW | 0.1 | 80 |
| B | 100 | 0.1 | YES | LOW | 0.1 | 40 |
| C | 100 | 1.0 | YES | LOW | 0.1 | 23 |
| A2 | 100 | 0.01 | YES | LOW | 0.0 | 80 |
| A3 | 50 | 0.01 | YES | LOW | 0.1 | 25 |
| A4 | 22 | 0.01 | YES | HIGH | 0.1 | 80 |
| A5 | 22 | 0.01 | NO | LOW | 0.1 | 110 |
Column 1: Name of the set of runs; Column 2, : number of random realizations per each SC model; Column 3: metallicity; Column 4: YES/NO distinguishes between models in which stellar winds are/are not included; Column 5: LOW/HIGH distinguishes between models where BH natal kicks are described as in M13 (i.e., no kick is assigned to BHs with mass M⊙; whereas the natal kicks were drawn from the same distribution as neutron stars but scaled with the square root of the mass for BH masses M⊙), and models where a natal kick velocity km s-1 was assigned to all BHs (this velocity was purposely set to an unrealistically high value, to eject all BHs from the SC). Column 6, : fraction of primordial binaries; Column 7: is the maximum possible mass for BHs. Runs A1, B, C, A2 and A3 were already presented in M13.
The properties of the simulated SCs (total mass, number of stars, core density, core and half-mass radius) are consistent with the properties of observed young intermediate-mass SCs (see e.g. the recent review by Portegies, McMillan & Gieles 2010; see also Hillenbrand & Hartmann 1998; Dias et al. 2002; Portegies Zwart 2004; Pfalzner 2009; Kuhn et al. 2012). Finally, our simulations do not include recipes for the tidal field of the host galaxy. Accounting for the tidal field may increase the fraction of mass lost and even transform the SCs into unbound associations (e.g. Gieles & Portegies Zwart 2011). The effect of tidal fields will be added and discussed in forthcoming papers. In this paper, we decided not to include tidal fields because we want to look at the intrinsic properties of the simulated SCs.

4 Results
The simulated SCs have initial half-mass relaxation time and core collapse time (see the previous section). These timescales are of the same order of magnitude as the lifetime of the most massive stars. The lifetime of a 30 M⊙ star is Myr, and stellar winds are relatively inefficient for smaller stellar masses (excluding the AGB phase). Thus, the most intense phase of mass-loss by stellar winds coincides with the collapse and re-expansion of the SC core: thus, the effects of stellar winds on the structural properties of the SC should be maximal in our simulations.
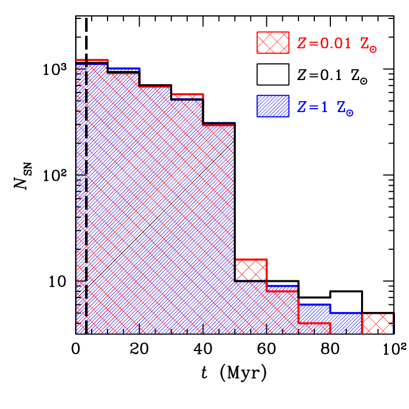
Core-collapse SNe span a longer time-range with respect to stellar winds. Fig. 1 shows that the rate of SNe is maximum at Myr, remains quite high up to Myr, and drops at Myr. The few SNe at Myr involve blue straggler stars (BSSs), which are the result of either mass transfer or a merger between two MS stars (e.g. Mapelli et al. 2004, 2006, 2009b). For , the number of SN explosions involving BSSs is per SC (regardless of the metallicity), corresponding to a mass-loss of M⊙ per SC. Since the total mass-loss in the time interval between 50 and 100 Myr is per cent of the initial total mass of the SC (), i.e. M⊙ per SC, the mass lost through SN explosions of BSSs is negligible. Thus, after Myr, the evolution of the core is dominated by three-body interactions and stellar winds of AGB stars.
For comparison, most GCs have half-mass relaxation timescales and core collapse timescales that are a factor of longer (e.g. Portegies Zwart 2004; Portegies Zwart, McMillan & Gieles 2010), indicating that the peak of stellar wind activity and that of SN explosions ended well before the beginning of the core instability phase.
4.1 Metallicity dependence
Fig. 2 shows the cumulative mass lost by the SC (because of both stellar winds and SNe), as a function of time, for runs A1, B and C. The effect of different metallicities is maximum between 1 and 4 Myr, when the mass lost at Z⊙ is up to 100 and 10 times higher than the mass lost at Z⊙ and Z⊙, respectively. The mass lost in these early phases of the SC life is a relatively small fraction () of the total SC mass, but is large when compared to the core mass (which is ). As the most massive stars already sank to the core through dynamical friction by the time of core collapse, the effect of early mass-loss is particularly strong in the SC core. For example, at Myr the mass-loss is per cent of the core mass at Z⊙, and only per cent at Z⊙.
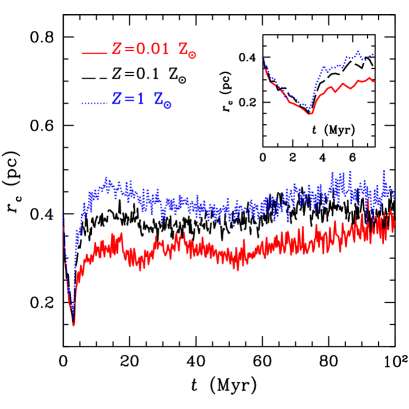
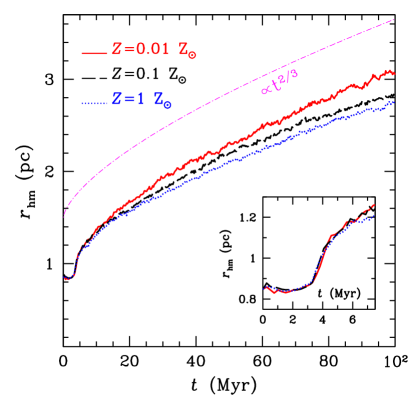
Fig. 3 shows the behaviour of the core radius as a function of time for runs A1, B and C (i.e. for the three considered metallicities). The collapse is so fast ( Myr) that it occurs almost at the same time for all the considered metallicities. The effect of metallicity in Fig. 3 appears immediately after the collapse, during the first phase of re-expansion: the core radius in metal-rich SCs expands more than in metal-poor SCs, as mass-loss by stellar winds in metal-rich SCs removes more matter from the core potential well. At Myr, the mass-loss by stellar winds is nearly over, but the differences among core radii at different metallicity remain almost constant up to Myr.
The contribution of SN explosions lasts for a longer time ( Myr, Fig. 1). In our models, the mass-loss by SN explosions does not depend on metallicity. The only important effect of metallicity on SNe is that failed SNe can take place only at low metallicity ( Z⊙). All the failed SNe occur at Myr (dashed line in Fig. 1), as only the most massive stars (see Section 3) can undergo a failed SN. Thus, the occurrence of failed SNe in low-metallicity SCs enhances the difference between metal-rich and metal-poor SCs, in the early phase of core-collapse reversal.
At times Myr, even the mass-loss by SNe is over: the only process that may affect significantly the later evolution of the core radius is represented by three-body encounters. The differences between metal-rich and metal-poor SCs tend to be quenched at late times.
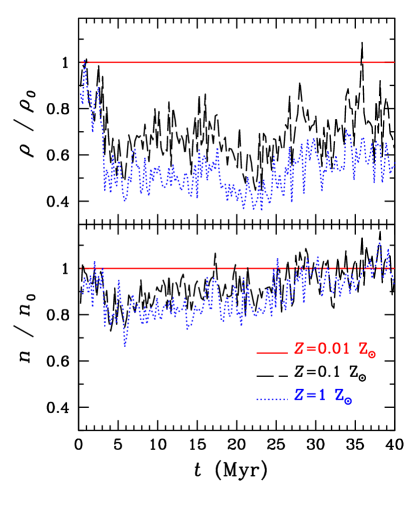
The half-mass radius (Fig. 4) remains almost constant during core collapse (as expected, e.g. Elson, Hut & Inagaki 1987), while it starts increasing after the reverse of the core collapse. The behaviour of () is in agreement with simple analytical predictions (e.g. Elson et al. 1987). The post-core collapse value of for metal-poor SCs is systematically larger than that for metal-rich SCs, in agreement with Schulman et al. (2012). The reason is that the reversal of core-collapse is slower for metal-poor SCs. This implies that metal-poor SCs maintain a higher core density in the late core-collapse phase and in the early core-collapse reversal (see Fig. 5 for the evolution of core stellar density444The core mass (number) density of stars was approximated as the total mass (number) of stars in the core divided by .). Since the rate of three-body encounters scales approximately with the stellar mass density (e.g. Sigurdsson & Phinney 1993), metal-poor SCs have a higher rate of three-body encounters than metal-rich SCs. Three-body encounters pump kinetic energy in the SC halo (mainly in the form of stars ejected in the outskirts of the SC), and are responsible for the expansion of (e.g., Elson et al. 1987).
The difference at Myr between the averaged of Z⊙ SCs and that of Z⊙ SCs is per cent, surprisingly similar to the difference observed between red and blue GCs. On the other hand, we stress that the evolution of our simulated young SCs is very different from the evolution of GCs.
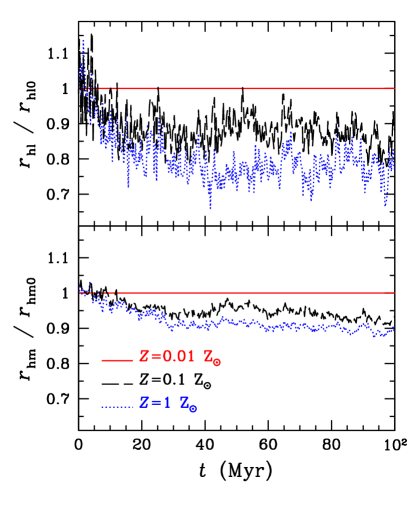
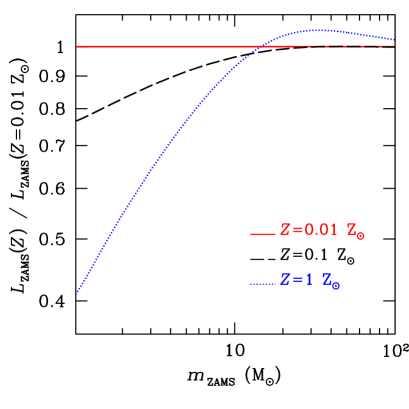
Fig. 6 shows that the difference among the half-light radii at different metallicity is larger ( per cent, although with larger fluctuations) than the difference among the half-mass radii. This results from the combination between mass segregation, and the metallicity dependence of the adopted stellar luminosity function. In our simulated SCs, mass segregation is very efficient, as shown by the fact that the core collapse occurs on a timescale shorter than the half-mass relaxation timescale (i.e., it is driven by dynamical friction, e.g. Portegies Zwart 2004). Thus, the region inside the core radius is dominated by massive stars and remnants, while most low-mass stars are in the outer regions.
According to the fitting formulae by Hurley et al. (2000), a solar metallicity MS star with mass M⊙ is fainter than a sub-solar metallicity MS star with the same mass. This is apparent from Fig. 7, where we compare the ZAMS luminosity () for stars with different metallicity. A similar difference persists during the entire MS. Because of this difference in the luminosity function, and because our simulated SCs are mass-segregated, the light distribution tends to be more concentrated in metal-rich SCs than in metal-poor SCs.
4.2 Other effects related to stellar evolution
In this section, we estimate the impact on core collapse and post-core collapse phases of other effects connected with stellar evolution, including stellar remnants. To maximize the contribution of BHs to the reverse of core collapse, we consider SCs with Z⊙, where the BH mass can be as high as M⊙.
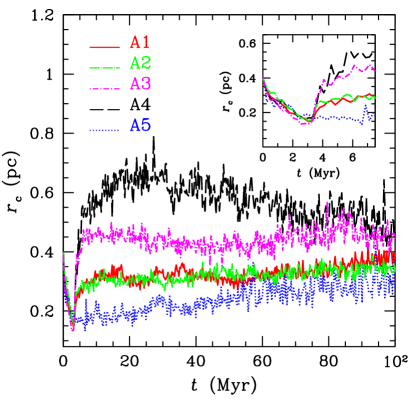
The comparison between runs A1 (with ) and A2 (with ) shows that the existence of primordial binaries has almost no effect on both the core radius (Fig. 8) and the half-mass radius (Fig. 9). In fact, the very hard binaries needed to reverse the core collapse form by 3-body capture during the collapse phase even in the runs.
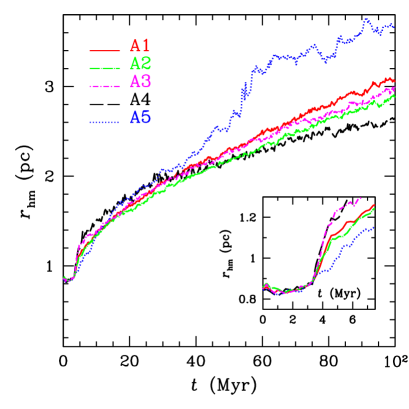
The difference between runs A1 and A3 is the maximum mass of BHs: 80 and 25 M⊙ for runs A1 and A3, respectively. This difference was achieved by ejecting impulsively a large fraction of the stellar mass at the time of BH formation in runs A3. Thus, the core radius in runs A3 increases much faster than that in runs A1 because of this sudden mass-loss (Fig 8). On the other hand, the half-mass radius (Fig 9) increases initially faster in runs A3 than in runs A1, but then slows down, because of the lower core density and because of the absence of massive BHs. In fact, massive BH binaries have a larger cross-section for three-body encounters, have (on average) a larger reservoir of internal energy and, thus, are more efficient in ejecting stars after three-body encounters (e.g. Downing 2012).
A similar but stronger trend can be observed by comparing runs A1 and A4. In runs A4 all BHs are removed from the simulation at birth, by assigning to them a natal kick of km s-1. Immediately after core collapse, the core radius (Fig 8) and the half-mass radius (Fig 9) in runs A4 become significantly larger than in runs A1. In fact, the mass of all the BHs is completely lost from the potential well of the SC. On the other hand, the removal of all the BHs implies that less energy can be exchanged via three-body encounters. For this reason, the increase of the half-mass radius slows down at Myr.
Finally, runs A5 represent the most extreme case, where mass-loss by stellar winds is switched off and the maximum BH mass is M⊙ (the only difference between the BH mass and the ZAMS mass of the progenitor star comes from the recipes for the direct collapse of the star into a BH, see Section 3). If mass-loss is switched off, the core collapse is much more dramatic: it lasts for Myr before that three-body encounters can reverse it (Fig 8). The half-mass radius (Fig 9) expands dramatically after core collapse, because of the amount of energy pumped into the halo by three-body encounters.
5 Conclusions
In this paper, we discussed the effects of metallicity on the core collapse and post-core collapse phase in young intermediate-mass SCs. This was done by means of -body simulations including recipes for metallicity-dependent stellar evolution, stellar winds and formation of stellar remnants.
In the simulated SCs, core collapse is almost coincident with the peak of mass-loss by stellar winds. Metal-rich SCs lose more mass by stellar winds than metal-poor SCs: the reversal of core collapse is faster and stronger in the former with respect to the latter. On the other hand, the difference in the core radius among metal-rich and metal-poor SCs decreases as soon as mass losses by massive stars are over. In the later stages of SC life, the core evolution is ruled mainly by three-body encounters.
Since the reversal of core collapse is slower in metal-poor SCs, the half-mass radius expands more in metal-poor SCs than in metal-rich SCs. The maximum difference among the half-mass radii of and Z⊙ SCs is per cent. When considering the half-light radii rather than the half-mass radii, the difference at late times is larger ( per cent). This is a consequence of the metallicity dependence of the adopted stellar luminosity function.
We also checked the effects of other aspects of stellar evolution. When stellar winds are completely suppressed, the core collapse phase lasts much longer and the half-mass radius in the post-core collapse phase can be even 20 per cent larger than in the fiducial model for the same metallicity. If all the BHs are ejected by natal kick, the core initially expands faster because of the impulsive mass-loss, but all the massive binaries are lost from the SC, quenching the effects of three-body encounters.
In the last few years, young SCs were at the centre of important observational campaigns (e.g. Bica et al. 2003; Mercer et al. 2005; Borissova et al. 2011; Bianchi et al. 2012; Richards et al. 2012; see Portegies Zwart et al. 2010 for a recent review), and are one of the main targets of the ongoing Gaia ESO survey (Gilmore et al. 2012). Thus, comparing the predictions of our simulations with the current and forthcoming data about metallicity and half-light radii of young SCs will give new insights on the formation and dynamical evolution of SCs.
Acknowledgments
We thank the referee, Peter Anders, for his comments that improved the manuscript. We made use of the public software package starlab (version 4.4.4) and of the SAPPORO library (Gaburov, Harfst & Portegies Zwart 2009) to run starlab on graphics processing units (GPUs). We acknowledge all the developers of starlab, and especially its primary authors: Piet Hut, Steve McMillan, Jun Makino, and Simon Portegies Zwart. We thank the authors of SAPPORO, and in particular E. Gaburov, S. Harfst and S. Portegies Zwart. We also thank Emanuele Ripamonti, Luca Zampieri, Marica Branchesi, Paola Marigo, Alessia Gualandris, Antonella Vallenari and Rosanna Sordo for stimulating discussions. We acknowledge the CINECA Award N. HP10B3BJEW, HP10CLI3BX, HP10CXB7O8 and HP10C894X7, 2011 for the availability of high performance computing resources and support. MM acknowledges financial support from INAF through grant PRIN-2011-1. AB acknowledges financial support from MIUR through grant PRIN-2009-1. MM thanks the Aspen Center for Physics, where part of this work was done.
References
- [1] Aarseth S. J., 2012, MNRAS, 422, 841
- [2] Anders P., Baumgardt H., Bissantz N., Portegies Zwart S., 2009, MNRAS, 395, 2304
- [3] Angeletti L., Giannone P., 1977, A&A, 58, 363
- [4] Angeletti L., Giannone P., 1980, A&A, 85, 113
- [5] Applegate J. H., 1986, ApJ, 301, 132
- [6] Baraffe I., Heger A., Woosley S. E., 2001, ApJ, 550, 890
- [7] Barmby P., Holland S., Huchra J. P., 2002, AJ, 123, 1937
- [8] Belczynski K., Bulik T., Fryer C. L., Ruiter A., Valsecchi F., Vink J. S., Hurley J. R., 2010, ApJ, 714, 1217 (B10)
- [9] Belkus H., Van Bever J., Vanbeveren D. 2007, ApJ, 659, 1576
- [10] Bianchi L., Efremova B., Hodge P., Kang Y., 2012, AJ, 144, 142
- [11] Bica E., Dutra C. M., Soares J., Barbuy B., 2003, A&A, 404, 223
- [12] Binney J., Tremaine S., 1987, Galactic Dynamics. Princeton Univ. Press, Princeton , NJ
- [13] Borissova J., et al., 2011, A&A, 532A, 131
- [14] Bromm V., Kudritzki R. P., Loeb A., 2001, ApJ, 552, 464
- [15] Chernoff D. F., Shapiro S. L., 1987, ApJ, 322, 113
- [16] Chernoff D. F., Weinberg M. D., 1990, ApJ, 351, 121
- [17] Dias W. S., Alessi B. S., Moitinho A., Lépine J. R. D., 2002, A&A, 389, 871
- [18] Downing J. M. B., Benacquista M. J., Giersz M., Spurzem R., 2010, MNRAS, 407, 1946
- [19] Downing J. M. B., 2012, MNRAS, 425, 2234
- [20] Duquennoy A., & Mayor M., 1991, A&A, 248, 485
- [21] Elson R., Hut P., Inagaki Sh., 1987, ARA&A, 25, 565
- [22] Fryer Ch. L., 1999, ApJ, 522, 413
- [23] Fryer Ch. L., Kalogera V., 2001, ApJ, 554, 548
- [24] Fryer Ch. L., Belczynski K., Wiktorowicz G., Dominik M., Kalogera V., Holz D. E., 2012, ApJ, 749, 91
- [25] Gaburov E., Harfst S., Portegies Zwart S., 2009, New Astronomy, 14, 630
- [26] Gieles M., Portegies Zwart S. F., 2011, MNRAS, 410, L6
- [27] Gilmore G., 2012, The Messenger, 147, 25
- [28] Hamann W.-R., Koesterke L., 1998, A&A, 335, 1003
- [29] Harris W. E., Harris G. L. H., Holland S. T., McLaughlin D. E., 2002, AJ, 124, 1435
- [30] Harris W. E., 2009, ApJ, 703, 939
- [31] Heger A., Fryer C.L., Woosley S.E., Langer N., Hartmann D.H., 2003a, ApJ, 591, 288
- [32] Heggie D. C., 1975, MNRAS, 173, 729
- [33] Hillenbrand L. A., Hartmann L. W., 1998, ApJ, 492, 540
- [34] Humphreys R. M., Davidson K., 1994, Astronomical Society of the Pacific, Publications, 106, 1025
- [35] Hurley J. R., Pols O. R., Tout C. A., 2000, MNRAS, 315, 543
- [36] Hurley J. R., Tout C. A., Aarseth S. J., Pols O. R., 2004, MNRAS, 355, 1207
- [37] Hurley J. R., 2007, MNRAS, 379, 93
- [38] Hurley J. R., Shara M. M., 2012, MNRAS, 425, 2872
- [39] Jordán A., 2004, ApJ, 613, L117
- [40] Jordán A., et al., 2005, ApJ, 634, 1002
- [41] Jordán A., et al., 2009, ApJS, 180, 54
- [42] King I. R., 1966, AJ, 71, 64
- [43] Kraicheva Z. T., Popova E. I., Tutukov A. V., Iungelson L. R., 1978, Astronomicheskii Zhurnal, 55, 1176
- [44] Kroupa P., 2001, MNRAS, 322, 231
- [45] Kudritzki R. P., Pauldrach A., Puls J., 1987, A&A, 173, 293
- [46] Kudritzki R.-P., Puls J., 2000, ARA&A, 38, 613
- [47] Kudritzki R. P., 2002, ApJ, 577, 389
- [48] Kuhn M. A., Baddeley A., Feigelson E. D., Getman K. V., Broos P. S., Townsley L. K., Povich M. S., Naylor T., King R. R., Busk H. A., Luhman K. L., 2012, arXiv:1208.3492, to appear in The Labyrinth of Star Formation, (eds.) D. Stamatellos, S. Goodwin, and D. Ward-Thompson, Springer, in press
- [49] Kundu A., Whitmore B. C., 1998, AJ, 116, 2841
- [50] Kundu A., Whitmore B. C., 2001, AJ, 121, 2950
- [51] Kundu A., Whitmore B. C., Sparks W. B., Macchetto F. D., Zepf S. E., Ashman K. M., 1999, ApJ, 513, 733
- [52] Larsen S. S., Brodie J. P., Huchra J. P., Forbes D. A., Grillmair C. J., 2001, AJ, 121, 2974
- [53] Larsen S. S., Forbes D. A., Brodie J. P., 2001, MNRAS, 327, 1116
- [54] Leitherer C., Robert C., Drissen L., 1992, ApJ, 401, 596
- [55] Loup C., Forveille T., Omont A., Paul J. F., 1993, Astronomy and Astrophysics Supplement Series, 99, 291
- [56] Maeder A., 1992, A&A, 264, 105 (M92)
- [57] Mapelli M., Sigurdsson S., Colpi M., Ferraro F. R., Possenti A., Rood R. T., Sills A., Beccari G., 2004, ApJ, 605L, 29
- [58] Mapelli M., Sigurdsson S., Ferraro F. R., Colpi M., Possenti A., Lanzoni B., 2006, MNRAS, 373, 361
- [59] Mapelli M., Colpi M., Zampieri L., 2009a, MNRAS, 395L, 71
- [60] Mapelli M., Ripamonti E., Battaglia G., Tolstoy E., Irwin M. J., Moore B., Sigurdsson S., 2009b, MNRAS, 396, 1771
- [61] Mapelli M., Zampieri L., Ripamonti E., Bressan A., 2013, MNRAS, in press, arXiv1211.6441M (M13)
- [62] Martins F., Hillier D. J., Paumard T., Eisenhauer F., Ott T., Genzel R., 2008, A&A, 478, 219
- [63] Mercer E. P., et al., 2005, ApJ, 635, 560
- [64] Muijres L., Vink J. S., de Koter A., Hirschi R., Langer N., Yoon S.-C., 2012, A&A, 546, 42
- [65] Nelemans G., Yungelson L. R., Portegies Zwart S. F., Verbunt F., 2001, A&A, 365, 491
- [66] Pauldrach A. W. A., Vanbeveren D., Hoffmann T. L. 2012,A&A, 538, 75
- [67] Pfalzner S., 2009, A&A, 498, L37
- [68] Portegies Zwart S. F., Verbunt F., 1996, A&A, 309, 179
- [69] Portegies Zwart S. F., McMillan S. L. W., Hut P., Makino J., 2001, MNRAS, 321, 199
- [70] Portegies Zwart S. F., McMillan S. L. W., 2002, ApJ, 576, 899
- [71] Portegies Zwart S. F., 2004, arXiv:astro-ph/0406550, Lecture note to appear in “Joint Evolution of Black Holes and Galaxies” of the Series in High Energy Physics, Cosmology and Gravitation. IOP Publishing, Bristol and Philadelphia, 2005, eds M. Colpi, V.Gorini, F.Haardt and U.Moschella
- [72] Portegies Zwart S. F., McMillan S. L. W., Makino J., 2007, MNRAS, 374, 95
- [73] Portegies Zwart S. F., McMillan S. L. W.,, Gieles M., 2010, ARA&A, 48, 431
- [74] Portinari L., Chiosi C., Bressan A., 1998, A&A, 334, 505
- [75] Puzia Th. H., Kissler-Patig M., Brodie J. P., Huchra J. P., 1999, AJ, 118, 2734
- [76] Richards E. E., Lang C. C., Trombley Ch., Figer D. F., 2012, AJ, 144, 89
- [77] Schulman R. D., Glebbeek V., Sills A., 2012, MNRAS, 420, 651
- [78] Sigurdsson S., Phinney E. S., 1993, ApJ, 415, 631
- [79] Sippel A. C., Hurley J. R., Madrid J. P., Harris W. E., 2012, MNRAS, 427, 167
- [80] Spitzer L., 1987 Dynamical evolution of globular clusters, Princeton University Press
- [81] Strader J., Fabbiano G., Luo B., Kim D.-W., Brodie J. P., Fragos T., Gallagher J. S., Kalogera V., King A., Zezas A., 2012, ApJ, 760, 87
- [82] Tumlinson J., Shull J. M., 2000, ApJ, 528, L65
- [83] van der Hucht K. A., 1991, in ‘Wolf-Rayet Stars and Interrelations with Other Massive Stars in Galaxies’: Proceedings of the 143rd Symposium of the International Astronomical Union. Edited by Karel A. van der Hucht and Bambang Hidayat. International Astronomical Union. Symposium no. 143, Kluwer Academic Publishers, Dordrecht, p.19
- [84] Vink J. S., de Koter A., Lamers H. J. G. L. M. , 2001, A&A, 369, 574
- [85] Vink J. S., de Koter A., 2005, A&A, 442, 587
- [86] Woodley K. A., Gómez M., 2010, Publications of the Astronomical Society of Australia, 27, 379