Concurrent Supermassive Black Hole and Galaxy Growth: Linking Environment and Nuclear Activity in = 2.23 H Emitters
Abstract
We present results from a 100 ks Chandra observation of the 2QZ Cluster 1004+00 structure at (hereafter, 2QZ Clus). 2QZ Clus was originally identified as an overdensity of four optically-selected QSOs at within a arcmin2 region. Narrow-band imaging in the near-IR (within the band) revealed that the structure contains an additional overdensity of 22 H-emitting galaxies (HAEs), resulting in 23 unique HAEs/QSOs (22 within the Chandra field of view). Our Chandra observations reveal that 3 HAEs in addition to the 4 QSOs harbor powerfully accreting supermassive black holes (SMBHs), with 2–10 keV luminosities of (8–60) ergs s-1 and X-ray spectral slopes consistent with unobscured AGN. Using a large comparison sample of 210 HAEs in the Chandra-COSMOS field (C-COSMOS), we find suggestive evidence that the AGN fraction increases with local HAE galaxy density. The 2QZ Clus HAEs reside in a moderately overdense environment (a factor of 2 times over the field), and after excluding optically-selected QSOs, we find the AGN fraction is a factor of times higher than C-COSMOS HAEs in similar environments. Using stacking analyses of the Chandra data and Herschel SPIRE observations at 250m, we respectively estimate mean SMBH accretion rates () and star-formation rates (SFRs) for the 2QZ Clus and C-COSMOS samples. We find that the mean 2QZ Clus HAE stacked X-ray luminosity is QSO-like ( [6–10] ergs s-1), and the implied /SFR (1.6–3.2) is broadly consistent with the local / relation and X-ray selected AGN. In contrast, the C-COSMOS HAEs are on average an order of magnitude less X-ray luminous and have /SFR (0.2–0.4) , somewhat lower than the local / relation, but comparable to that found for 1–2 star-forming galaxies with similar mean X-ray luminosities. We estimate that a periodic QSO phase with duty cycle 2–8% would be sufficient to bring star-forming galaxies onto the local / relation. This duty cycle is broadly consistent with the observed C-COSMOS HAE AGN fraction (0.4–2.3%) for powerful AGN with ergs s-1. Future observations of 2QZ Clus will be needed to identify key factors responsible for driving the mutual growth of the SMBHs and galaxies.
Subject headings:
cosmology: observations — early universe — galaxies: active — galaxies: clusters: general — surveys — X-rays:general1. Introduction
Successful theoretical models characterizing the formation and growth history of galaxies and supermassive black holes (SMBHs) generally require that feedback from active galactic nuclei (AGN) play a crucial role in regulating the growth of galaxy bulges (e.g., De Lucia et al. 2005; Bower et al. 2006, 2008; Croton et al. 2006; Fanidakis et al. 2012), leading to the local - and – relations (e.g., Bennert et al. 2011). AGN feedback processes are predicted to be most important in the most massive elliptical galaxies formed within the most massive dark-matter halos. However, in the local universe, these same elliptical galaxies contain the oldest stellar populations and the most dormant SMBHs in terms of their specific mass accretion rates. Mass accretion in these systems is likely limited by the presence of a hot interstellar medium and periodic mechanical feedback from radio powerful AGN (e.g., Best et al. 2005; McNamara & Nulsen 2012). Therefore, directly observing the growth of these systems requires challenging observations of very distant precursors to today’s ellipticals. From models of large-scale structure formation, it is predicted that growth of modern ellipticals takes place in high-density regions at 2–3 (e.g., Kauffmann et al. 1996; Governato et al. 1998; Volonteri et al. 2003; De Lucia et al. 2006).
Thus far, efforts to observe the distant 2–3 galaxy protoclusters SSA22 and HS1700+64, likely pre-cursors to rich local clusters like Coma (e.g., Steidel et al. 1998, 2005), have revealed that the AGN fraction is a factor of 2–16 times larger (1 statistical range) in the protocluster environment compared with the low-density field (e.g., Lehmer et al. 2009a,b; Digby-North et al. 2010). This contrasts with local galaxy clusters, which contain lower AGN fractions in their cores (e.g., Martini et al. 2009; Ehlert et al. 2012). The enhanced SMBH growth rate in the protocluster environment is likely linked to the presence of larger gas reservoirs being fed onto more massive galaxies (e.g., Steidel et al. 2005) and SMBHs, as well as an increase in mergers before the cluster becomes virialized. These structures are therefore ideal for observing and characterizing the interdependent processes involved in the growth of the most massive SMBHs and galaxies, and follow-up studies of protocluster AGN have revealed interesting first results. For example, in the SSA22 protocluster at , many of the AGN are found to be coincident with large-scale (100 kpc) Lyman- emitting nebulae (Geach et al. 2009) that may be indicative of emission-line gas being powered by AGN.
| Position (J2000) | Net Counts | Exposure (ks) | Count-Rate (10-4 cnts s-1) | ||||||||
|---|---|---|---|---|---|---|---|---|---|---|---|
| Source ID | FB | SB | HB | FB | SB | HB | FB | SB | HB | ||
| (1) | (2) | (3) | (4)–(6) | (7)–(9) | (10)–(12) | (13) | (14) | (15) | (16)–(18) | (19)–(21) | (22)–(24) |
| 1 | 10 03 00.7 | +00 10 54.1 | 16.4 | 20.2 | 26.0 | 53.5 | 47.7 | 77.2 | 2.2 | 4.5 | 3.7 |
| 2……………… | 10 03 00.8 | +00 11 25.1 | 42.2 | 21.9 | 36.3 | 24.6 | 21.9 | 35.8 | 25.0 | 13.2 | 10.8 |
| 3 | 10 03 05.9 | +00 09 49.2 | 67.3 | 15.5 | 66.8 | 61.7 | 57.1 | 80.5 | 11.3 | 2.8 | 8.8 |
| 4 | 10 03 09.2 | +00 11 31.1 | 24.7 | 14.4 | 22.4 | 71.6 | 68.7 | 83.3 | 3.4 | 2.1 | 2.8 |
| 5 | 10 03 09.3 | +00 12 24.3 | 64.2 | 27.8 | 38.3 | 69.5 | 66.1 | 83.0 | 9.2 | 4.2 | 4.6 |
| 6 | 10 03 09.6 | +00 09 01.1 | 68.9 | 54.5 | 21.8 | 46.0 | 42.5 | 60.3 | 15.1 | 13.2 | 3.6 |
| 7 | 10 03 09.8 | +00 13 12.9 | 14.0 | 14.3 | 19.7 | 65.9 | 61.8 | 82.6 | 2.0 | 2.3 | 2.4 |
| 8 | 10 03 13.1 | +00 13 05.1 | 57.7 | 29.0 | 30.4 | 74.5 | 71.9 | 84.6 | 7.9 | 4.1 | 3.6 |
| 9 | 10 03 13.2 | +00 10 26.8 | 41.9 | 21.6 | 20.1 | 76.3 | 74.1 | 85.1 | 5.5 | 2.9 | 2.4 |
| 10 | 10 03 13.9 | +00 12 17.5 | 13.7 | 11.3 | 15.6 | 78.7 | 77.0 | 85.9 | 1.7 | 1.5 | 1.9 |
NOTE.—[A portion of Table 1 is shown here to illustrate content. All 133 rows and 28 columns are provided in the electronic version.] Col.(1): Chandra source ID for 2QZ Clus field. Col.(2) and (3): Right ascension () and declination (), respectively. Right ascension is quoted in units of degrees, minutes, seconds. Declination is quoted in degrees, arcminutes, and arcseconds. Col.(4)–(12): Net counts () and upper/lower bounds, computed following 2.2, for FB, SB, and HB. Col.(13)–(15): Vignetting-corrected effective exposure times (in kiloseconds) for FB, SB, and HB, respectively. Col.(16)–(24): Vignetting corrected count-rates and upper/lower bounds, computed following the methods described in 2.2, for FB, SB, and HB. Col.(25)–(27): X-ray flux in units of ergs cm-2 s-1 for the FB, SB, and HB, respectively. Col.(28): Notes related to source (“M” = Manual photometry required due to image edge; “H” = Coincident with HAE; “Q” = Coincident with optically identified QSO).
To expand upon our efforts to understand AGN activity in the high-density environment at high redshift, we have performed Chandra observations of an overdensity of actively star-forming galaxies and optically-selected QSOs at : the 2QZ Cluster 1004+00 structure (hereafter, 2QZ Clus). 2QZ Clus was discovered by Matsuda et al. (2011) by first searching the 2dF QSO Redshift Survey (2QZ; Croom et al. 2001, 2004) and identifying an overdensity of quasars within the redshift interval 2.216–2.248, corresponding to the H line in the UKIRT WFCAM H2S1 filter, and then performing narrow and broad band near-infrared imaging (via the H2S1 m and -band filters) to identify star-forming active galaxies at via the H emission line. The redshift range of the H line corresponding to the 50% transmission wavelengths of the H2S1 band is –2.248. These H emitters (HAEs) therefore have both redshift identifications and H-based measures of their star-formation rates (SFRs). Matsuda et al. (2011) revealed that the 2QZ Clus field contains an overdensity of 22 vigorous star-forming HAEs (H-based SFR 14 yr-1 without any correction for extinction) in a arcmin2 region ( comoving Mpc2). These observations probe the tip of the iceberg of the actively star-forming 2QZ Clus galaxy population with additional contributions from luminous AGN. Identification of the lower-SFR and H-obscured population is still needed to fully characterize the large-scale nature of this structure.
In this paper, we present first results from the Chandra observations of 2QZ Clus. In 2, we discuss our analysis methods and provide reduced data products, including images, exposure maps, and point-source catalogs. In 3, we present the properties of the X-ray detected sources in the 2QZ Clus structure, and compare these with an equivalent unbiased sample of HAEs found in the COSMOS survey field from the High- Emission Line Survey (HiZELS; Geach et al. 2008; Sobral et al. 2009). In 4, we compare the relative growth rates of 2QZ Clus SMBHs and galaxies. We further discuss the nature of the 2QZ Clus structure itself and put the AGN activity into the context of the broader population of HAEs found in COSMOS. Finally, in 5, we summarize our results.
The Galactic column densities for 2QZ Clus and COSMOS are cm-2 and cm-2, respectively. All of the X-ray fluxes and luminosities quoted throughout this paper have been corrected for Galactic absorption. In the X-ray band, we make use of three bandpasses: 0.5–2 keV (soft band [SB]), 2–7 keV (hard band [HB]), and 0.5–7 keV (full band [FB]). Values of = 70 km s-1 Mpc-1, = 0.3, and = 0.7 are adopted throughout this paper (e.g., Spergel et al. 2003).
2. Observations, reduction, and analysis
Throughout this paper we will be comparing the SMBH growth among HAEs in the 2QZ Clus structure with HAEs in the COSMOS field. To do this effectively, we designed our Chandra observations of 2QZ Clus to be of comparable depth and quality as the Chandra data products that are already available from the Chandra COSMOS survey (C-COSMOS; Elvis et al. 2009; Puccetti et al. 2009; Civano et al. 2012). Therefore the Chandra analysis that follows has been customized to produce catalogs and data products that can be directly compared with those available from C-COSMOS.
2.1. Data Reduction
We obtained a 100 ks Chandra exposure consisting of a single ACIS-I pointing (Chandra Obs-ID 13976; taken over the 13th and 14th of January 2012; PI: B.D. Lehmer) centered on the 2QZ Clus region surveyed by Matsuda et al. (2011; see Fig. 1).111Note that during the observation, the ACIS-S3 chip was on; however, due to its large off-axis angle and non-coincidence with any sources in the 2QZ Clus field, we chose to exclude data from the ACIS-S3 CCD. The observation was centered on the aim point coordinates 10:03:43.3 and 00:13:26.47 and was oriented at a roll angle that was 56.9 deg from north. The total duration of the observation was 99.6 ks. For our data reductions, we made use of CIAO v. 4.4 with CALDB v4.5.0. We began by reprocessing our events lists, bringing level 1 to level 2 using the script chandra_repro. The chandra_repro script runs a variety of CIAO tools that identify and remove events from bad pixels and columns, and filter the events list to include only good time intervals without significant flares and non-cosmic ray events corresponding to the standard ASCA grade set (ASCA grades 0, 2, 3, 4, 6).
Using the reprocessed level 2 events list, we constructed a first FB image and a point-spread function (PSF) map (using the tool mkpsfmap), which corresponded to a monochromatic energy at 1.497 keV and an encircled counts fraction (ECF) set to 0.393. We constructed an initial source catalog by searching our FB image with wavdetect (run with our PSF map), which was set at a conservative false-positive probability threshold of and run over seven scales from 1–8 (using a sequence: 1, , 2, 2, 4, 4, and 8). To sensitively measure whether any significant flares remained in our observations, we constructed point-source-excluded 0.5–7 keV background light curves for the observation in a variety of time bins (spanning 10–800 s bins). We found no evidence of any significant (5 ) flaring events throughout the observation, and therefore considered our reprocessed level 2 events file to be sufficiently cleaned.
Next, using the initial X-ray source catalog and an optical mag source catalog from the Sloan Digital Sky Survey Data Release 6 (SDSS-DR6; Adelman-McCarthy et al. 2008), we registered our aspect solution and events list to the SDSS-DR6 frame using CIAO tools reproject_aspect and reproject_events, respectively. The resulting astrometric reprojections gave very small astrometric adjustments, including linear translations of pixels and pixels, a rotation of deg, and a pixel scale stretch factor of 1.00018.
2.2. Point-Source Catalog Production
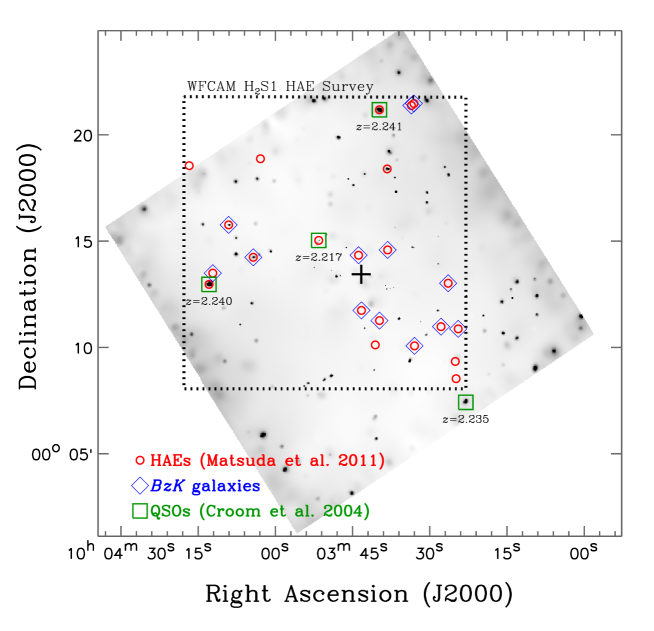
Using the reprojected aspect solution and events file (see 2.1), we constructed standard-band images, 90% ECF PSF maps (corresponding to 1.497 keV, 4.51 keV, and 2.3 keV for the SB, HB, and FB, respectively), and exposure maps in the three standard bands. The exposure maps were constructed following the basic procedure outlined in 3.2 of Hornschemeier et al. (2001); these maps were normalized to the effective exposures of sources located at the aim points. This procedure takes into account the effects of vignetting, gaps between the CCDs, bad column and pixel filtering, and the spatially dependent degradation of the ACIS optical blocking filter. A photon index of was assumed in creating the exposure maps. In Figure 1, we show the adaptively-smoothed FB image and the locations of HAEs and QSOs that are associated with the 2QZ Clus structure. The image was smoothed using csmooth and was “flattened” by dividing the smoothed image by a smoothed exposure map.
We constructed a Chandra source catalog by (1) searching the three standard-band images using wavdetect (including the appropriate 90% ECF PSF and exposure maps) at false-positive probability threshold of (the equivalent detection threshold adopted by Elvis et al. 2009 in the C-COSMOS field); and (2) adjoining the three bandpass catalogs using cross-band matching radii of 2.5 arcsec and 4.0 arcsec for sources with off-axis angles of 6 arcmin and 6 arcmin, respectively. Through this procedure, we identified a total of 133 unique X-ray detected sources in the 2QZ Clus field. These 133 sources constitute our main Chandra catalog (see Table 1).
We performed aperture photometry for our 133 sources in each of the three standard bands. For each X-ray source, we extracted source plus background counts and exposure-map values using circular apertures with radii corresponding to the 90% ECF, which were determined using the corresponding PSF-map value at the source location. We visually inspected these regions and found that only two source-pairs had very minor overlaps in the HB PSF (and no overlaps in the smaller SB and FB PSFs). The overlapping regions of these source pairs contained 1 HB counts; therefore, we did not perform any corrections to the photometry for these sources.
For each source, local background counts and exposure values were then extracted from each of the three bandpasses. This was achieved by creating images and exposure maps with all sources masked out of circular masking regions of radius 1.5 times the size of the 95% encircled energy fraction (estimated using each local PSF). Using these masked data products, we then extracted background counts and exposure values from a larger background extraction square aperture that was centered on the source. The size of the background extraction square varied with each source and was chosen to contain 30–100 background counts in all bands. For each bandpass, net source counts were computed following , where is the ECF appropriate for the source extraction region and bandpass. We computed 1 level Poisson errors on the net counts following the methods described in Gehrels (1986).
To calculate vignetting-corrected count-rates, we made use of count-rate maps, which were constructed by dividing the images by the exposure maps. The advantage of count-rate maps is that they allow for an accurate accounting of the source intensity when gradients in the exposure are present in a source extraction region (e.g., near chip gaps, image edges, and bad pixels). We made use of the same source and background regions described above to extract on-source count-rates and background count-rates . Net count-rates were then computed following , where and are the source and background extraction areas that contain exposure.
For each source, we converted our vignetting-corrected count-rates to fluxes using conversion factors of [1.18, 0.659, and 1.96] ergs cm-2 s-1 (cnts s-1)-1 for the FB, SB, and HB, respectively. These factors assume a power-law SED with that is corrected for Galactic extinction. In Table 1, we provide the basic X-ray properties of the 133 main-catalog sources in the 2QZ Clus field. The survey reaches ultimate 5-count sensitivity limits of 6.0 ergs cm-2 s-1, 3.4 ergs cm-2 s-1, 1.0 ergs cm-2 s-1 for the FB, SB, and HB, respectively; at , these limits allow for the detection of a source with rest-frame 2–10 keV luminosity ergs s-1. These limits are nicely compatible with those achieved by the C-COSMOS survey, which reaches a factor of 1.4–1.7 times deeper in ultimate sensitivity (Elvis et al. 2009).
| Position (J2000) | Count Rate (10-4 cnts s-1) | |||||||||
| XID | SB | HB | (ergs cm-2 s-1) | (ergs s-1) | (ergs cm-2 s-1) | (ergs s-1) | Notes | |||
| (1) | (2) | (3) | (4) | (5) | (6) | (7) | (8) | (9) | (10) | (11) |
| 2QZ Clus | ||||||||||
| 10 03 23.0 | +00 07 25.0 | 17 | 15.1 1.8 | 7.3 1.2 | 0.48 0.20 | 13.6 | 44.7 | … | … | QSO |
| 10 03 38.3 | +00 18 23.8 | 49 | 13.0 1.6 | 10.9 1.5 | 0.84 0.18 | 13.5 | 44.7 | 15.3 | 43.3 | |
| 10 03 39.8 | +00 21 10.8 | 58 | 14.6 1.8 | 8.5 1.4 | 0.58 0.21 | 13.6 | 44.7 | 14.8 | 43.7 | QSO |
| 10 03 51.6 | +00 15 02.1 | 96 | 3.0 1.1 | 1.2 | 0.40 | 14.5 | 43.8 | 15.2 | 43.4 | QSO |
| 10 04 04.3 | +00 14 14.4 | 118 | 8.7 1.3 | 5.0 1.0 | 0.58 0.25 | 13.8 | 44.5 | 16.3 | 42.3 | |
| 10 04 09.1 | +00 15 45.9 | 126 | 2.7 0.8 | 2.0 | 0.75 | 14.4 | 43.9 | 16.2 | 42.3 | |
| 10 04 12.9 | +00 12 57.9 | 129 | 21.3 1.9 | 10.9 1.4 | 0.51 0.16 | 13.4 | 44.8 | 14.7 | 43.9 | QSO |
| C-COSMOS | ||||||||||
| 09 58 54.6 | +02 14 03.6 | 864 | 2.3 0.6 | 5.2 0.9 | 2.26 0.30 | 14.0 | 44.2 | 16.2 | 42.4 | |
| 10 00 02.6 | +02 19 58.7 | 774 | 0.7 0.2 | 1.3 0.3 | 1.94 0.41 | 14.6 | 43.7 | 15.6 | 43.0 | |
| 10 00 26.6 | +01 58 23.0 | 716 | 0.6 0.3 | 1.3 0.4 | 2.32 0.56 | 14.6 | 43.7 | 15.9 | 42.7 | |
| 10 00 44.2 | +02 02 06.9 | 1456 | 0.5 | 1.1 0.3 | 2.04 | 14.8 | 43.5 | 16.0 | 42.6 | |
| 10 00 55.4 | +01 59 55.4 | 1486 | 0.6 | 0.8 0.3 | 1.40 | 14.9 | 43.4 | 16.1 | 42.5 | |
| 10 00 55.4 | +02 33 30.1 | 1386 | 2.8 0.6 | 2.6 | 0.93 | 14.4 | 43.9 | 15.8 | 42.8 | |
| 10 00 57.5 | +02 33 45.2 | 929 | 2.7 0.6 | 1.4 | 0.52 | 14.4 | 43.8 | 15.7 | 42.9 | |
| 10 01 15.2 | +01 57 13.3 | 1105 | 1.5 0.3 | 1.9 | 1.27 | 14.7 | 43.6 | 16.2 | 42.4 | |
| 10 01 29.9 | +02 17 04.1 | 1261 | 0.5 0.2 | 1.7 | 3.21 | 15.1 | 43.2 | 15.1 | 43.5 | |
| 10 01 53.5 | +02 11 51.6 | 451 | 18.0 1.4 | 4.0 0.7 | 0.22 0.19 | 13.5 | 44.7 | 16.0 | 42.6 | |
NOTE.—Col.(1) and (2): Optical/near-IR right ascension () and declination (), respectively. Right ascension is quoted in units of degrees, minutes, seconds. Declination is quoted in degrees, arcminutes, and arcseconds. Col.(3): X-ray catalog ID (XID). For sources in the 2QZ Clus field, the XID is from this work (see Table 1), and for the C-COSMOS sources, the XID is from Elvis et al. (2009). Col.(4) and (5): Count-rate for the SB and HB, respectively, in units of cnts s-1. Col.(6): Count-rate ratio between the 2–7 keV and 0.5–2 keV bands. Col.(7): Logarithm of the 0.5–7 keV source flux in ergs cm-2 s-1. Col.(8): Logarithm of the rest-frame 2–10 keV luminosity in units of ergs s-1. Luminosities were calculated assuming each source is at . Col.(9) and (10): Logarithm of the H source flux (in ergs cm-2 s-1) and luminosity (in ergs s-1), respectively, as provided by Matsuda et al. (2011) for the 2QZ Clus field and Sobral et al. (2012) for the C-COSMOS field. Col.(11): Notes on X-ray detected sources.
3. Results
3.1. AGN Activity within 2QZ Clus Structure
To measure the AGN activity in the 2QZ Clus structure at , we made use of the catalog of 22 HAEs from Matsuda et al. (2011) and four known QSOs. After accounting for overlap in the HAE/QSO populations, there are a total of 23 unique source candidates (see Fig. 1). The one QSO that does not have an HAE counterpart lies outside the footprint of the narrow-band survey and is likely to be an HAE itself based on its selection from optical emission lines. In the HAE survey, Matsuda et al. (2011) selected candidate sources that satisfied the following criteria: (1) H2S1 (EW Å) and (2) the H flux excess significance (i.e., the ratio between H2S1 excess and the uncertainty in the H2S1 color) . The narrow-band imaging reaches a H2S1 depth of 19.9 mag (AB). This selection is inherently subject to minor (at 10–20% level) contamination from Pa emitters at , Pa emitters at , and [O III]5007 emitters at ; however, for many cases we can make use of and colors (i.e., the criteria) to constrain the redshifts to –2.5 and rule-out such contaminants. The criteria includes ()() or () (Daddi et al. 2004). From Matsuda et al. (2011), 17 out of the 23 are either spectroscopically confirmed 2QZ Clus structure member QSOs or satisfy the criteria (see Fig. 1). Interestingly, the three QSOs with , , photometry do not satisfy the selection criteria, indicating that AGN-dominated SEDs can be missed by these criteria. This is likely due to the presence of strong emission lines, and indeed the three QSOs lie only 0.1–0.2 mag away from the selection line (see Fig. 3 of Matsuda et al. 2011).
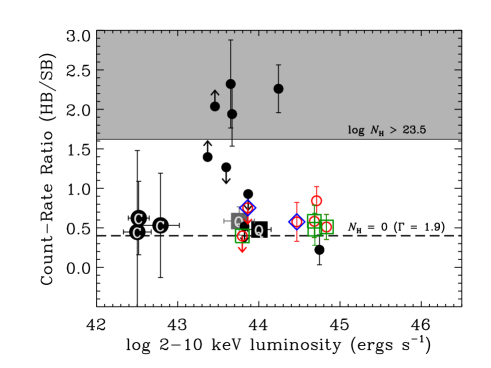
One HAE of the 23 sources is located outside of the Chandra field of view. We matched the remaining 22 sources (21 HAEs and four QSOs) to our 2QZ Clus Chandra catalog using a 25 matching radius (see annotations in Fig. 1). Given the HAE and X-ray source densities, we estimate that this choice of matching radius will lead to a negligible number of random associations (i.e., a total of 0.02 false-matches expected). We find a total of 7 matches, giving an initial AGN fraction of % (1 intervals based on Gehrels 1986). Four of the seven X-ray detected sources are the optically-identified QSOs that were used to originally select the 2QZ Clus for study (see Matsuda et al. 2011 for details); therefore, three additional AGN are identified here as a result of our Chandra observations. If we exclude the four pre-selected QSOs, the AGN fraction of the underlying HAE population is %. Six of the 7 X-ray detected sources are either spectroscopically confirmed 2QZ Clus member QSOs or galaxies and are unlikely to be interlopers. The one HAE (XID = 49) that does not satisfy either criteria is inferred to be very luminous and may have an AGN-dominated SED that does not satisfy the criteria (similar to the other known QSOs); however, we cannot rule out the possibility that this source is a low-redshift interloper. In Figure 2, we show the HB-to-SB count-rate ratio versus 2–10 keV luminosity for X-ray-detected HAEs and QSOs in the 2QZ Clus field, and in Table 2, we list the properties of these sources. These seven X-ray sources have HB-to-SB count-rate ratios and X-ray luminosities that are consistent with powerful unobscured QSOs.
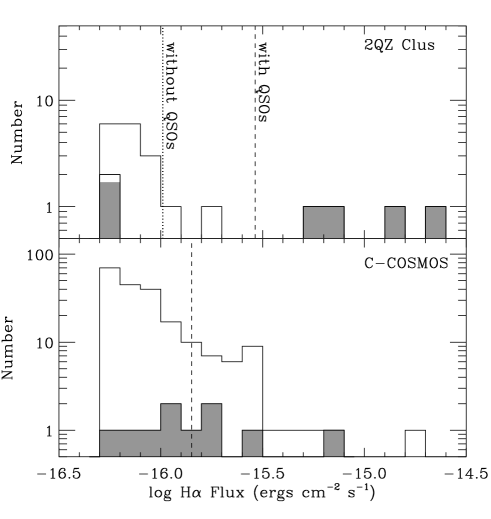
In Figure 3, we show the distributions of H fluxes for the 2QZ Clus HAEs and highlight the subset of HAEs with X-ray detections. We find that the AGN occupy the bright-end of the H flux distribution ( ergs cm-2 s-1), indicating (not surprisingly) that the AGN themselves have a dominant contribution to the intensity of the H emission lines in these systems. The mean H flux of the 2QZ Clus sample overall appears to be higher than any of the non-AGN HAEs, indicating that the bulk of the H power from the 2QZ Clus population is likely to be from AGN. However, once the pre-selected QSOs are removed, the mean H flux of the 2QZ Clus sample is within the range of the star-forming galaxies. A K-S test reveals that both the 2QZ Clus and C-COSMOS H flux distributions are consistent with each other whether or not pre-selected QSOs are included.
3.2. Comparison with C-COSMOS
One of our key goals is to compare the AGN activity of HAEs in the 2QZ Clus structure with that of HAE field samples. As described in 1, the 2QZ Clus structure was initially selected as an overdensity of QSOs, and therefore represents a region biased toward both active SMBH mass accretion and galaxy stellar growth. To put into broader context the AGN activity in the 2QZ Clus structure, we make use of an independent sample of 2.216–2.248 HAEs from HiZELS in the wide-area 1.6 deg2 COSMOS survey field (Sobral et al. 2012; see also, Geach et al. 2012). The HiZELS HAEs were selected using the same telescopes, cameras, and filters as used for the 2QZ Clus HAE selection; however, unlike 2QZ Clus, the COSMOS field was not selected to have any QSO overdensity at . In total there are 353 HAE candidates with ergs cm-2 s-1 (complete at the 90% level) that satisfy the criteria used to select the 2QZ Clus HAEs (i.e., H2S1 ; H2S1 mag). In this selection, we do not remove non- galaxies for fair comparisons with 2QZ Clus HAEs and to avoid AGN being removed (see discussion in 3.1 regarding 2QZ Clus QSOs that do not satisfy selection). As such, our selection is somewhat more liberal than the final selection of galaxies presented in Sobral et al. (2012), which do include a filtering (slightly modified), together with another color-color selection (), high quality photometric redshifts, and information on double/triple line emitters (see Sobral et al. 2012 for details).
Of the 353 HiZELS HAEs, 210 overlap with the footprint of the Chandra-COSMOS survey (C-COSMOS; Elvis et al. 2009; Puccetti et al. 2009). C-COSMOS is a contiguous 0.92 deg2 Chandra survey that reaches 70–180 ks depths (vignetting-corrected) across 84% of the surveyed area. The combination of the HiZELS HAE and C-COSMOS surveys therefore constitutes a powerful data set by which direct comparisons can be made with the 2QZ Clus data. We made use of the technique to make a first-order assessment of the contamination fraction for our HAE sample. Of these 210 HAEs, we found that 160 had , , and photometry that would allow for a redshift assessment. Of these 160 HAEs, 132 (83%) have colors satisfying the color selection. We note that this fraction is larger than that reported by Sobral et al. (2012) for the full HAE sample. The difference here is that we have limited our analysis to the relatively bright HAEs in the HiZELS sample, which has a lower contamination fraction. Furthermore, the fraction for our HAEs is consistent with that found for the 2QZ Clus HAE sample. We have tested the effects of excluding all non- HAEs from our samples and find that this choice has an insignificant impact on the results presented throughout this paper.
Using a matching radius of arcsec, we obtain a total of 10 Chandra sources matched to the 210 HiZELS HAEs that were within the C-COSMOS footprint, giving an initial AGN fraction of %; a factor of times lower than the initial 2QZ Clus AGN fraction of . Given the QSO pre-selection in the 2QZ Clus field, this difference in AGN fraction may not be so surprising. When we exclude the four pre-selected QSOs from our computation, we find the 2QZ Clus AGN fraction is % (i.e., 3 AGN out of 18 HAEs); still a factor of times higher than the HiZELS AGN fraction. If we assume that the C-COSMOS HAE AGN fraction is representative of the HAE population in general, we estimate that the binomial probability of detecting 3 or more AGN out of 18 HAEs is 6%.
In Figure 2, we show the count-rate ratio vs. 2–10 keV luminosity for the HiZELS HAEs that are X-ray detected in C-COSMOS. The HiZELS HAEs host an almost equal blend of moderately obscured ( cm2) and unobscured AGN as measured by their band ratios. This appears to differ somewhat from the “softer” AGN found in 2QZ Clus (see Fig. 2). If we assume that the 50% ratio of obscured to unobscured AGN in the C-COSMOS HAEs is typical of HAEs, then the probability of finding all three uniquely X-ray selected AGN (i.e., excluding the four pre-selected QSOs) in 2QZ Clus to be unobscured is 25%. We therefore do not conclude that the differences between the X-ray spectral slopes in 2QZ Clus HAEs are significantly different from those of C-COSMOS HAEs. In Figure 3, we display the H flux distribution of the C-COSMOS HAEs and highlight the subset that are X-ray AGN. In contrast to 2QZ Clus HAEs, we find that the mean C-COSMOS HAE flux is within the distribution of non-AGN HAEs, indicating that the total H power output is likely dominated by the star-forming galaxy population.
| SFR | |||||||||
|---|---|---|---|---|---|---|---|---|---|
| Sample | (ergs s-1) | ( yr-1) | (mJy) | ( yr-1) | |||||
| (1) | (2) | (3) | (4) | (5) | (6) | (7) | (8) | (9) | (10) |
| C-COSMOS Low Density ………… | 0.38 0.38 | 61 | 2 | 0.03 | 0.62 0.47 | 42.52 0.13 | 11 4 | 3.9 1.6 | 68 29 |
| Medium Density | 0.38 0.38 | 122 | 5 | 0.04 | 0.53 0.66 | 42.79 0.23 | 21 15 | 3.4 0.6 | 60 10 |
| High Density | 1.12 0.38 | 27 | 3 | 0.11 | 0.45 1.03 | 42.50 0.17 | 11 5 | 2.3 | 42 |
| 2QZ Clus including QSOs | 0.31 0.10 | 21 | 6 | 0.29 | 0.48 0.10 | 44.01 0.14 | 362 142 | 6.0 2.6 | 111 73 |
| excluding QSOs | 0.31 0.10 | 18 | 3 | 0.17 | 0.59 0.18 | 43.76 0.19 | 204 110 | 3.6 1.3 | 63 23 |
NOTE.—Col.(1): Description of HAE sample being stacked. Col.(2): HAE source overdensity, , computed as the ratio of the local HAE source density to mean HAE density across the entire HiZELS COSMOS survey area (Sobral et al. 2012). For the shallower 2QZ Clus HAE sample, we computed using bright HAEs in both the 2QZ Clus and HiZELS COSMOS fields (see 4 for details). Col.(3): Number of galaxies in the relevant stacking sample. This number reflects exclusion of HAEs that were outside the C-COSMOS footprint, as well as sources that were in the near vicinity (within 15 arcsec) of unrelated X-ray detected sources. Col.(4): Number of sources that were detected in the X-ray band. Due to the relatively high survey luminosity limits for , these sources are expected to be AGN. Col.(5): AGN fraction of sample. Col.(6): Ratio of stacked 2–7 keV to 0.5–2 keV count-rates . Col.(7): Logarithm of the mean 2–10 keV luminosity calculated using the stacked 0.5–2 keV emission. Col.(8): Estimate of the mean BH accretion rate based on the X-ray luminosity (see 4 for details and assumptions). Col.(9): Mean 250m flux in mJy based on stacking analyses. Col.(10): Mean SFR based on 250m flux (see 4.2).
4. Discussion
The above analyses indicate that the 2QZ Clus HAEs contain an enhanced AGN fraction compared to HAEs found in the C-COSMOS field. Here we discuss the possible circumstances surrounding the enhanced SMBH growth in the 2QZ Clus structure. We further put into context the mutual SMBH and galaxy growth of 2QZ Clus and C-COSMOS HAEs.
4.1. Environment as a Driver of Galaxy and SMBH Growth
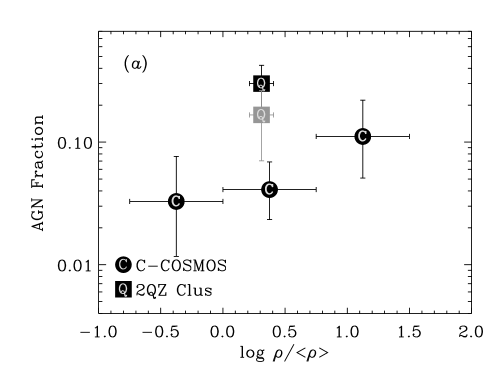
To assess the role that environment plays in driving SMBH accretion in the HAE population, we made use of the wide-area HiZELS HAEs in the C-COSMOS survey to estimate AGN fraction as a function of source density. For the broader HiZELS HAE sample (i.e., the 1.6 deg2 sample), we measured local HAE overdensities for each source following , where is the separation between a given source and its fourth nearest neighbor and is the mean HAE source density over the entire HiZELS COSMOS field. Since the HiZELS COSMOS field has wider aerial coverage than the subpopulation of HAEs that lie within the C-COSMOS footprint, we expect that should provide a good estimate of the local source environment for all C-COSMOS sources without suffering from uncertainties due to survey edge effects. Focusing on only the HAEs that were within the C-COSMOS footprint, we divided the sample into three bins of source overdensity, [, 0.35, 1.12] . For each bin, we computed the fraction of HAEs hosting luminous AGN detected in the X-ray band. Figure 4 shows the AGN fraction as a function of overdensity for the C-COSMOS sources, and in Table 4 we tabulate the AGN fractions of each subset. We find suggestive evidence for an increase in AGN fraction with local HAE source density, such that the . A similar trend was noted for Lyman- emitters in the SSA22 protocluster (Lehmer et al. 2009a).
Given that the 2QZ Clus HAE survey is somewhat shallower and less complete than the HiZELS COSMOS HAE survey, we cannot directly compute the equivalent HAE source density all the way down to the H flux limit. Therefore, to estimate an average for all sources in 2QZ Clus, we computed the survey-wide 2QZ Clus HAE source density of a highly complete (90%) subsample using only relatively bright HAEs ( ergs cm-2 s-1), and then compared this with the source density of relatively bright COSMOS HiZELS HAEs. The relative bright-source densities indicate that the 2QZ Clus HAEs have on average . This value is somewhat higher than, although consistent with, the value found by Matsuda et al. (2011) when comparing the 2QZ Clus HAEs with a smaller HAE control sample. We note that the relatively small area in 2QZ Clus limits us from effectively measuring the local densities of each galaxy in the way we did for the HiZELS HAEs. A wider area HAE survey of the 2QZ Clus structure would mitigate this limitation. In Figure 4, we highlight the AGN fraction of the 2QZ Clus HAEs, both including and excluding HAEs that were pre-selected to be QSOs. After excluding the pre-selected QSOs, we find that the 2QZ Clus AGN fraction is a factor of times higher than the AGN fraction of C-COSMOS HAEs in similarly overdense environments.
From the above analyses, it appears as though the enhanced AGN fraction in the 2QZ Clus cannot be explained by an enhanced source density. However, given that the HAE source selection is limited to the detection of sources with high-SFR (SFR yr-1) or AGN activity, it may be possible that there are large numbers of 2QZ Clus galaxies that are lower SFR and/or high H extinction leading to an inaccurate characterization of the local source environment. For this to explain the relatively large AGN fraction in terms of environment would require that the underlying galaxy population in 2QZ Clus be very different from that of C-COSMOS. Future observations sensitive to these galaxy populations would be needed to address this.
If we assume that the enhanced AGN fraction in the 2QZ Clus structure is due solely to the biased QSO-based selection and that our estimates of the local source overdensities are representative of the true environments in which the galaxies are found, we can assess how rarely we should find such elevated AGN fractions. From our analysis of the C-COSMOS HAEs, we know that the probability of an HAE hosting an AGN in an environment like that of 2QZ Clus is 4%. Assuming this incidence fraction is representative of the broader HAE population, we used the binomial probability distribution to compute the rarity of finding AGN fraction enhancements like those of 2QZ Clus. We find that the probability of detecting 3 or more AGN in 18 HAEs (i.e., after removing pre-selected QSOs) is 4.1%. This suggests that there is likely to be something inherently “special” about the 2QZ Clus region; perhaps some unaccounted for physical mechanism is responsible for the enhanced AGN activity that is unique to 2QZ Clus. It is also possible that the elevated AGN fraction is a product of the presence of more massive host galaxies and SMBHs. For example, Xue et al. (2010) found that the AGN fraction increases rapidly with stellar mass. From their AGN fraction versus stellar mass relations for luminous AGN (see Fig. 14B of Xue et al. 2010), we infer that the 2QZ Clus galaxies would have to be on-average a factor of 5–8 times more massive than the C-COSMOS galaxy population to explain the enhanced AGN fraction that is observed. The 2QZ Clus and C-COSMOS HAEs were selected at the same SFR limits and have similar mean SFRs (see below). Since SFR is in general correlated with stellar mass, with a dispersion of a factor of 2 (e.g., Elbaz et al. 2007; Salim et al. 2007), it is unlikely that the mean stellar masses of the HAEs in 2QZ Clus would be 5–8 times higher on-average than those in C-COSMOS. Better characterization of the 2QZ Clus HAE source properties, large-scale environment, and underlying non-HAE galaxy population will help us understand this. This could be achieved via HST WFC3 infrared observations of the HAE population and/or spectroscopic follow-up of BX/BM and galaxy candidates.
4.2. Relative SMBH and Galaxy Growth Rates
To estimate the mean SMBH growth rates of 2QZ Clus and C-COSMOS HAEs, we performed X-ray stacking following the techniques described in Lehmer et al. (2008), with errors measured as 1 intervals of bootstrap resampling (see, e.g., Basu-Zych et al. 2012 for details). In 2QZ Clus, we stacked the total HAE samples both including and excluding the pre-selected QSOs. For C-COSMOS, we stacked each of the three subsamples that were divided based on source density (see 4.1). In Table 3, we tabulate our stacking results for the five subsamples. We find that the stacked 2–10 keV luminosities range from 42.5–44, indicating that AGN clearly dominate the mean stacked X-ray emission over normal galaxy emission by more than an order of magnitude for galaxies of similar SFRs and redshifts (e.g., Lehmer et al. 2010; Basu-Zych et al. 2012). In all cases the 2–7 keV/0.5–2 keV count-rate ratios indicate the mean stacked spectrum is consistent with unobscured AGN (see Fig. 2 and Col. 6 in Table 3). We converted our mean 2–10 keV luminosities into bolometric luminosities using a correction factor of 22.4, which corresponds to the median bolometric correction for local AGN with – ergs s-1 (Vasudevan & Fabian 2007). We then estimated the mean SMBH accretion rates following , where is the speed of light and is the efficiency by which accreting mass is converted into radiative energy; here we assume (see, e.g., Marconi et al. 2004 for motivation). These assumptions yield mean mass accretion rates spanning 0.01–0.02 yr-1 for the C-COSMOS HAE samples and 0.2–0.4 yr-1 for the 2QZ Clus HAE samples (see Col. 8 in Table 3).
The above X-ray stacking shows that the mean SMBH accretion rates of 2QZ Clus HAEs are significantly larger than those of C-COSMOS HAEs; however, we want to test whether the corresponding SFRs of the HAEs are on average consistent with that expected from the local relation. Although the H emission line provides an immediate proxy for the star-formation rate (SFR), H is often subject to extinction in starburst galaxies like those studied here (e.g., Calzetti et al. 1997). Furthermore, in the case of QSOs, the H emission line fluxes from the AGN will overwhelm any signal related to star-formation activity, making it difficult to infer directly the SFRs of these sources (see, e.g., Fig. 3).
To remedy these issues, we have made use of Herschel observations at 250m using the Spectral and Photometric Imaging Receiver (SPIRE). Herschel SPIRE data are available in the C-COSMOS field via the HerMES campaign (Oliver et al. 2012) and in the 2QZ Clus field through a GO program (PI: Matsuda; Matsuda et al. 2013, in-preparation). These data allow us to probe emission from the rest-frame 80 m, which is well beyond the peak of the expected dust-emission associated with QSOs (6–15 m; e.g., Efstathiou & Rowan-Robinson 1995; Netzer et al. 2007; Hatziminaoglou et al. 2010; Mullaney et al. 2011). We therefore anticipate that SPIRE probes the cool dust emission associated with star-formation activity, and the total SFR can be measured using these data. We performed SPIRE stacking of the three C-COSMOS and two 2QZ Clus samples described in Table 3 following the techniques detailed in Harrison et al. (2012). We obtained significant signal in the 250m stacks for all samples except for the highest overdensity C-COSMOS subsample (see Table 3). Errors on mean SPIRE flux represent the largest 1 interval based on bootstrap resampling (see Harrison et al. 2012 for details). We converted 250m fluxes to (8–1000 m) using the SED library of Chary & Elbaz (2001), selecting a SED (redshifted to ) on the basis of the total monochromatic luminosity probed by the 250m emission. We converted the infrared luminosities to SFRs following SFR/( yr-1) . This conversion assumes negligible contributions from UV emission and is appropriate for a Kroupa (2001) IMF (see eqn. 1 of Bell et al. 2005). The mean SFRs are reported in Column 10 of Table 3.
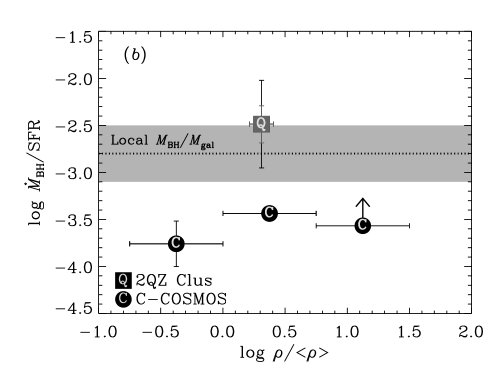
From the above X-ray and infrared stacking analyses, we obtain mean /SFR ratios for our samples. In Fig 4, we display /SFR versus overdensity () for these samples. We find that the 2QZ Clus HAEs have /SFR 3.2 , similar to the mean ratio at (e.g., Häring & Rix 2004; Bennert et al. 2011). For the C-COSMOS HAE subsamples, we find much lower values of /SFR (0.2–0.4) . Such a deficit in SMBH-to-galaxy growth rate ratio may be due to the SFR-biased selection of C-COSMOS HAEs, which has constrained our analysis to include only powerful star-forming galaxies with extinction uncorrected H-based SFR yr-1.
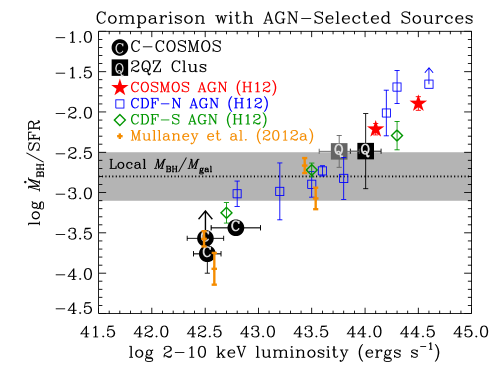
Recent Herschel SPIRE analyses of X-ray selected AGN in the CDF-N, CDF-S, and COSMOS fields have shown that on average the mean SFR increases with mean AGN luminosity; however, there is some debate as to whether the most powerful QSOs with ergs s-1 have declining SFRs (e.g., Harrison et al. 2012; Page et al. 2012). In the left panel of Figure 5, we compare the 2QZ Clus and C-COSMOS HAE /SFR values with those of X-ray selected AGN presented in Harrison et al. (2012) and 1–3 AGN from Mullaney et al. (2012a). X-ray luminosities have been converted to following the techniques discussed above and SFRs have been converted to be consistent with our choice of Kroupa (2001) IMF. It is apparent that the mean /SFR for X-ray selected AGN appears to be consistent with the local relation (Häring & Rix 2004) for AGN with ergs s-1. At higher , increases dramatically. The 2QZ Clus HAE samples have /SFR vs. mean values in good agreement with the trends observed for the Harrison et al. (2012) X-ray selected AGN (see Fig. 5). As discussed above, the C-COSMOS HAEs appear to have somewhat lower /SFR values below that expected from the local relation; however, these values appear to be consistent with those of the low-luminosity X-ray selected AGN from Mullaney et al. (2012a). Given that the mean SFRs and masses of all the AGN samples shown in the left-panel of Figure 5 are relatively high (SFR 10–100 yr-1 and ), this trend suggests that SMBHs and galaxies do not grow simultaneously.
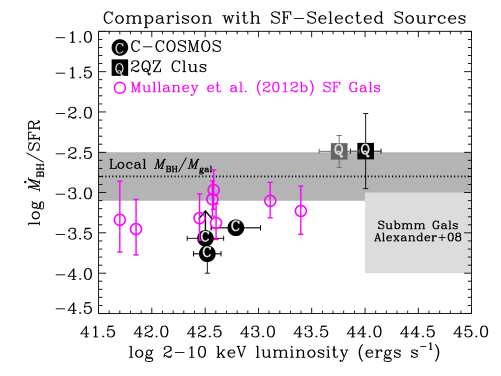
In the right-panel of Figure 5, we compare the 2QZ Clus and C-COSMOS HAE /SFR values with those of 1–2 star-forming galaxies (Mullaney et al. 2012b). We find that the C-COSMOS HAEs have /SFR in good agreement with field 1–2 star-forming galaxies, which appear to also agree with submillimeter galaxies studied by Alexander et al. (2008). These values appear to lie a factor of 3 below the local . We note, that the various assumptions (e.g., bolometric correction and accretion efficiency) and unknown uncertainties used in our calculations may contribute to systematic offsets in /SFR. However, if our findings are correct, typical star-forming galaxies must undergo vigorous SMBH growth in short duty cycles, where /SFR is above the local ratio. If the QSO phase at ergs s-1 is responsible for such episodic growth, we can use our observations to estimate the QSO duty cycle required to bring star-forming galaxies onto the relation:
| (1) |
where is the fraction of time that a galaxy is in a QSO phase. Taking –, (/SFR), and (/SFR), we find 2–8%. For C-COSMOS HAEs, we estimate that the QSO fraction for ergs s-1 AGN is 1.0%. This value and our duty-cycle estimate of are consistent within errors, indicating that the short-term SMBH growth in a QSO phase may be sufficient to bring the typical HAE up to the relation. This is consistent with the observation that the majority of SMBH growth density (using X-ray emissivity as a proxy) in the Universe at can be attributed to luminous AGN ( ergs s-1; e.g., Hasinger et al. 2005); a significant fraction of this population is expected to be fueled by mergers (30–40%; e.g., Treister et al. 2012). We note that none of the luminous AGN among the C-COSMOS HAEs fell within the observational footprint of the HST WFC3 IR-imaged region of the the Cosmic Assembly Near-infrared Deep Extragalactic Legacy Survey (CANDELS; Grogin et al. 2011; Koekemoer et al. 2011), so it was not possible to examine directly the rest-frame optical morphologies of the HAE AGN subpopulation. We used the HST ACS optical (F814W) morphology catalogs from Tasca et al. (2009) from the broader COSMOS field (Scoville et al. 2007) to compare the concentrations and asymmetries of the rest-frame UV emission from the HAEs and their AGN subpopulation. These parameters were available for 270 C-COSMOS HAEs and all 10 AGN. Compared with the C-COSMOS HAE population, the AGN subpopulation morphology distribution is skewed towards higher optical-light concentrations (K-S test reveals the populations differ at the 98.1% confidence level). The AGN subpopulation asymmetry distribution is consistent with the broader HAE population, with no evidence for more luminous AGN having larger asymmetries, as might be expected from merging systems. However, the observed HST images reveal that the rest-frame UV light from the most luminous AGN is dominated by the QSO emission, skewing the light to higher concentrations and making merger signatures elusive. Observations of these sources with HST WFC3 IR (rest-frame optical) would improve our ability to address whether mergers play a significant role in triggering driving SMBH growth in the HAE population.
5. Summary
We have conducted a 100 ks Chandra observation over the 2QZ Clus structure and present a Chandra point-source catalog. Within the Chandra footprint, the 2QZ Clus structure contains 21 HAEs and four QSOs at (total of 22 unique sources) and is on-average a factor of 2 times overdense compared to field HAEs. The 2QZ Clus was initially selected by (1) identifying an overdensity of QSOs and (2) performing H narrow-band photometry to preferentially detect additional star-forming galaxies and AGN at (via HAE selection; see Matsuda et al. 2011). Given its selection, the 2QZ Clus HAEs contain a rich mixture of AGN and star-forming galaxies. To put into broader context the 2QZ Clus HAEs, we compare their properties with those of a larger sample of 210 HAEs selected in the C-COSMOS field. Our findings are summarized below.
-
•
We find seven of the 22 sources are detected in the X-ray band, including all four QSOs. These sources have 2–10 keV luminosities of (8–60) ergs s-1 and HB/SB count-rate ratios indicative of unobscured QSOs. Comparison with HAEs in C-COSMOS reveal that the HAE AGN fraction in the 2QZ Clus field is enhanced by a factor of compared with the broader field (after excluding pre-selected 2QZ Clus QSOs). Therefore, the 2QZ Clus structure is a region in which SMBH growth is in a particularly active phase.
-
•
On average, X-ray selected AGN and QSOs occupy the high-flux end of the H flux distribution, suggesting that the H line for these bright HAEs is on average dominated by the QSO component. For 2QZ Clus the mean H flux is higher than any non-AGN HAE, indicating that the total 2QZ Clus H power output for HAEs is dominated by AGN/QSO activity. However, the C-COSMOS HAEs have H power dominated by star-forming galaxies.
-
•
We find suggestive evidence that the C-COSMOS HAE AGN fraction increases with increasing local HAE overdensity. The 2QZ Clus HAEs reside in a factor of 2 HAE overdense environment. After excluding known optically-selected QSOs, the 2QZ Clus AGN fraction is a factor of times higher than C-COSMOS HAEs in similarly overdense environments. Either the local density as measured by HAEs alone does not provide an accurate characterization of a truly more overdense 2QZ Clus environment, or the 2QZ Clus HAE population is a statistical outlier (at the 95.9% level) in terms of its elevated AGN fraction.
-
•
We make use of Chandra and Herschel 250m stacking of 2QZ Clus and C-COSMOS HAE samples to measure mean SMBH mass accretion rates and SFRs. These stacking analyses reveal that the mean X-ray emission from all HAE samples is dominated by AGN, with 2QZ Clus HAEs having QSO-like luminosities ( [6–10] ergs s-1) and C-COSMOS HAEs having much lower Seyfert-like luminosities ( [3–6] ergs s-1). The mean SFRs range from 60–110 yr-1 for 2QZ Clus HAEs depending on whether optically-selected QSOs are removed or not. The SFRs for C-COSMOS HAEs span 40 yr-1 to 70 yr-1. The inferred mean SMBH mass accretion rate to SFR ratio (/SFR) for these samples indicate that the 2QZ Clus SMBHs and galaxies appear to be growing at rates comparable to those expected by the local ratio, while the mean /SFR for C-COSMOS HAEs lie a factor of 3 times lower than the local ratio. We find that the /SFR vs. X-ray luminosity for both the 2QZ Clus and C-COSMOS HAE samples appear to follow trends found for 1–2 star-forming galaxies and X-ray selected AGN.
-
•
We estimate that an episodic QSO phase with a duty cycle of 2–8% would allow C-COSMOS HAEs to emerge onto the relation despite their lower population-averaged /SFR. This estimate is consistent with the observed C-COSMOS HAE AGN fraction (0.4–2.3%) for ergs s-1 sources.
Future observations of the 2QZ Clus are needed to further evaluate (1) what physical conditions have led to such an enhanced AGN fraction, (2) the large-scale environment of the 2QZ Clus structure, and (3) whether there is a significant underlying overdensity of galaxies that are not HAEs (e.g., massive passive galaxies and additional galaxies with low SFRs or heavily extinguished H emission).
References
- Adelman-McCarthy et al. (2008) Adelman-McCarthy, J. K., Agüeros, M. A., Allam, S. S., et al. 2008, ApJS, 175, 297
- Alexander et al. (2008) Alexander, D. M., Brandt, W. N., Smail, I., et al. 2008, AJ, 135, 1968
- Basu-Zych et al. (2012) Basu-Zych, A. R., Lehmer, B. D., Hornschemeier, A. E., et al. 2012, arXiv:1210.3357
- Bell et al. (2005) Bell, E. F., Papovich, C., Wolf, C., et al. 2005, ApJ, 625, 23
- Bennert et al. (2011) Bennert, V. N., Auger, M. W., Treu, T., Woo, J.-H., & Malkan, M. A. 2011, ApJ, 726, 59
- Best et al. (2005) Best, P. N., Kauffmann, G., Heckman, T. M., et al. 2005, MNRAS, 362, 25
- Bower et al. (2006) Bower, R. G., Benson, A. J., Malbon, R., et al. 2006, MNRAS, 370, 645
- Bower et al. (2008) Bower, R. G., McCarthy, I. G., & Benson, A. J. 2008, MNRAS, 390, 1399
- Calzetti (1997) Calzetti, D. 1997, AJ, 113, 162
- Chary & Elbaz (2001) Chary, R., & Elbaz, D. 2001, ApJ, 556, 562
- Cisternas et al. (2011) Cisternas, M., Jahnke, K., Inskip, K. J., et al. 2011, ApJ, 726, 57
- Civano et al. (2012) Civano, F., Elvis, M., Brusa, M., et al. 2012, ApJS, 201, 30
- Croom et al. (2001) Croom, S. M., Smith, R. J., Boyle, B. J., et al. 2001, MNRAS, 322, L29
- Croom et al. (2004) Croom, S. M., Smith, R. J., Boyle, B. J., et al. 2004, MNRAS, 349, 1397
- Croton et al. (2006) Croton, D. J., Springel, V., White, S. D. M., et al. 2006, MNRAS, 365, 11
- Daddi et al. (2004) Daddi, E., Cimatti, A., Renzini, A., et al. 2004, ApJ, 617, 746
- De Lucia et al. (2006) De Lucia, G., Springel, V., White, S. D. M., Croton, D., & Kauffmann, G. 2006, MNRAS, 366, 499
- Digby-North et al. (2010) Digby-North, J. A., Nandra, K., Laird, E. S., et al. 2010, MNRAS, 407, 846
- Efstathiou & Rowan-Robinson (1995) Efstathiou, A., & Rowan-Robinson, M. 1995, MNRAS, 273, 649
- Ehlert et al. (2012) Ehlert, S., Allen, S. W., Brandt, W. N., et al. 2012, arXiv:1209.2132
- Elbaz et al. (2007) Elbaz, D., Daddi, E., Le Borgne, D., et al. 2007, A&A, 468, 33
- Elvis et al. (2009) Elvis, M., Civano, F., Vignali, C., et al. 2009, ApJS, 184, 158
- Fanidakis et al. (2012) Fanidakis, N., Baugh, C. M., Benson, A. J., et al. 2012, MNRAS, 419, 2797
- Geach et al. (2008) Geach, J. E., Smail, I., Best, P. N., et al. 2008, MNRAS, 388, 1473
- Geach et al. (2009) Geach, J. E., Alexander, D. M., Lehmer, B. D., et al. 2009, ApJ, 700, 1
- Geach et al. (2012) Geach, J. E., Sobral, D., Hickox, R. C., et al. 2012, arXiv:1206.4052
- Gehrels (1986) Gehrels, N. 1986, ApJ, 303, 336
- Governato et al. (1998) Governato, F., Baugh, C. M., Frenk, C. S., Cole, S., Lacey, C. G., Quinn, T., & Stadel, J. 1998, Nature, 392, 359
- Grogin et al. (2011) Grogin, N. A., Kocevski, D. D., Faber, S. M., et al. 2011, ApJS, 197, 35
- Häring & Rix (2004) Häring, N., & Rix, H.-W. 2004, ApJL, 604, L89
- Harrison et al. (2012) Harrison, C. M., Alexander, D. M., Mullaney, J. R., et al. 2012, ApJL, 760, L15
- Hasinger et al. (2005) Hasinger, G., Miyaji, T., & Schmidt, M. 2005, A&A, 441, 417
- Hatziminaoglou et al. (2010) Hatziminaoglou, E., Omont, A., Stevens, J. A., et al. 2010, A&A, 518, L33
- Kauffmann (1996) Kauffmann, G. 1996, MNRAS, 281, 487
- Kennicutt (1998) Kennicutt, R. C., Jr. 1998, ARA&A, 36, 189
- Kocevski et al. (2012) Kocevski, D. D., Faber, S. M., Mozena, M., et al. 2012, ApJ, 744, 148
- Koekemoer et al. (2011) Koekemoer, A. M., Faber, S. M., Ferguson, H. C., et al. 2011, ApJS, 197, 36
- Kroupa (2001) Kroupa, P. 2001, MNRAS, 322, 231
- Lehmer et al. (2008) Lehmer, B. D., Brandt, W. N., Alexander, D. M., et al. 2008, ApJ, 681, 1163
- Lehmer et al. (2009) Lehmer, B. D., Alexander, D. M., Chapman, S. C., et al. 2009a, MNRAS, 400, 299
- Lehmer et al. (2009) Lehmer, B. D., Alexander, D. M., Geach, J. E., et al. 2009b, ApJ, 691, 687
- Lehmer et al. (2010) Lehmer, B. D., Alexander, D. M., Bauer, F. E., et al. 2010, ApJ, 724, 559
- Marconi et al. (2004) Marconi, A., Risaliti, G., Gilli, R., et al. 2004, MNRAS, 351, 169
- Martini et al. (2009) Martini, P., Sivakoff, G. R., & Mulchaey, J. S. 2009, ApJ, 701, 66
- Matsuda et al. (2011) Matsuda, Y., Smail, I., Geach, J. E., et al. 2011, MNRAS, 416, 2041
- McNamara & Nulsen (2012) McNamara, B. R., & Nulsen, P. E. J. 2012, New Journal of Physics, 14, 055023
- Mullaney et al. (2011) Mullaney, J. R., Alexander, D. M., Goulding, A. D., & Hickox, R. C. 2011, MNRAS, 414, 1082
- Mullaney et al. (2012) Mullaney, J. R., Pannella, M., Daddi, E., et al. 2012a, MNRAS, 419, 95
- Mullaney et al. (2012) Mullaney, J. R., Daddi, E., Béthermin, M., et al. 2012b, ApJL, 753, L30
- Netzer et al. (2007) Netzer, H., Lutz, D., Schweitzer, M., et al. 2007, ApJ, 666, 806
- Oliver et al. (2012) Oliver, S. J., Bock, J., Altieri, B., et al. 2012, MNRAS, 424, 1614
- Page et al. (2012) Page, M. J., Symeonidis, M., Vieira, J. D., et al. 2012, Nature, 485, 213
- Puccetti et al. (2009) Puccetti, S., Vignali, C., Cappelluti, N., et al. 2009, ApJS, 185, 586
- Santini et al. (2012) Santini, P., Rosario, D. J., Shao, L., et al. 2012, A&A, 540, A109
- Salim et al. (2007) Salim, S., Rich, R. M., Charlot, S., et al. 2007, ApJS, 173, 267
- Schawinski et al. (2011) Schawinski, K., Treister, E., Urry, C. M., et al. 2011, ApJL, 727, L31
- Scoville et al. (2007) Scoville, N., Abraham, R. G., Aussel, H., et al. 2007, ApJS, 172, 38
- Sobral et al. (2009) Sobral, D., Best, P. N., Geach, J. E., et al. 2009, MNRAS, 398, 75
- Sobral et al. (2012) Sobral, D., Smail, I., Best, P. N., et al. 2012, arXiv:1202.3436
- Spergel et al. (2003) Spergel, D. N., et al. 2003, ApJS, 148, 175
- Steidel et al. (1998) Steidel, C. C., Adelberger, K. L., Dickinson, M., et al. 1998, ApJ, 492, 428
- Steidel et al. (2005) Steidel, C. C., Adelberger, K. L., Shapley, A. E., et al. 2005, ApJ, 626, 44
- Tasca et al. (2009) Tasca, L. A. M., Kneib, J.-P., Iovino, A., et al. 2009, A&A, 503, 379
- Treister et al. (2012) Treister, E., Schawinski, K., Urry, C. M., & Simmons, B. D. 2012, ApJL, 758, L39
- Vasudevan & Fabian (2007) Vasudevan, R. V., & Fabian, A. C. 2007, MNRAS, 381, 1235
- Volonteri et al. (2003) Volonteri, M., Haardt, F., & Madau, P. 2003, ApJ, 582, 559
- Xue et al. (2010) Xue, Y. Q., Brandt, W. N., Luo, B., et al. 2010, ApJ, 720, 368