Effects of isoelectronic Ru substitution at the Fe site on the energy gaps of optimally F-doped SmFeAsO
Abstract
We studied the effects of isoelectronic Ru substitution at the Fe site on the energy gaps of optimally F-doped SmFeAsO by means of point-contact Andreev reflection spectroscopy. The results show that the system keeps a multigap character at least up to , and that the gap amplitudes and scale almost linearly with the local critical temperature . The gap ratios remain approximately constant only as long as , but increase dramatically when decreases further. This trend seems to be common to many Fe-based superconductors, irrespective of their family. Based on first-principle calculations of the bandstructure and of the density of states projected on the different bands, we show that this trend, as well as the dependence of the gaps and the reduction of upon Ru doping, can be explained within an effective three-band Eliashberg model as being due to a suppression of the superfluid density at finite temperature that, in turns, modifies the temperature dependence of the characteristic spin-fluctuation energy.
pacs:
74.50.+r , 74.70.Dd, 74.45.+cI Introduction
The discovery of Fe-based superconductors (FeBS) Kamihara et al. (2008) with as high as 55 K has shown that cuprates no longer represent the only class of high- compounds. One of the reasons of the great excitement in the scientific community and of the impressive amount of work produced up to now is certainly that these materials give the opportunity to study high- superconductivity in different systems, in the hope to enucleate its key elements. The parent stoichiometric compounds of most FeBS are not superconducting (with few exceptions, like LiFeAs and LaFePO) but display a metallic behaviour (as opposed to the Mott insulating state of cuprates) and feature a long-range antiferromagnetic (AFM) spin-density-wave (SDW) order. Superconductivity appears upon doping and, in some systems, also by applying pressure; however, the order of the transition between magnetic and superconducting phases seems not to be universal though increasing evidences are being collected of a region of coexistence of superconductivity and magnetism. Contrary to cuprates (where the superconducting region in the phase diagram is dome-shaped and the maximum corresponds to a well-defined “optimal” doping) in FeBS superconductivity sometimes appears with already very close to the maximum and shows a weak doping dependence in a broad doping range. A central feature of FeBS – which is tightly connected to the origin of superconductivity according to the most widely accepted theories – is their multiband character. They feature indeed two or three hole pockets around the point of the first Brillouin zone and two electron pockets at the point (in the folded Brillouin zone) Mazin and Schmalian (2009); Mazin et al. (2008a). In 1111 compounds, all the relevant Fermi surface sheets are weakly warped cylinders parallel to the axis (as expected in a layered material) while a greater degree of three-dimensionality is observed in 122 compounds. These multiple bands and their almost perfect nesting in the parent compound explain the AFM instability. The weakening of the nesting induced by doping instead leads to spin fluctuations that would act as the glue for the formation of Cooper pairs. A spin-fluctuation mediated pairing would be mainly interband and would favour the opening of superconducting energy gaps of different sign on different Fermi surface sheets, the so-called symmetry Mazin et al. (2008b). Though many theoretical and experimental results support this theory Chen et al. (2010); Inosov et al. (2010) there is not, up to now, a definitive proof of such a picture. Things are further considerably complicated by the fact that the electronic banstructure is very sensitive to some fine structural parameters, like the Fe-As-Fe bond angle and more particularly the height of the pnictogen atom () above the Fe layer. Possibly because of this sensitivity, in many situations the gap structure of FeBS can vary considerably within the same system, giving rise to line nodes, point nodes, deep gap minima etc. Reid et al. (2010); Prozorov and Kogan (2011); Reid et al. (2011); Hirschfeld et al. (2011). In 1111 compounds, has been proposed as a switch between high- nodeless superconductivity and low- nodal superconductivity Kuroki et al. (2009).
In the effort to discriminate the effects of different parameters on the superconducting and magnetic phases of FeBS many different chemical substitutions have been performed. The main effect of aliovalent substitutions is to dope the parent compound with charge, either electrons Lee et al. (2009); Sefat et al. (2008) or holes Wen et al. (2008) thus allowing to explore the phase diagram. Isovalent substitutions Tropeano et al. (2010); Zhigadlo et al. (2011); McGuire et al. (2009); Lee et al. (2010), instead were tried to modify the lattice structure, create “chemical pressure”, introduce disorder (acting as magnetic or non-magnetic impurities) etc. A further degree of freedom is the site of substitution, that can reside either in the spacing layer Wen et al. (2008) or in the active one containing Fe Tropeano et al. (2010); Zhigadlo et al. (2011); McGuire et al. (2009); Lee et al. (2010), which is possibly directly involved in the magnetic pairing via spin fluctuations.
Here we report on point-contact Andreev-reflection spectroscopy (PCARS) measurements performed in SmFe1-xRuxAsO0.85F0.15 with ranging from 0 to 0.50. The considerable decrease of in this series of samples has been attributed to disorder in the Fe sub-lattice Tropeano et al. (2010) and/or occurrence of a short-range static magnetic order Sanna et al. (2011). PCARS results clearly indicate the presence of a multigap character at all the investigated levels of Ru substitution. The superconducting gaps decrease approximately linearly with the local critical temperature of the contact, but, even when the latter is reduced by a factor 5 with respect to the optimal value, they show no sign of nodes, either intrinsic or “accidental”. For both gaps, the ratio is rather constant down to but then increases consistently below this critical temperature. Comparison with other results in literature indicates that many different FeBS fit in this trend, which suggests the possibility to study some properties common to different compounds in a single samples series that allows spanning a very wide range of critical temperatures. Thanks to ab-initio electronic structure calculations, the trend of the gaps as a function of has been reproduced within a minimal three-band, Eliashberg model. This model also takes into account the so-called “feedback” effect, i.e. the effect of the condensate on the antiferromagnetic spin fluctuations possibly responsible for the superconductivity in these compounds. The evolution as a function of of the temperature dependence of the condensate necessary to reproduce the experimental data looks rather similar to that obtained from London penetration-depth measurements performed in other FeBS, particularly in the region of coexistence of superconductivity and magnetism. This fact suggests that, in agreement with ref. Sanna et al. (2011), proximity of superconductivity and magnetism in these samples might be one of the main reasons for the decrease of and for the observed behavior of the energy gaps.
II Experimental details
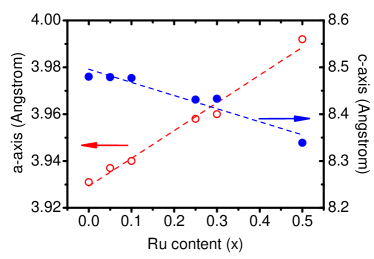
The polycrystalline samples were synthesized as described in Ref. Tropeano et al. (2010). The starting mixture of fine powder of SmAs and 99.9% pure , , , and was pressed in pellets and then put through a two-step reaction process involving a first heating to and a second heating to . X-ray diffraction analysis showed small amounts of SmOF (up to 6 %) in the final samples. Figure 1 shows the dependence of the lattice constants and on the Ru content , indicating that Ru substitution for Fe is effective.
Resistive critical temperatures and residual resistivities for the samples used in this work are reported in table 1. The samples with and have higher and much improved transport properties (namely, resistivity, magnetoresistance and Hall mobility) than those reported in ref. Tropeano et al. (2010) for the same doping contents, even though they were prepared in the same way. The possible reason of this difference is under investigation. In any case, these samples were particularly suited for PCARS measurements, since the longer mean free path makes it easier to attain the spectroscopic conditions, as explained below.
| (K) | (m cm) | |
|---|---|---|
| 0 | 52.0 | 0.33 |
| 0.05 | 42.8 | 0.87 |
| 0.10 | 21.5 | 1.33 |
| 0.25 | 28.1 | 1.20 |
| 0.30 | 13.6 | 1.69 |
| 0.50 | 13.5 | 0.70 |
Point contact spectroscopy is a local, surface-sensitive technique and it is therefore necessary to avoid any surface degradation or contamination. The samples were thus always kept in dry atmosphere, and broken to expose a clean surface prior to point-contact fabrication. The point contacts were made by putting a small drop of Ag paste on that surface, as described elsewhere Gonnelli et al. (2009); Daghero and Gonnelli (2010). With respect to the standard “needle-anvil” technique, this configuration ensures a greater mechanical and thermal stability of the contacts and also allows the whole mounting for point contact to be hermetically closed in the cold head of the cryogenic insert thus avoiding any exposition to air and moisture during the transfer from the glove box (where the point contacts are fabricated) to the cryogenic environment. Although the Ag drop has a diameter of at least , the real electric contact occurs only between some of the Ag grains and the sample surface. The true contact is thus the parallel of several nanoscopic junctions that can well be in the ballistic regime (i.e. have a radius smaller than the electron mean free path). In Ref. Tropeano et al. (2010) a rough evaluation of the mean free path in gave nm without any clear dependence on the Ru content. In the cleaner samples with and , the same evaluation gives nm and nm, respectively. Such small values of the mean free path make the fulfillment of the ballistic condition (where is the contact radius) be very difficult to achieve. For instance, with these values of and the residual resistivities taken from table 1, the Sharvin equation Sharvin (1965) would require resistances of the order of several for the contact to be ballistic. The typical experimental resistance of the contacts is instead in the range . Indeed, many of the contacts were not spectroscopic or showed heating effects. A large number of measurements was then necessary to achieve a relatively small number of successful measurements. All the results reported here, except those shown in fig.3, are thus referred to the small fraction of contacts that do not show heating effects and gave a clear Andreev-reflection signal. In these cases, the existence of many parallel nanojunctions can be invoked to reconcile the actual contact resistance with the requirement of ballistic transport Daghero and Gonnelli (2010). In some cases, the Sharvin condition was fulfilled at low temperature but broke down on increasing the temperature because of the decrease in the mean free path. In these cases, the values of the gaps at low temperature can be taken as meaningful anyway, though their temperature dependence and eventually the value of the local critical temperature can be slightly affected by the non-ideality of the contact.
III Results and discussion
III.1 Point-contact Andreev-reflection results
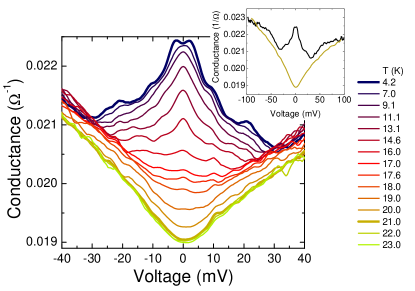
Figure 2 reports the temperature dependence of the raw conductance curves (obtained by numerical differentiation of the characteristics) of one of the contacts that did not show any anomaly. The curves were measured in the sample, and the normal-state resistance of the contact is around . The curves show the typical features already observed in Daghero et al. (2009a), in Gonnelli et al. (2009) and in other 1111 compounds. In particular, they feature clear maxima related to a presumably nodeless gap, shoulders suggestive of a second larger gap and additional structures that, as recently shown Daghero et al. (2011), can be explained as being due to the strong electron-boson coupling. The excess conductance at high voltage, extending up to about 100 mV (see inset) is also typical of these systems Daghero et al. (2011). The temperature at which the Andreev-reflection features disappear and the conductance becomes equal to the normal-state one is the local critical temperature of the contact, or Andreev critical temperature . As shown in fig.2 this temperature is easy to identify in spectroscopic contacts because it also marks the point where conductance curves recorded at slightly different temperature start to be superimposed to one another (here the curves at 21.0, 22.0 and 23.0 K coincide within the experimental noise).
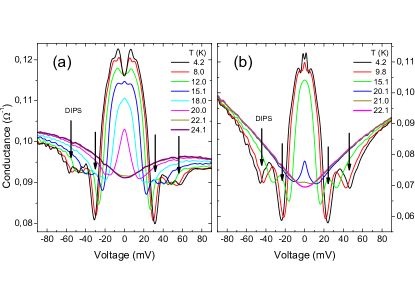
In contrast, Figure 3 reports two examples of conductance curves that show, together with an Andreev signal, deep and wide dips that, at low temperature, occur at energies comparable to those of the large gap. As shown elsewhere Daghero and Gonnelli (2010); Sheet et al. (2004) these dips are likely to be due to the current becoming overcritical in the region of the contact and prevent a proper determination of the gap amplitudes. On increasing temperature, they move toward lower voltage (due to the decrease of the critical current) causing an apparent shrinkage of the Andreev signal, finally giving rise to a sharp cusp at zero bias.
Going back to the case of ballistic contacts as in Fig.2, the conductance at or just above can be used to normalize all the curves at . In principle, a conductance curve recorded at a given temperature should be normalized to the normal-state conductance at the same temperature, but because of the very high upper critical field of these materials, the latter is not usually accessible, at least at low . Using the normal state at to normalize all the curves is thus a somehow arbitrary choice but, as shown elsewhere Daghero et al. (2011), is anyway the one that preserves the weaker structures, i.e. those due to the large gap and, if present, those due to the strong electron-boson coupling.
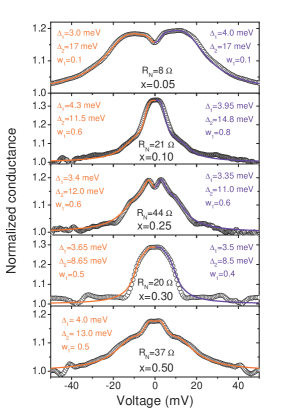
Figure 4 shows some examples of low-temperature, normalized conductance curves in samples with different Ru content. Some important points are immediately clear by looking at these curves. First, none of them displays zero-bias peaks, and the same happens in 100% of the spectroscopic contacts. This points towards the absence of line nodes even at the highest Ru contents, contrary to what has been observed in some other FeBS away from optimal doping Reid et al. (2010); Prozorov and Kogan (2011); Reid et al. (2011); Hirschfeld et al. (2011) 111 Moreover, none of the curves we measured showed the finite-energy peaks associated with quasiparticle interference predicted, in some conditions, in the nodeless symmetry Golubov et al. (2009). The occurrence and the voltage position of these peaks is controlled, in the relevant theory, by a mixing parameter which has not been related yet to experimental parameters. Therefore, either these peaks are not present because the conditions for their observation are not fulfilled, or they are smeared out, particularly at the values typical of our contacts, by the broadening effects.. Second, all the curves show more or less marked double-gap features. Third, despite the very large range of doping, the width of the structures does not change very much (note that all the panels have the same horizontal scale). Thus we should not expect major variations in the gap values upon Ru doping. Fourth, the asymmetry of the normalized conductance curves for positive/negative bias – which is particularly strong in unsubstituted Daghero et al. (2009a) – seems to be reduced by Ru doping. As a matter of fact, it is clearly visible even at a first glance in the case , becomes discernible only while trying to fit the data in the cases and but almost completely disappears for and . The real origin of this asymmetry, which is common to most point-contact spectra in Fe-based superconductors, is not completely clear yet, though it has been recently ascribed to the Seebeck effect Naidyuk et al. (2010). Preliminary Seebeck effect measurements performed in these samples show indeed a considerable decrease of the Seebeck coefficient with increasing Ru content Putti et al. .
To extract quantitative information about the amplitude of the gaps from the conductance curves, they must be compared with suitable theoretical models. None of the models for single-band superconductivity can reproduce the shape of the experimental curves of fig.4. Instead, a two-band Blonder-Tinkham-Klapwijk model Blonder et al. (1982) generalized to the 2D case Kashiwaya et al. (1996) and including a broadening term Plecenik et al. (1994) is the minimal model that can be used in this case. For each band the parameters of the model are the energy gap , the broadening parameter and the barrier parameter . Then, being the total conductance the weighed sum of the single-band conductances, the last parameter is the weight of band (the weight of band being consequently determined as ).222The BTK model provides reliable results also in the case of parallel nano-junctions. Simulations show that the fit of the total conductance in this case gives “effective” parameters. The “effective” gap turns out to be approximately equal to the average of the gaps of the individual contacts. It is true that Sm-1111 is not two-dimensional and thus a 3D model should be used; however, as shown elsewhere Daghero et al. (2011), the latter is much more complicated and for any practical purpose one can safely use the 2D one (especially when, as it is the case here, the gaps are nodeless). The lines in Fig.4 represent the best fit of the experimental data, and the labels indicate the relevant values of the gaps and of the weight of band 1 in the point-contact conductance, . To account for the residual asymmetry of the normalized curves, we chose to fit the positive- and negative-bias side separately (blue and red lines, respectively). As previously stated, for the asymmetry is very small and the difference between the two fits can be no longer appreciated.
Figure 5 shows two examples of how the normalized conductance curves evolve with temperature, and the resulting temperature dependence of the gaps extracted from the fit. The two cases shown refer to a lightly doped sample ( ) and to a heavily doped one (). The lowest-temperature curves show clear shoulders related to the larger gap, which become less and less discernible in the other curves (vertically offset for clarity). In the case, a dip structure is also seen to shift to lower energy on increasing the temperature, possibly giving rise to the small downward deviation of the temperature dependence of from a BCS-like curve observed at high temperature. Although there is no reason to expect the gaps to follow a BCS-like curve, the effects of the dip do not allow us to discuss whether this deviation is intrinsic or is an artifact due to the small mean free path of the samples. Incidentally, on the basis of recent calculations within a minimal three-band Eliashberg model Ummarino et al. (2009) one would instead expect the gaps to be greater than the BCS value in proximity of the critical temperature.
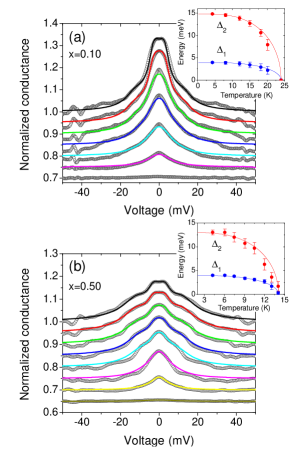
Let us just recall here that the fitting procedure is generally not univocal, i.e. different sets of parameters can give almost equally good fits. Error bars in the insets to Fig.5 indicate the spread of gap values resulting from different fits.
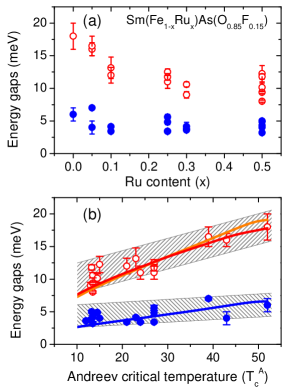
Figure 6(a) shows the behavior of the gaps as a function of the Ru doping . The data are rather scattered but a general trend is anyway discernible. While the small gap does not vary sensibly on increasing the Ru content , the large gap shows a rapid decrease from to and then remains approximately constant. This behavior is in rough qualitative agreement with that of the bulk reported in table 1. Since PCARS is a local probe, the scattering of gap values at the same composition is most probably due to slight inhomogeneities in the local doping content. As long as has a strong dependence on the doping content, i.e. up to , different point contacts on the same sample can thus provide different values of the gaps and of the local , i.e. the Andreev critical temperature. As a matter of fact if one plots the gaps as a function of as in fig.6(b), a roughly linear trend of both and can be appreciated despite the fluctuations in their values. It is worth reminding that the data reported here are already the results of a very careful selection aimed at eliminating all the questionable results, so that these fluctuations are not due to spurious effects that can be ascribed to non-ballistic conduction, heating, or spreading resistance. As for the large gap, a large uncertainty was also found in the starting compound Daghero et al. (2009a) (here represented by the vertical error bar on the point at the maximum ) and was ascribed to the residual degrees of freedom in the normalization process, to the asymmetry of the curves and to the fact that the features related to are less sharp than those related to the small gap . However, in the high-doping range ( and ), depends very little on the Ru content and the asymmetry has almost completely disappeared; even large differences in local composition correspond to a small difference in . Therefore, the spread of gap values accompanied by a small spread in seems to indicate a lack of correlation between these quantities (as observed also in MgB2 with Al and Li co-doping Daghero et al. (2009b)).
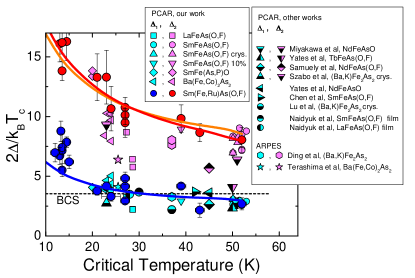
Since the gaps show an overall linear trend as a function of the local , it is particularly instructive to plot the gap ratios as a function of . This is done in figure 7, which also reports various other PCARS data in 1111 and 122 compounds. Only results showing nodeless order parameters are shown for consistency. It is clear that the Ru substitution in the optimally F-doped Sm-1111 allows spanning a wide range of critical temperatures, which not only covers but also extends the range of values of superconducting Fe-based compounds measured so far by PCARS. As already shown in ref. Daghero et al. (2011), the ratios start to increase below K. Surprisingly, PCARS data on this single sample series, namely SmFe1-xRuxAsO0.85F0.15, feature basically the same behavior as those obtained from many other different nodeless FeBS of the 1111 and 122 families.
These results appear to be in contrast to what reported in ref. Inosov et al. (2011), where an opposite trend is suggested. However, even in the aforementioned paper, several results reported for FeBS show ratios which seem to increase with decreasing , particularly for the large gap. A definitive answer on the possibility of a universal trend of vs. requires more experimental work, comparing results obtained with different techniques on samples of increasingly better quality.
III.2 Electronic structure calculations
In order to try to explain the observed PCARS data within the Eliashberg theory, we preliminarily performed electronic structure calculations. In particular, SmFeAsO electrons and holes density of states (DOS) have been obtained by ab initio calculations performed in the local density approximation to the density-functional theory (LDA-DFT) Perdew and Wang (1992) as implemented in the all-electron full-potential APW and local orbitals Singh (1991); Sjöstedt et al. (2000) code Wien2k Blaha et al. (2001). APW has the advantage to treat explicitly Sm 4f electrons within the valence band yielding state-of-the-art band structure dispersion quality. To simulate Ru substitution our calculations were performed in a tetragonal super-cell containing four formula units (Pma2 No. 28) where 25% Ru concentration was achieved by the substitution of one Ru out of four Fe, retaining the bulk symmetry in the defected cell. The conservation of symmetry allowed a reliable comparison of doped and undoped band structures without folding/unfolding mapping problems. Muffin tin radii of 2.3, 1.9, 2.2 and 2.0 Bohr were used for Sm, O, Fe and As, respectively. Brillouin zone integration was performed with tetrahedrons on a mesh Blöchl et al. (1994). Since we are interested in the superconducting paramagnetic phase of SmFeAsO, Fe spin polarization was not considered. The relevant band structure of this system is given by two electron and three hole bands as it is usual for 1111 iron-pnictides. Those are superimposed to the 4f Sm bands at the Fermi energy (EF). To disentangle the contribution of the Fe 3d bands we used the so-called fat-band representation by projecting the wavefunction onto the Fe atomic orbitals and thus obtaining the band structures shown by dots in Fig.8. The size of dots is proportional to the d atomic character of the wavefunction on Fe atoms.
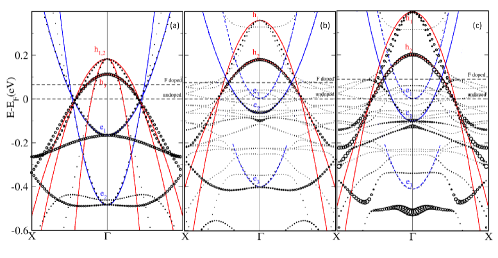
Such a procedure allows to identify a number of parabolic Fe 3d bands around EF. Since comparison with LaFeAsO is relevant, in Fig.8(a) we report the band structure obtained for the same crystal structure of the SmFeAsO compound where Sm has been replaced by La. In Fig.8(a) we clearly see the usual set of five parabolic Fe d bands, two electrons (e1, e2) and three holes ones (h1, h2 and h3), all of them centered at the point since we are using a four formula unit super-cell. This finding is in agreement with previous LDA-DFT calculations provided we consider that SmFeAsO structure was used here Mazin et al. (2008a). As for the band structure of the actual SmFeAsO, we find Fe d bands superimposed to Sm 4f ones. This fact not only makes the interpretation of the band structure less easy but introduces an hybridization effect between Sm and Fe states. LDA bands in Fig.8(b) show that Fe electron bands in SmFeAsO are no more simply parabolic but hybridization introduces warping out of the central part of the Brillouin zone. Hybridization splits the electron band labeled e2 in Fig.8(a) in two pieces named e3 and e1 in Fig.8(b). In undoped SmFeAsO e3 and e1 do not cross EF being the former too low in energy and hybridized with Sm 4f bands (see details of Fig.8(b)) and the upper too high. Therefore, undoped SmFeAsO will have only one Fe-derived electron band e2 and three hole ones, the doubly-degenerate light-hole h1 and the heavy-hole h2. The Fermi surface will be made of four nearly cylindrical sheets, one less than LaFeAsO. Such a finding seems to be in agreement with ARPES measurements on SmFeAsO where only one electron band is suggested Yang et al. (2011). Since in the Eliashberg approach we are interested in the Fe d states DOS, we need to disentangle that contribution out of the total one that includes the Sm 4f bands. Our choice is to model the band structure as a superposition of five parabolic bands (including the empty e1) inside the background of 4f states. With the help of the fat-band representation, we fitted the relevant bands along the -X direction (-M in the usual two-formula unit cell) with parabolas shown as solid and dashed lines in Fig.8. Disregarding the possible warping of the cylindrical Fermi surfaces, the DOS deriving from the above mentioned bands was estimated from the calculated effective masses by the free two-dimensional electron gas model . This approximation is even more justified by the fact that in the Eliashberg analysis reported below only ratios between DOSs (which are much more accurate) enter in the calculations. Then, given this assumption, only the band curvature is relevant and therefore energy shifts with respect to LDA are not important in the model. The only important difference relies on the fact that the number of parabolic bands taken into consideration is five or four. In this regard, the position of EF is critical since band e1 is just above EF in the undoped compound. The superconducting phase is obtained by 15% F doping i.e. in SmFeAsO0.85F0.15. F substitution adds electrons to the system and in the rigid band approach such effect can be coped by the rigid shift of EF by 0.15 electrons per formula unit. Given the DOS of the system, the shift can be simply estimated as . Anyway, care should be taken in defining , since the localized nature of Sm 4f orbitals makes it likely that they do not receive the additional doping charge from F. We therefore filtered out this contribution from considering only the contribution of bands e1,2 and h1,2. Following this approach we get a sort of upper bound for the EF shift to be about 75 meV (90 meV) for SmFeAsO0.85F0.15 (SmFe0.75Ru0.25AsO0.85F0.15). The Fermi levels EF of F-doped and undoped SmFeAsO and SmFe0.75Ru0.25AsO are shown in Fig.8(a)-(c). We see that in the F-doped systems the band e1 is always partially filled justifying our assumption to include its contribution in Eliashberg calculations. As for the effect of Ru substitution, by comparing Fig.8(b) and (c) we see that the effect is modest, only band e2 is a bit deeper and with lower effective mass as shown in Fig.8(c). Calculated DOS and plasma frequencies for each band and for the two doping levels considered are reported in table 2.
| DOS (st/Ha/Bohr2) | (meV) | ||
|---|---|---|---|
| 0.739 | 0.2352 | 714.04 | |
| 1.508 | 0.4800 | 975.56 | |
| 0.908 | 0.2890 | 1391.91 | |
| 2.057 | 0.6547 | 844.86 | |
| 0.668 | 0.2127 | 782.19 | |
| 0.882 | 0.2809 | 1136.49 | |
| 0.957 | 0.3048 | 1428.07 | |
| 1.736 | 0.5526 | 864.74 |
III.3 Analysis of experimental results within Eliashberg theory
Based on the results of band structure calculations described so far, it is possible to propose an explanation of the experimental data by means of the simplest model that allows describing the essential physics of the materials under study. We used the three-band, Eliashberg theory Ummarino et al. (2009) taking into account the feedback effect Ummarino (2011). Within this model we have two hole bands (from now on labeled as 1 and 2) and one equivalent electron band (labeled as 3). The free parameters are , , , and . is the DOS at Fermi level, calculated above for and and obtained at all the other doping levels by linear interpolation as a function of the experimental ; and are the electron-boson coupling constants between band 3 and band 1 or 2, respectively; is the representative boson energy that we take as where Paglione and Greene (2010); the electron-boson spectral function has a Lorentzian shape Ummarino et al. (2009) with halfwidth Inosov et al. (2010); is the feedback critical temperature, determined by solving the Eliashberg equations in the imaginary-axis formulation. The electron-boson coupling matrix is
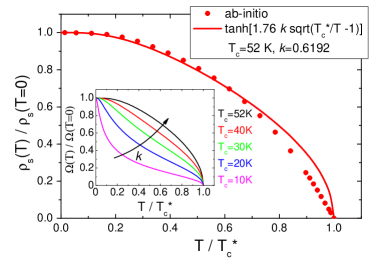
where and . was determined at in the following way: first, the superfluid density was calculated by using the plasma frequencies obtained from first principles and reported in table 2, giving also the correct . Then, since the temperature-dependent part of the superfluid density corresponds to that of the representative boson frequency Ummarino (2011), this curve was fitted with , giving . The values of the calculated superfluid density and the relevant fit are shown in Fig. 9 as symbols and line, respectively.
At this point, the only parameters that remain to be determined are two: , . At they are obtained by reproducing the two experimental gaps, but it turns out that they also reproduce the exact experimental critical temperature. Then we assume that the ratio is doping-independent and that is a linear function of the experimental critical temperature: . This assumption is related to the temperature dependence of the superfluid density and is reasonable to suppose that with increasing (and therefore decreasing of ) it decreases Prozorov and Kogan (2011). Now, the only free parameter left in the process of fitting the dependence of the gaps is which is fixed by obtaining coincident with the experimental one. The procedure is self-consistent since is varied until , introduced in the formula for , allows reproducing the experimental . Disorder effects have been neglected as impurities are dominant in the intraband channel and are thus not pair-breaking. Moreover, we also assumed that, as a first approximation, they are also absent in the interband channel since the two gaps are well distinct at all doping levels.
Results are shown in Fig. 6(b) as solid lines: the calculated gap values follow rather well the trend of the experimental ones at all temperatures. The same good agreement with the experiment can be seen also by looking at the ratios as a function of shown in Fig. 7 which also reports many other results from the literature. In this regard, it is also remarkable that it is possible, with a relatively simple model and a small number of free parameters, to reproduce the increase of the ratio with decreasing . Since the strength of the coupling increases with decreasing , the same does, as expected, the total electron-boson coupling constant, which is about 3.2 at =52 K and goes up to almost 7.3 when =10 K. Another interesting result that comes out from the theoretical analysis is the temperature dependence of the representative boson frequency (shown in the inset to Fig. 9 for different critical temperatures) which, as already stated above, is equivalent to that of the superfluid density Ummarino (2011). We can notice that, as decreases, the superfluid density also decreases as a function of assuming, below =30 K, a positive curvature at intermediate temperatures. Similar dependencies (at least in the low- and mid- range) have been obtained in penetration depth measurements in Co-doped Ba-122 samples, as reported in ref. Prozorov and Kogan (2011). In that case the effect is less pronounced probably because the results are reported only down to about 2/5 while in our case drops to /5 at the highest Ru doping. Moreover, it is also interesting to notice that in Co-doped Ba-122 the temperature dependence of the superfluid density looks slightly more depressed in samples that belong to the region of coexistence of superconductivity and magnetism. This fact leads us to speculate that the observed behavior of the superfluid density in our samples might be considerably influenced by the onset of a short-range magnetic order which competes with superconductivity and that has been observed by SR and 75As NQR measurements in the same samples Sanna et al. (2011). Penetration depth measurements, as the ones in ref. Prozorov and Kogan (2011), would help clarifying this point as well as the experimental determination of the temperature dependence of the representative boson frequency, as done in refs. Inosov et al. (2010); Tortello et al. (2010); Daghero et al. (2011).
IV Conclusions
The isoelectronic substitution of Fe with Ru in optimally F-doped Sm-1111 is a good way to explore a very wide range of critical temperatures within the same Fe-based compound, in principle without changing the total charge of the system Tropeano et al. (2010). The considerable decrease of induced by Ru substitution has been ascribed to disorder in the Fe sub-lattice Tropeano et al. (2010) and/or to the onset of a short-range magnetic order Sanna et al. (2011). Here we have shown that, in a wide range of (from 52 K down to 13.5 K, corresponding to Ru contents ranging from 0 to 50 %) the system retains its original multi-gap character, and also the symmetry of the gaps remains nodeless. The amplitudes of the two experimentally detectable gaps, and , decrease almost linearly with , but they remain well distinct down to the lowest . This suggests that the substitution-induced disorder mainly enhances intraband scattering and does not significantly affect the interband one. The gap ratios strongly increase for in a manner which suggests an unexpected increase of the electron-boson coupling when is depressed. Very interestingly, the trend of the gap ratios as a function of in this single system is superimposed to the analogous trend obtained by plotting the data of many Fe-based compounds of different families Daghero et al. (2011). Needless to say, this seems to point towards a general, universal property of this class of superconductors. By using the values of the density of states and of the plasma frequencies calculated from first principles, we have shown that the increase in the gap ratios on decreasing can be reconciled with a spin-fluctuation-mediated pairing even though the characteristic spin-fluctuation energy has been observed to decrease linearly with . The key to solving this puzzle is the feedback effect, i.e. the effect of the condensate on the mediating boson, which is of course only expected when the superconducting pairing between electrons is mediated by electronic excitations Ummarino (2011). An analysis carried out within an effective three-band Eliashberg model shows indeed that the experimental dependence of the gaps (and of the gap ratios ) on can be explained as being due, in particular, to a change in the shape of the temperature dependence of the characteristic boson energy, , with respect to the optimal- compound (with no Ru). Indeed, a suppression of in the mid-temperature range (which becomes more and more sensible on decreasing ) is required to obtain the correct critical temperature and the correct gap values. This finding is in very good qualitative agreement with the experimental observation of a depression of the superfluid density in Co-doped Ba-122 with reduced Prozorov and Kogan (2011). The fact that in the latter case this reduction is observed in underdoped samples that fall in the region of coexistence of magnetism and superconductivity further suggests that, also in our samples, the depression of the condensate (that in turns gives rise to a depression in the boson energy) at finite temperature may be considerably influenced by the onset of a short-range magnetic order competing with superconductivity induced by Ru substitution, as recently observed by SR and 75As NQR measurements in the same set of samples Sanna et al. (2011).
V Acknowledgements
This work was done within the PRIN project No. 2008XWLWF9-005. FB acknowledges support from CASPUR under the Standard HPC Grant 2012.
References
- Kamihara et al. (2008) Y. Kamihara, T. Watanabe, M. Hirano, and H. Hosono, J. Am. Chem. Soc. 130, 3296 (2008).
- Mazin and Schmalian (2009) I. I. Mazin and J. Schmalian, Physica C 469, 614 (2009).
- Mazin et al. (2008a) I. I. Mazin, M. D. Johannes, L. Boeri, K. Koepernik, and D. J. Singh, Phys. Rev. B 78, 085104 (2008a).
- Mazin et al. (2008b) I. I. Mazin, D. J. Singh, M. D. Johannes, and M. H. Du, Phys. Rev. Lett. 101, 057003 (2008b).
- Chen et al. (2010) C.-T. Chen, C. C. Tsuei, M. B. Ketchen, Z.-A. Ren, and Z. X. Zhao, Nature Phys. 6, 260 (2010).
- Inosov et al. (2010) D. S. Inosov, J. T. Park, P. Bourges, D. L. Sun, Y. Sidis, A. Schneidewind, K. Hradil, D. Haug, C. T. Lin, B. Keimer, et al., Nature Phys. 6, 178 (2010).
- Reid et al. (2010) J.-P. Reid, M. A. Tanatar, X. G. Luo, H. Shakeripour, N. Doiron-Leyraud, N. Ni, S. L. Bud ko, P. C. Canfield, R. Prozorov, and L. Taillefer, Phys. rev. B 82, 064501 (2010).
- Prozorov and Kogan (2011) R. Prozorov and V. G. Kogan, Rep. Prog. Phys. 74, 124505 (2011).
- Reid et al. (2011) J.-P. Reid, M. A. Tanatar, X. G. Luo, H. Shakeripour, S. René de Cotret, N. Doiron-Leyraud, J. Chang, B. Shen, H.-H. Wen, H. Kim, et al. (2011), unpublished, arXiv:1105.2232.
- Hirschfeld et al. (2011) P. J. Hirschfeld, M. M. Korshunov, and I. I. Mazin, Rep. Prog. Phys. 74, 124508 (2011).
- Kuroki et al. (2009) K. Kuroki, H. Usui, S. Onari, R. Arita, and H. Aoki, Phys. Rev. B 79, 224511 (2009).
- Lee et al. (2009) S. C. Lee, A. Kawabata, T. Moyoshi, Y. Kobayashi, and M. Sato, J. Phys. Soc. Jpn. 78, 043703 (2009).
- Sefat et al. (2008) A. S. Sefat, A. Huq, M. A. McGuire, R. Jin, B. C. Sales, D. Mandrus, L. M. D. Cranswick, P. W. Stephens, and K. H. Stone, Phys. Rev. B 78, 104505 (2008).
- Wen et al. (2008) H.-H. Wen, G. Mu, L. Fang, H. Yang, and X. Zhu, Europhys. Lett. 82, 17009 (2008).
- Tropeano et al. (2010) M. Tropeano, M. R. Cimberle, C. Ferdeghini, G. Lamura, A. Martinelli, A. Palenzona, I. Pallecchi, A. Sala, I. Sheikin, F. Bernardini, et al., Phys. Rev. B 81, 184504 (2010).
- Zhigadlo et al. (2011) N. D. Zhigadlo, S. Katrych, M. Bendele, P. J. W. Moll, M. Tortello, S. Weyeneth, V. Y. Pomjakushin, J. Kanter, R. Puzniak, Z. Bukowski, et al., Phys. Rev. B 84, 134526 (2011).
- McGuire et al. (2009) M. A. McGuire, D. J. Singh, A. S. Sefat, B. C. Sales, and D. Mandrus, J. Solid State Chem. 182, 2326 (2009).
- Lee et al. (2010) S. C. Lee, E. Satomi, Y. Kobayashi, and M. Sato, J. Phys. Soc. Jpn. 79, 023702 (2010).
- Sanna et al. (2011) S. Sanna, P. Carretta, P. Bonfà, G. Prando, G. Allodi, R. De Renzi, T. Shiroka, G. Lamura, A. Martinelli, and M. Putti, Phys. Rev. Lett. 107, 227003 (2011).
- Gonnelli et al. (2009) R. S. Gonnelli, D. Daghero, M. Tortello, G. A. Ummarino, V. A. Stepanov, J. S. Kim, and R. K. Kremer, Phys. Rev. B 79, 184526 (2009).
- Daghero and Gonnelli (2010) D. Daghero and R. Gonnelli, Supercond. Sci. Technol. 23, 043001 (2010).
- Sharvin (1965) Y. V. Sharvin, Zh. Eksp. Teor. Fiz. 48, 984 (1965), engl. Transl. Sov. Phys.-JETP 21, 655 (1965).
- Daghero et al. (2009a) D. Daghero, M. Tortello, R. S. Gonnelli, V. A. Stepanov, N. D. Zhigadlo, and J. Karpinski, Phys. Rev. B 80, 060502(R) (2009a).
- Daghero et al. (2011) D. Daghero, M. Tortello, G. Ummarino, and R. S. Gonnelli, Rep. Prog. Phys. 74, 124509 (2011).
- Sheet et al. (2004) G. Sheet, S. Mukhopadhyay, and P. Raychaudhuri, Phys. Rev. B 69, 134507 (2004).
- Kashiwaya et al. (1996) S. Kashiwaya, Y. Tanaka, M. Koyanagi, and K. Kajimura, Phys. Rev. B 53, 2667 (1996).
- Naidyuk et al. (2010) Y. G. Naidyuk, O. E. Kvitnitskaya, I. K. Yanson, G. Fuchs, S. Haindl, M. Kidszun, L. Schultz, and B. Holzapfel, Supercond. Sci. Technol. 24, 065010 (2010).
- (28) M. Putti et al., in preparation.
- Blonder et al. (1982) G. E. Blonder, M. Tinkham, and T. M. Klapwijk, Phys. Rev. B 25, 4515 (1982).
- Plecenik et al. (1994) A. Plecenik, M. Grajcar, v. Beňačka, P. Seidel, and A. Pfuch, Phys. Rev. B 49, 10016 (1994).
- Ummarino et al. (2009) G. A. Ummarino, M. Tortello, D. Daghero, and R. S. Gonnelli, Phys. Rev. B 80, 172503 (2009).
- Daghero et al. (2009b) G. A. Daghero, D. Ummarino, M. Tortello, D. Delaude, R. S. Gonnelli, V. A. Stepanov, M. Monni, and A. Palenzona, Supercond. Sci. Technol. 22, 025012 (2009b).
- Inosov et al. (2011) D. S. Inosov, J. T. Park, A. Charnukha, Y. Li, A. V. Boris, B. Keimer, and V. Hinkov, Phys. Rev. B 83, 214520 (2011).
- Perdew and Wang (1992) J. P. Perdew and Y. Wang, Phys. Rev. B 45, 13244 (1992).
- Singh (1991) D. Singh, Phys. Rev. B 43, 6388 (1991).
- Sjöstedt et al. (2000) E. Sjöstedt, L. Nordström, and D. J. Singh, Solid State Commun. 114, 15 (2000).
- Blaha et al. (2001) B. Blaha, K. Schwarz, G. K. H. Madsen, D. Kvasnicka, and J. Luitz, WIEN2k: An Augmented Plane Wave Plus Local Orbitals Program for Calculating Crystal Properties, Techn. Universit t Wien, Wien, Austria (2001), see http://www.wien2k.at.
- Blöchl et al. (1994) P. E. Blöchl, O. Jepsen, and O. K. Andersen, Phys. Rev. B 49, 16223 (1994).
- Yang et al. (2011) L. Yang, B. Xie, B. Zhou, Y. Zhang, Q. Ge, F. Wu, X. Wang, X. Chen, and D. Feng, J. Phys. Chem. Solids 72, 460 (2011).
- Ummarino (2011) G. A. Ummarino, Phys. Rev. B 83, 092508 (2011).
- Paglione and Greene (2010) J. Paglione and R. L. Greene, Nature Phys. 6, 645 (2010).
- Tortello et al. (2010) M. Tortello, D. Daghero, G. A. Ummarino, V. A. Stepanov, J. Jiang, J. D. Weiss, E. E. Hellstrom, and R. S. Gonnelli, Phys. Rev. Lett. 105, 237002 (2010).
- Golubov et al. (2009) A. A. Golubov, A. Brinkman, Y. Tanaka, I. I. Mazin, and O. V. Dolgov, Phys. Rev. Lett. 103, 077003 (2009).