Universal Response Curve for Nanowire Superconducting Single-Photon Detectors
Abstract
Using detector tomography, we investigate the detection mechanism in NbN-based superconducting single photon detectors (SSPDs). We demonstrate that the detection probability uniquely depends on a particular linear combination of bias current and energy, for a large variation of bias currents, input energies and detection probabilities, producing a universal detection curve. We obtain this result by studying multiphoton excitations in a nanodetector with a sparsity-based tomographic method that allows factoring out of the optical absorption. We discuss the implication of our model system for the understanding of meander-type SSPDs.
I Introduction
Nanowire Superconducting Single Photon Detectors (SSPDs) Goltsman2001 have high detection efficiency Marsili , low dark counts, low jitter and a broadband absorption spectrum Verevkin2002 . This makes them suitable for many applications including quantum optics Stevens2010 ; Zinoni2007 ; GisinnatureP ; RenemaPRA , quantum key distribution Hadfield2006 ; Collins2007 , optical coherence domain reflectometry Mohan2008 and interplanetary communication Boroson2009 . These detectors typically consist of a thin nanowire (4 nm x 100 nm) of superconducting material, such as NbN Goltsman2001 , TaN Engel2012 , NbTiN Dorenbos2008 , Nb Annunziata2009 , or WSi Marsili , which is typically fabricated in a meander shape to cover an active area of 25-1600 m Mattioli2012 . The absorption of a single photon in the nanowire results in the creation of a a region with a non-equilibrium concentration of quasiparticles. When the nanowire is biased close to the critical current, this perturbation causes a transition from the superconducting to the resistive state, producing a voltage pulse in the external circuit.
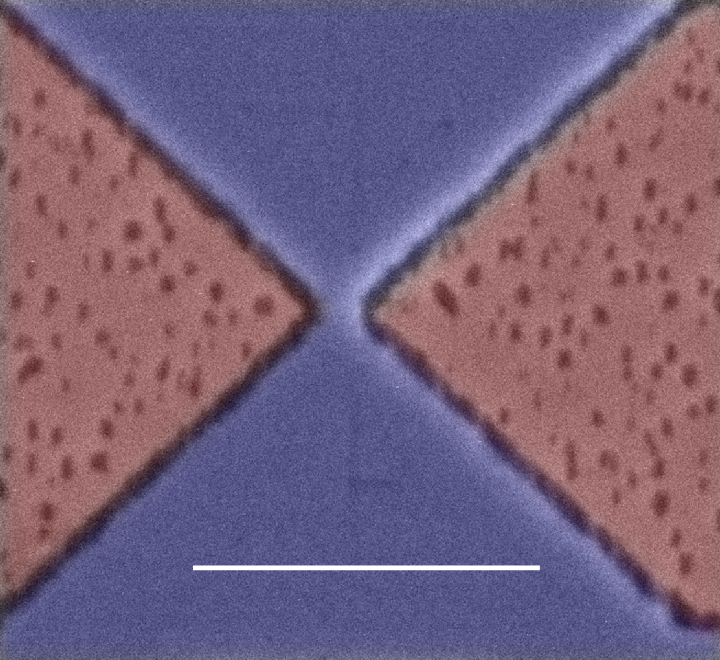
While progress has been made in understanding the detection process, many crucial features of the process are still unknown. In this publication, we investigate the detection process by means of a model system: an NbN nanodetector Bitauld2010 (see figure 1). This detector has a single cross section of wire as its active element, defined by a bowtie-shaped constriction. We investigate this system with sparsity-based detector tomography. The tomographic method does not require a model of the device, which makes it ideally suited as a tool for investigating the working principle of a detector of which the working mechanism is not fully understood yet.
It has long been known that at lower bias current, the detector operates in a regime where multiple photons are necessary to break the superconductivity Goltsman2001 ; Zhang2003 . In a nanodetector, the geometry is such that many multiphoton processes play a strong role Bitauld2010 ; Renema2012 . This enables us to probe the response of the device to excitations at different energies simultaneously. The role of detector tomography is to extract the effects of the various multiphoton excitations.
In this paper, we investigate the detection process by combining tomography and a nanodetector. With this combination, we can probe the system in a way that is independent of the incoupling efficiency of light into the detector. Moreover, because we tune the energy of the excitation via the number of photons at the same wavelength, we are insensitive to wavelength-dependent effects in the setup. This combination allows us to focus on the fundamentals of the detection process. We demonstrate that for intrinsic detection probabilities ranging from 0.3 to , the detection probability depends only on a specific linear combination of bias current and excitation energy. Thus, we obtain a universal detection curve for our model system of an SSPD: for each bias current and excitation (photon) energy, the detection probability is given by a point on this single curve. This universal curve stretches from the regime where photodetection is almost deterministic (given that the photon is absorbed into the active area) to the regime where fluctuations in the wire are thought to play a role in assisting the detection process.
II Experiment
All experiments in this work were performed on a nanodetector (see Fig 1). The nanodetector consists of 4 nm thin NbN wire on a GaAs substrate, shaped into a 150 nm wide bowtie geometry. The device was fabricated via a combination of DC magnetron sputtering Gaggero2010 , electron-beam litography, reactive ion etching and evaporation of the metal contacts Bitauld2010 . In previous work Renema2012 ; Bitauld2010 , it was shown that such a detector has multiphoton regimes based on the bias current. The physical mechanism behind these multiphoton regimes is that at relatively low bias currents, multiple photons are required to supply a sufficient perturbation for the superconductivity to be broken.
The device was cooled in a two-stage pulse-tube / Joule-Thompson cryocooler to a temperature of approximately 1.2K. The nanodetector was illuminated using a lensed fiber mounted on cryogenic nanomanipulators. At this temperature, the overall system detection efficiency for single photons was around our working point at A (A) . This low efficiency is attributable to the mismatch between the device active area and the size of the illumination spot. The device was operated in a voltage bias regime, using a low-noise voltage source (Yokogawa GS200) in series with a 10 resistor. The detector was biased through the DC port of a bias tee, and the RF signal was amplified in a 45 dB amplifier chain.
The device was illuminated with a Fianium Supercontinuum laser, whose pulse duration was specified to be 7 ps. It is crucial for this experiment that the pulse duration is shorter than the lifetime of an excitation, which was measured to be several tens of picoseconds Ilin2000 ; Rall2010 ; Zhou . If the pulse duration is longer than that, it is possible to have a pulse which produces two excitations which are far enough apart in time that one has died out before the second is created; this will therefore not result in a multiphoton excitation.
We confirmed that our laser produces coherent states, measuring in a separate experiment. Furthermore, we measured that the intensity fluctuations in the laser are below 2%. Hence, the laser is suitable for tomography Feito2009 . The detector was illuminated with narrowband light at wavelengths of 1000 nm, 1300 nm and 1500 nm (= 10 nm). In our experiment, we vary the intensity and wavelength of the input light, at various bias currents. At each of these settings, we record the count rates in a 0.1 s time window and repeat the experiment 10 times per measurement setting. In the current regime investigated in the present experiment, the detector has negligible dark counts (< 1 / s).
III Tomography of multiphoton excitations
In order to distinguish the effects of the various photon numbers in the laser pulses, we make use of a sparsity-based tomographic protocol. We give here a brief summary of this protocol (for a full description, see ref Renema2012 , where we introduced this technique). We illuminate the detector with a range of coherent states, and record the detection probability . We make use of two properties of coherent states: first, that a coherent state under attenuation remains coherent, second that the decomposition of the coherent state in the Fock basis is completely determined by the mean photon number, which can be determined by measuring the intensity 111Since we have a phase-insenstive detector, the phase of the coherent state amplitude is irrelevant, and we set it to zero throughout this paper for simplicity.
Each illumination intensity probes the detector with a different linear combination of photon number states, introducing different combinations of multiphoton excitations. In particular, we model the detection probability by:
| (1) |
where is the incoupling efficiency and N is the mean photon number of the incident coherent state. The linear efficiency appears separately, since our protocol enables us to distinguish linear processes - such as incoupling to the NbN film - from nonlinear processesRenema2012 . The are the quantities of interest in further analysis: they describe the probability of a detection event, given the absorption of photons in the active area of the detector.
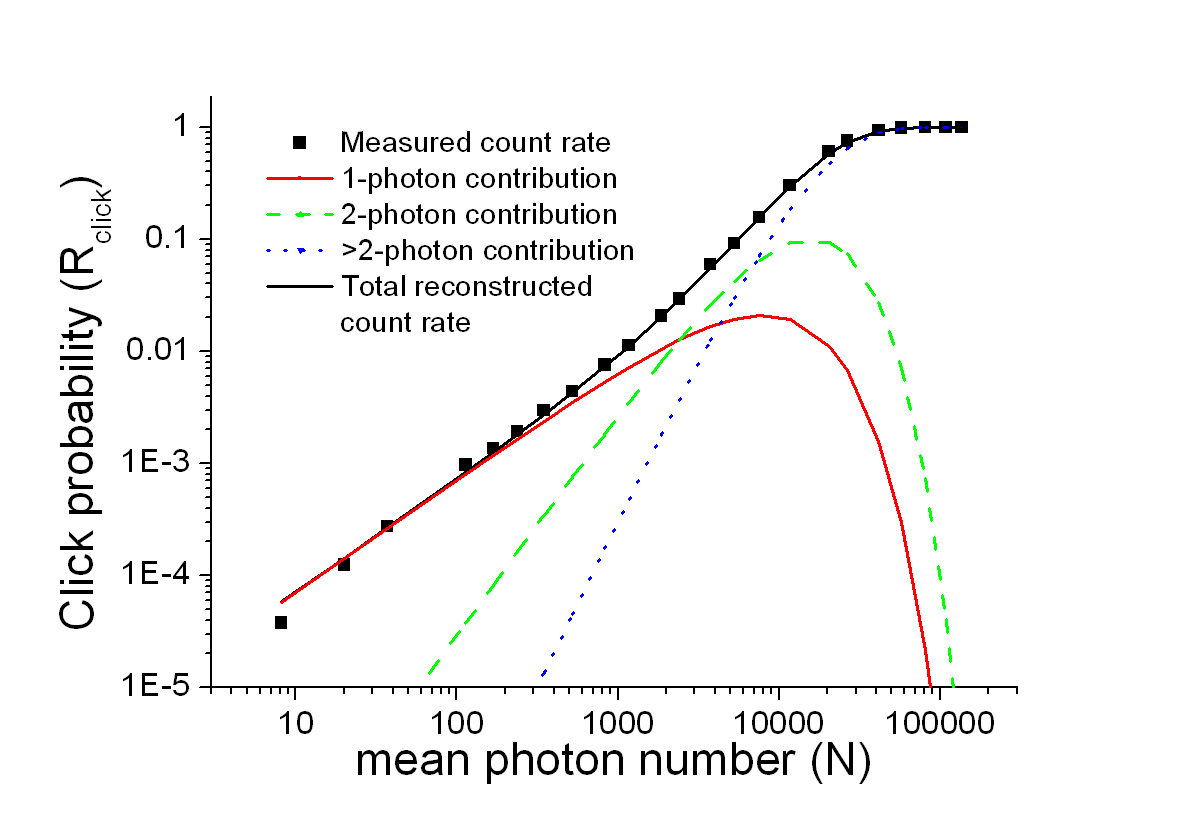
Fig. 2 illustrates this protocol as applied to a single experimental run for a given bias current. We vary the incident power, observe the detection probability, and apply the tomographic protocol to find the contributions from the various multiphoton excitations. The black squares indicate the measured count probability, approaching 1 as the detector saturates. The red, green and blue lines indicate the contribution from one photon, two photons and higher photon numbers, respectively. Only a limited number of multiphoton excitations is resolvable, and this number depends on bias current. The rest is lumped into a remainder term containing the limit of high photon numbers and is not used in further analysis. The fact that at various powers different multiphoton processes are dominant enables us to recover them all from a single experiment. Furthermore, since the linear efficiency only rescales the effective incident photon number, but does not alter its shape (corresponding to a simple shift in Fig 2), we are also able to distinguish finite incoupling effects from effects due to multiphoton excitations.
IV Results
Figure 3 shows the reconstructed detection probabilities , as a function of bias current and three different wavelengths. For each wavelength and current, we independently perform the tomographic procedure outlined in Section III and obtain a full set of parameters We observe that as the current is lowered, the detector makes a transition from being a one-photon threshold detector to a two-photon threshold detector, and so on. Furthermore, we observe that the response curves at different photon numbers and wavelengths have the same shape. We note that as the excitation energy becomes higher and the photon number larger, the points on our curves become more scattered, indicating that the tomography procedure becomes less accurate.
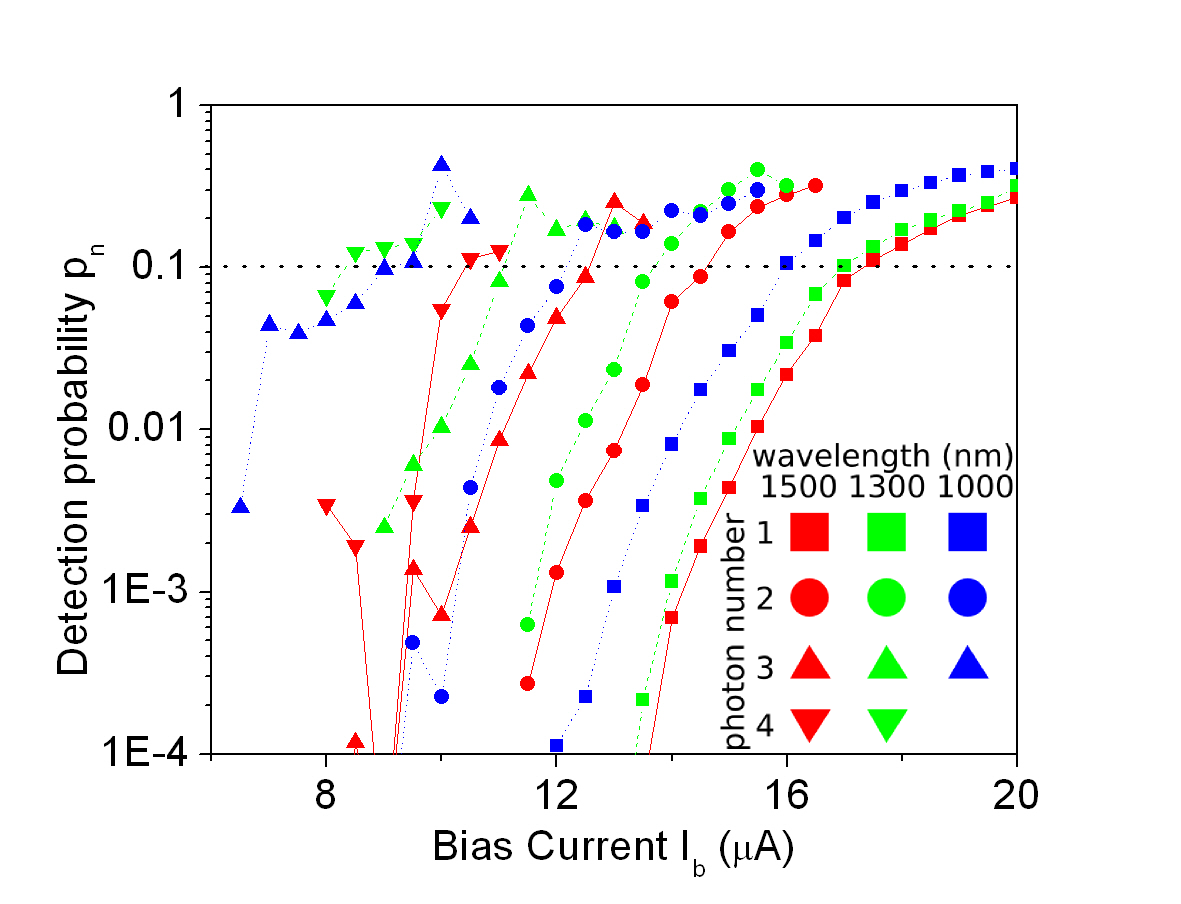
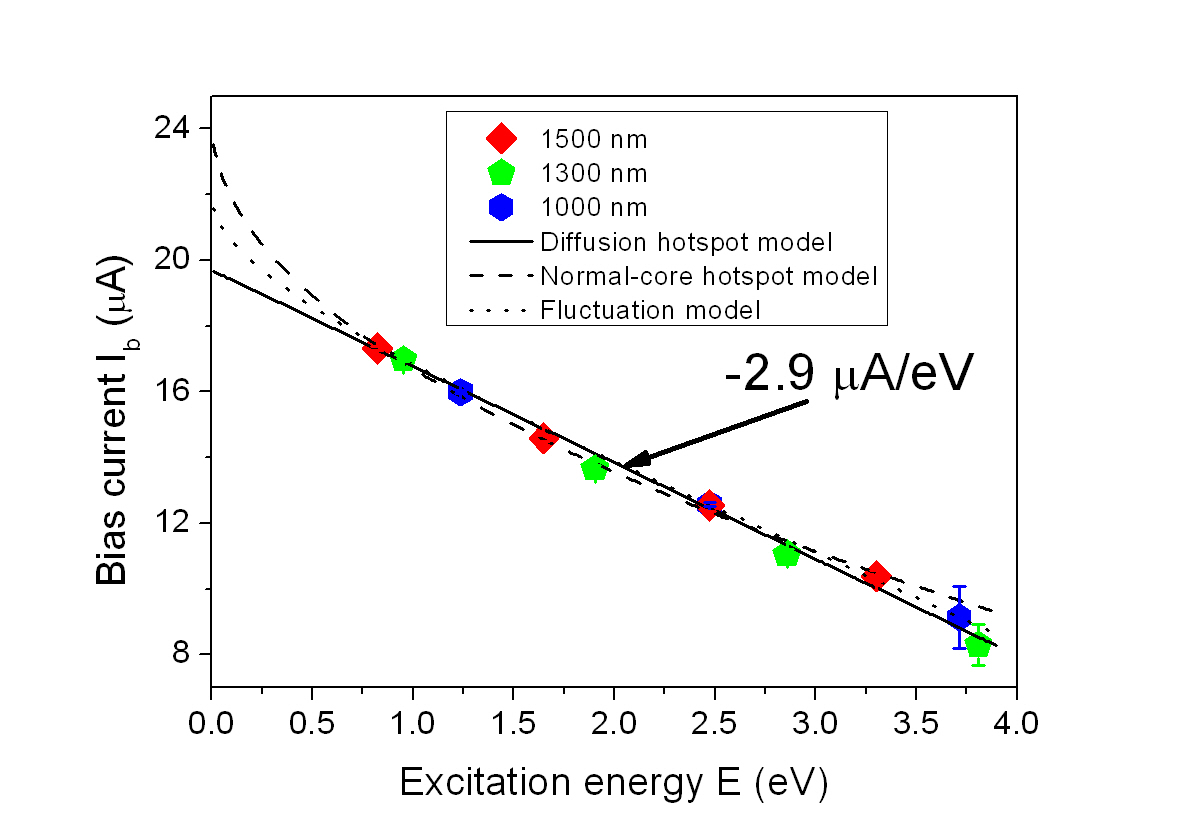
Figure 4 shows the bias current required to reach a detection probability of 10%, as a function of total excitation energy. In order to obtain this figure, we took a surface of constant in Fig. 3 (indicated by a dotted line), and plotted the bias current at which the detector has 10% probability of responding to an energy , where is the total energy of the photons absorbed by the detector. This figure demonstrates that there is a scaling law between bias current and overall excitation energy. We determine the scaling constant to be = -2.9 in SI units) for our detector. Furthermore, this figure shows that the detection probability is independent of the way in which the excitation is composed of different photons: only the overall energy determines the detection probability. We note that we have used only a small fraction of the data present in figure 3 to obtain the data presented in figure 4.
We compare three models from literature to our data. We find that over the range of the experiment, all three models are consistent with our data. The three models are a hotspot-based model, a hotspot-based model in which diffusion plays a large role and a fluctiation-assisted model. For a full description of the three models, see Appendix. These models distinguish themselves not only by different detection mechanisms, but also by different scaling between bias current and energy at constant detection efficiency.
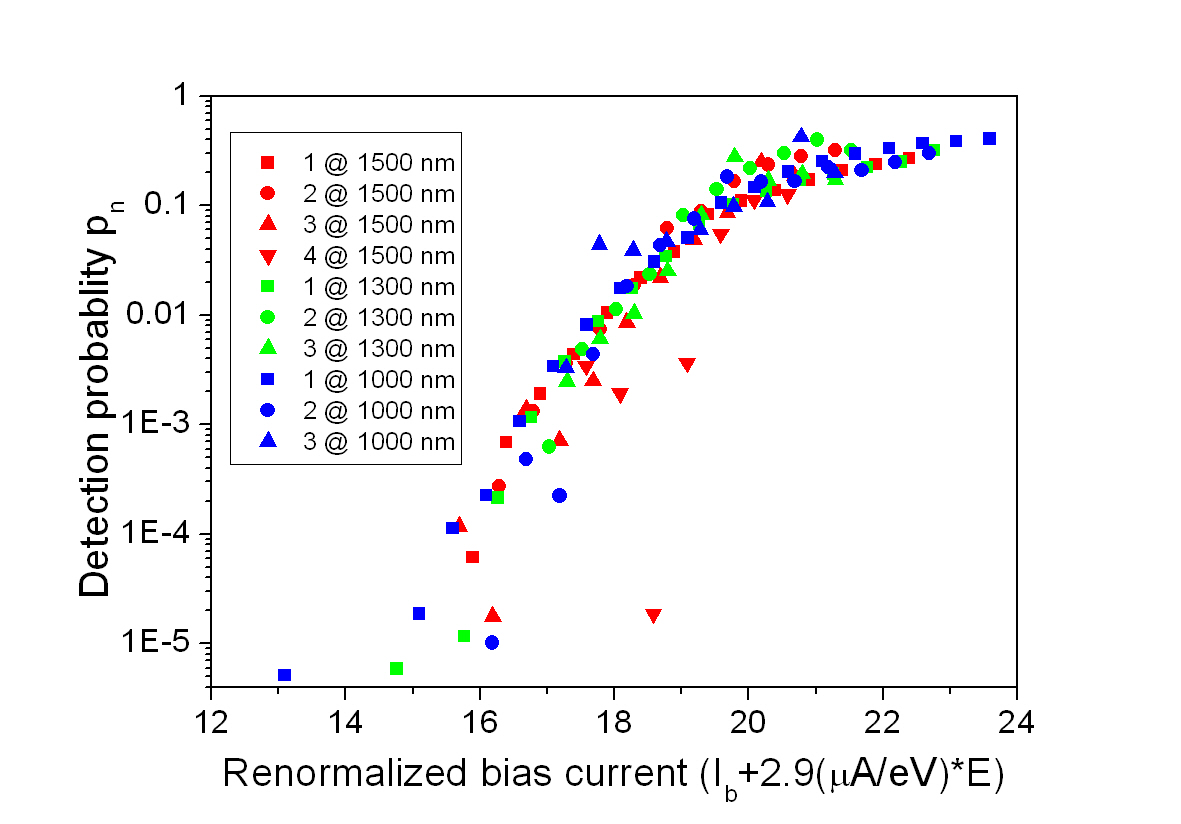
Figure 5 presents the main result of our paper: a universal detection curve for a single line-segment of an NbN SSPD. In Fig. 5, we apply the scaling law, which was derived from the points around to the entire data set. We find that all the curves of detection probability as a function of rescaled bias current superimpose over more than 3 orders of magnitude in the detection probability. This shows that the photoresponse of our detector depends only on this specific combination of bias current and excitation energy. We stress that this universal curve can only be obtained through detector tomography, which allows separation of the effects of multiphoton excitation and finite linear efficiency.
The data presented in Fig. 5 shows that the scaling behaviour which we obtained at in figure 4 is universal for all values of . Since we have used only the points in figure 3 which lie around to obtain the result in figure 4, we do not a priori expect the curves to superimpose when we apply the scaling law to the entire dataset. In such a procedure, only the points which are used to obtain the scaling factor are guaranteed to superimpose. Since the curve is universal over more than 4 orders of magnitude in the detection probability, we have demonstrated that our results are independent of the arbitrary choice of the 10% criterion. The criterion only matters for the accuracy with which the curves can be superimposed: we find from theoretical simulations that the tomographic reconstruction is most accurate between and This justifies the choice of our criterion.
V Discussion
In this section, we first compare our experimental method with that of previous studies on SSPDs. Then, we discuss our experimental findings on the universal curve, quasiparticle conversion efficiency. Lastly, we discuss the phenomenon of dark counts in our detector.
V.1 Comparison with previous work
Previous investigations of the SSPDs detection mechanism were of a semiclassical nature, where only the efficiency and dark count rate were measured. By observing the exponent of the power-law dependence of count rate on input power, one can also infer the photon number detection regime semiclassically. However, such a characterization is limited to the observation that the detector is operating in a particular detection regime; a measurement of the (i.e. how strongly the detector is in a particular regime) requires detector tomography. Since the width of each multiphoton regime is 2 A for our experiment, the accuracy of the semiclassical method is rather limited. In order to characterize multiphoton processes beyond that resolution, detector tomography is an absolute requirement.
Most previous work focussed on meander detectors, which is the geometry that is normally used in practical applications of SSPDs. In a meander, two photons that are absorbed in different places along the wire do not constitute a two-photon event, yet they may still produce one-photon events individually. By using a nanodetector, we sidestep any question of how the photons distribute themselves along the length of the wire, which was a major issue in measuring multiphoton effects in meander-type SSPDs Akhlaghi2009 ; Akhlaghi2009a .
Our present work probes the detection mechanism at various energies simultaneously. We are insensitive to incoupling losses, since they affect the various multiphoton processes equally. Furthermore, since we can perform excitations at different energies with the same wavelength, we are insensitive to any wavelength-dependent effects in the experiment, including wavelength-dependent absorption in the NbN layer.
V.2 Universal curve
The universal curve which we demonstrate in Fig. 5 is not predicted by any of current SSPD photodetection models. Typically, such models focus on calculating a single threshold bias current , above which the energy of a photon is large enough to deterministically break the superconductivity. Above that current, the efficiency of the detector should be constant. We have shown in the present work that scaling behaviour extends not just to a single threshold current, but to all combinations of currents and excitations in the present experiment. Scaling behaviour applies whether one is in the regime of high effiency or not. This points to the fact that a single theory should describe detection events in SSPDs, both in the high and low-efficiency regimes.
V.3 Quasiparticle conversion efficiency
The fact that only the overall energy of the excitation determines the response of the photodetector can be interpreted in terms of the cascade process that is generated by the initial excitation. This process, which is thought to involve both electrons and phonons in the film, and in which the mutual exchange of energy between the electron and phonon subsystem plays a key role, is still poorly understood. In the present work, we probe this cascade process with different initial excitations, and show that it is only the overall energy which determines the total number of quasiparticles which are produced at the superconducting band-edge. The fact that four excitations of a quarter of the energy produce the same number of QP as a single excitation with the full energy is evidence of the fact that the conversion efficiency by which the energy of the first QP is distributed over many others is independent of the initial energy.
V.4 Dark counts
We now turn to the phenomenon of dark counts. The most straightforward model is the following: one simply considers a dark count as an excitation with E = 0. Extrapolating the linear scaling law from Fig. 4 to yields a current of 19 A. However, at this current we do not observe a dark count probability of 10% as one would expect from the simple model; we only observe appreciable dark counts around the critical current of 29 A. The same discrepancy applies to the other two models. We can therefore say that the picture of a dark count as a zero-energy photodetection event is not supported by our data for any current detection model of SSPDs. The anomalous behaviour of dark counts is a reminder of the danger of assuming a detection model, further demonstrating the relevance of our tomographic method. In particular in this case, the tomographic method gives the first hints of substantial differences in detection mechanism between dark counts and light counts. We note that the nature of dark counts is still open to debate Bulaevskii2011 ; Gurevich2012 ; Gurevich2008 .
V.5 Outlook
The present work opens up the possibility of testing the various models of photodetection. This could be done by performing the present experiment in the mid-infrared. For this energy range the predictions of the various models differ significantly (see Fig. 4). For example, at an excitation wavelength of 5 m, corresponding to 0.25 eV, the difference between the predictions of the various models is easily measurable; it is of the order of 1 A.
Multiphoton excitation has the practical advantage that the bandwidth of energy excitations which is offered can be extended by a factor equal to the number of photons in the highest excitation (in our case, 4). This has applications in the situation where light of a particular wavelength is difficult to couple onto a cryogenic sample. In particular, the present work opens up the possibility of studying NbN detector behaviour in an energy range that corresponds to the near and medium UV range, using visible and NIR optics.
In a previous publication Zhou , we have introduced the notion of the nonlinear response function (NRF) which measures the instantaneous detection probability, given that a bias current of is present, and that there are quasiparticles in the detector. The overall detection probability is then given by R =, where is the instantaneous intensity. This function can be probed by various means such as a pump-probe experiment. The description in terms of a NRF is well-matched to a tomographic experiment, as both are model-independent descriptions.
The holy grail of tomographic research on SSPDs would be to find the instantaneous detection probability as a function of the number of quasiparticles present at that instant. In the present experiment, we have achieved a step towards this goal: we have demonstrated the NRF to be of the form over the energy range of the experiment, for short-pulse excitations.
VI Conclusions
In conclusion, we have studied the physics of photodetection in a superconducting single photon detector. We have shown that the detection is based on the overall energy of the excitation. Furthermore, we have demonstrated a scaling law between overall excitation energy and bias current. From this, we find a universal response curve that depends only on a given combination of bias current and excitation energy. Thereby, we have shown that the known behaviour of the detector extends into the multiphoton range. These results demonstrate that the tomographic method is a useful tool for investigating the fundamenal physics of detection events in NbN SSPDs.
Acknowledgements.
We thank D. Sahin for providing the SEM image of the detector. We thank Prof. G. Goltsman, Prof. P. Kes, Prof. J Aarts, Prof. R. Gill, Q. Wang and R. J. Rengelink for useful discussions. This work is part of the research programme ’Nanoscale Quantum Optics’ of the Foundation for Fundamental Research on Matter (FOM), which is financially supported by the Netherlands Organisation for Scientific Research (NWO) and is also supported by NanoNextNL, a micro- and nanotechnology program of the Dutch Ministry of Economic Affairs, Agriculture and Innovation (EL&I) and 130 partners, and by the European Commission through FP7 project Q-ESSENCE (contract No. 248095).Appendix: detection models in SSPDs
.1 Introduction
While big strides have been taken Engel ; Gurevich2012 ; Gurevich2008 ; Bulaevskii2011 in understanding the fundamental physics of these detectors, many details of the detection mechanism in such detectors are still unknown. After the absorption of a photon, it is thought that the resulting high-energy electron destroys Cooper pairs that carry the bias current, producing a cloud of quasi-particles Semenov2005 ; Hofherr2010 . This process results in a breakdown of the superconductivity, resulting in a normal cross-section. After such a resistive barrier has formed, the kinetic inductance of the device drives Joule heating in the normal state area Kerman2006 , causing it to grow. After that, the current drops to a negligible level Kerman2007 and the interplay between the cooling of the device and the restoration of the current determines whether the device returns to its previous state, ready to detect another photon.
Currently, there is no consensus on a microscopic model for the detection event in superconducting single photon detectors. Below, we briefly introduce three microscopic models for detection events in the SSPD from literature. We refer to these three as the normal-core hotspot model, the diffusion hotspot model and the fluctuation model. Each of these models predicts that the energy and current are exchangeable through a given scaling law, and their prediction will be compared with the experimental data below.
.2 Three models
The normal-core hotspot model was introduced in the original papers reporting photodetection with SSPDs Goltsman2001 ; Semenov2001 . In this model, it is assumed that the photon absorption creates a normal core inside the material. Current is then diverted around this core. If the current locally exceeds the critical current, superconductivity is destroyed and a normal state slab is created, resulting in a detection event. In this model, the current required to pinch off the entire channel for a given input energy scales as the square root of the energy, since the hotspot is assumed to be a cylindrical object inside the wire. For a given energy, the bias current needed to achieve maximal detection efficiency is then given by:
| (2) |
where E is the energy of the photon, is the bias current and is the critical current. is the width of the wire and is a scaling constant, which is defined in this way for consistency with previous work Suzuki2011 .
In the diffusion-hotspot model, which was introduced later as a refinement of the original normal-core hotspot model, the role of the diffusion of quasiparticles is taken into account, as well as the reduction of the critical current due to the quasiparticles Engel ; Semenov2005 . In this model, the relevant lengthscale is given by the diffusion length over a time characteristic for the cascade of quasiparticles. This expression, which was first derived in Ref. Semenov2005 , predicts linear scaling between bias current and cutoff energy:
| (3) |
where is an energy scale Hofherr2010 .
Fluctuation model The previous two models predict a sharp cutoff of the detection efficiency as a function of photon energy, which is not observed in experimentsHofherr2010 . In order to explain the observed detection probability beyond the cutoff energy, fluctuation-assisted detection models have been proposed Bulaevskii2011 ; Semenov2005 ; Gurevich2008 ; Gurevich2012 . All of these have in common that the role of the photon in the detection process is to depress the superconducting gap. Subsequently, a thermally activated fluctuation occurs, such as the depairing of a vortex-antivortex pair (VAP) Semenov2008 in the superconductor or the crossing of a single vortex. This fluctuation must overcome an energy barrier Bulaevskii2011 . Expressions for such energy barriers typically contain a gap-dependent energy scale and a current-dependent geometric factor Hofherr2010 . The specifics of the geometric factor depends on the precise fluctuation process. Both for the VAP model and for the single-vortex crossing model, we can linearize the current-dependence of the geometric factor over the range of currents that was used in the experiment, to obtain:
| (4) |
where the constants and are known from the linearization of the geometric factor, and A and are the experimental fit parameters. Such a model predicts a hyperbolic interchange between energy and current.
We note the following subtle point: to obtain figure 4, one must introduce an arbitrary cutoff criterion, which we have chosen to be (see main text). This introduces an offset in the parameters of each model, in particular in the parameter which describes the behaviour at E = 0. We have constructed the expressions for each model such that the choice of cutoff manifests itself as an offset in a single parameter, namely the current scale appropriate for that model. The parameters reported below are independent of the choice of the cutoff criterion.
.3 Comparison with experimental results
We apply the three detection models to the results in Figure 4, and compare the results with the values from literature. For the normal-core hotspot model, we find eV-1/2/ nm, which should be compared to the values of eV-1/2/ nm found in other experiments Verevkin2002 . For the diffusion hotspot model, we apply the expression from Ref. Hofherr2010 , to find a theoretical value of = -2.5 A/eV for our sample and = -3.5 A/eV for the samples in that reference, which should be compared with the value of = -2.9 0.1 A/eV obtained experimentally. For the fluctuation model, we find which should be compared to a literature value of for the experiment reported in Ref. Semenov2008 . We note, however, that comparisons between different detectors are problematic. In particular, the conversion efficiency of the initial excitation to quasiparticles at the gap edge is a free parameter which varies from detector to detectorHofherr2010 .
The error analysis on the quantities given in the previous paragraph was based on the 50 nA accuracy of the current readout of our experiment, combined with error propagation on the interpolation formula used to obtain the intersection with the line . For low , the former error dominates. At higher , we are limited by the quality of our tomographic reconstruction. We calculate per degree of freedom to be 2.2, 2.9, and 2.1 for the normal-core hotspot, diffusion hotspot and fluctiation models, respectively. These numbers do not enable us to conclusively rule out any of the models.
In the normal-core hotspot model, multiphoton events can only occur if the various normal cores are created at the cross-section of the wire. Given the relative size of our detector and the size of the normal cores in this hotspot model, we would expect to see reduced count rates at high photon numbers due to the low probability of several photons being absorbed at exactly the same point in our detector. The fact that we do not observe such reduced count rates suggests that in our experiment, the size of the hotspot is comparable to the size of our detector.
Acknowledgements.
References
- [1] Mohsen K Akhlaghi, A Hamed Majedi, and Jeff S Lundeen. Nonlinearity in Single Photon Detection : Modeling and Quantum Tomography. Opt. Express, 19:21305–21312, 2011.
- [2] Mohsen Keshavarz Akhlaghi and Amir Hamed Majedi. Semiempirical Modeling of Dark Count Rate and Quantum Efficiency of Superconducting Nanowire Single-Photon Detectors. IEEE Trans. Appl. Supercond., 19(3):361–366, 2009.
- [3] A.J. Annunziata, D.F. Santavicca, J.D. Chudow, L. Frunzio, M.J. Rooks, A. Frydman, and D.E. Prober. Niobium Superconducting Nanowire <newline/>Single-Photon Detectors. IEEE Transactions on Applied Superconductivity, 19(3):327–331, June 2009.
- [4] David Bitauld, Francesco Marsili, Alessandro Gaggero, Francesco Mattioli, Roberto Leoni, Saeedeh Jahanmirinejad, Francis Lévy, and Andrea Fiore. Nanoscale optical detector with single-photon and multiphoton sensitivity. Nano Lett., 10(8):2977–81, August 2010.
- [5] D. M. Boroson, J. J. Scozzafava, D. V. Murphy, and B. S. Robinson. The Lunar Laser Communications Demonstration (LLCD). 2009 Third IEEE International Conference on Space Mission Challenges for Information Technology, (Llcd):23–28, July 2009.
- [6] L. Bulaevskii, M. Graf, C. Batista, and V. Kogan. Vortex-induced dissipation in narrow current-biased thin-film superconducting strips. Phys. Rev. B, 83(14):144526, April 2011.
- [7] R.J. Collins, R.H. Hadfield, V. Fernandez, S.W. Nam, and G.S. Buller. Low timing jitter detector for gigahertz quantum key distribution. Electron. Lett., 43(3):180, 2007.
- [8] S. N. Dorenbos, E. M. Reiger, U. Perinetti, V. Zwiller, T. Zijlstra, and T. M. Klapwijk. Low noise superconducting single photon detectors on silicon. Appl. Phys. Lett., 93(13):131101, 2008.
- [9] A. Engel, A. Aeschbacher, K. Inderbitzin, A. Schilling, K. Il’̈in, M. Hofherr, M. Siegel, A. Semenov, and H.-W. Hübers. Tantalum nitride superconducting single-photon detectors with low cut-off energy. Appl. Phys. Lett., 100(6):062601, 2012.
- [10] A. Engel, Kevin Inderbitzin, Andreas Schilling, Robert Lusche, Alexei Semenov, Dagmar Henrich, Matthias Hofherr, Konstantin Il, and Michael Siegel. Temperature-dependence of detection efficiency in NbN and TaN SNSPD. 2012.
- [11] A. Feito, J S Lundeen, H Coldenstrodt-Ronge, J Eisert, M B Plenio, and I A Walmsley. Measuring measurement: theory and practice. New J. Phys., 11(9):093038, September 2009.
- [12] A. Gaggero, S. Jahanmirinejad, F. Marsili, F. Mattioli, R. Leoni, D. Bitauld, D. Sahin, G. J. Hamhuis, R. Nötzel, R. Sanjines, and A. Fiore. Nanowire superconducting single-photon detectors on GaAs for integrated quantum photonic applications. Appl. Phys. Lett., 97(15):151108, 2010.
- [13] G. N. Goltsman, O. Okunev, G. Chulkova, A. Lipatov, A. Semenov, K. Smirnov, B. Voronov, A. Dzardanov, C. Williams, and Roman Sobolewski. Picosecond superconducting single-photon optical detector. Appl. Phys. Lett., 79(6):705, 2001.
- [14] A. Gurevich and V. Vinokur. Size Effects in the Nonlinear Resistance and Flux Creep in a Virtual Berezinskii-Kosterlitz-Thouless State of Superconducting Films. Phys. Rev. Lett., 100(22):227007, June 2008.
- [15] A. Gurevich and V. Vinokur. Comment on Vortex-assisted photon counts and their magnetic field dependence in single-photon superconducting detectors. Phys. Rev. B, 86(2):026501, July 2012.
- [16] Robert H. Hadfield, Jonathan L. Habif, John Schlafer, Robert E. Schwall, and Sae Woo Nam. Quantum key distribution at 1550nm with twin superconducting single-photon detectors. Appl. Phys. Lett., 89(24):241129, 2006.
- [17] M. Halder, A. Beveratos, M. Gisin, V. Scarani, C. Simon, and H. Zbinden. Nat. Phys., 3:692–695, 2007.
- [18] M. Hofherr, D. Rall, K. Ilin, M. Siegel, A. Semenov, H.-W. Hübers, and N. A. Gippius. Intrinsic detection efficiency of superconducting nanowire single-photon detectors with different thicknesses. J. Appl. Phys., 108(1):014507, 2010.
- [19] K.S. Ilin, M. Lindgren, M. Currie, A.D. Semenov, G.N Goltsman, R. Sobolevski, S.I. Cherednichenko, and E.M. Gershenzon. Appl. Phys. Lett., 76:2752, 2000.
- [20] Andrew J. Kerman, Eric A. Dauler, William E. Keicher, Joel K. W. Yang, Karl K. Berggren, G. Goltsman, and B. Voronov. Kinetic-inductance-limited reset time of superconducting nanowire photon counters. Appl. Phys. Lett., 88(11):111116, 2006.
- [21] Andrew J. Kerman, Eric. A. Dauler, Joel K. W. Yang, Kristine M. Rosfjord, Vikas Anant, Karl K. Berggren, Gregory N. Goltsman, and Boris M. Voronov. Constriction-limited detection efficiency of superconducting nanowire single-photon detectors. Appl. Phys. Lett., 90(10):101110, 2007.
- [22] F. Marsili, V. B. Verma, J. A. Stern, S. Harrington, A. E. Lita, T. Gerrits, I. Vayshenker, and B. Baek. Detecting Single Infrared Photons with 93 System Efficiency. 2012.
- [23] Francesco Mattioli, Mikkel Ejrnaes, Alessandro Gaggero, Alesandro Casaburi, Roberto Cristiano, Sergio Pagano, and Roberto Leoni. Large area single photon detectors based on parallel configuration NbN nanowires. J. Vac. Sci. Technol., 30(031204), 2012.
- [24] Nishant Mohan, Olga Minaeva, Gregory N Goltsman, Magued B Nasr, Bahaa E Saleh, Alexander V Sergienko, and Malvin C Teich. Photon-counting optical coherence-domain reflectometry using superconducting single-photon detectors. Opt. Express, 16(22):18118–30, October 2008.
- [25] D Rall, P Probst, M Hofherr, S Wünsch, K Il’in, U Lemmer, and M Siegel. Energy relaxation time in NbN and YBCO thin films under optical irradiation. Journal of Physics: Conference Series, 234(4):042029, June 2010.
- [26] J J Renema, G Frucci, Z Zhou, F Mattioli, A Gaggero, R Leoni, M J A De Dood, A Fiore, and M P Van Exter. Modified detector tomography technique applied to a superconducting multiphoton nanodetector. Opt. Express, 20(3):2806–2813, 2012.
- [27] J.J. Renema, G. Frucci, M.J.A. de Dood, R Gill, A Fiore, and M.P. van Exter. Phys. Rev. A, 86:062113, 2012.
- [28] A. Semenov, A. Engel, H.-W. Hübers, K. Il’in, and M. Siegel. Spectral cut-off in the efficiency of the resistive state formation caused by absorption of a single-photon in current-carrying superconducting nano-strips. Euro. Phys. J. B, 47(4):495–501, November 2005.
- [29] Alex D Semenov and Alexander A Korneev. Quantum detection by current carrying superconducting ®lm. Physica C, 351:349–356, 2001.
- [30] Alexei D. Semenov, Philipp Haas, Heinz-Wilhelm Hübers, Konstantin Ilin, Michael Siegel, Alexander Kirste, Thomas Schurig, and Andreas Engel. Vortex-based single-photon response in nanostructured superconducting detectors. Physica C, 468(7-10):627–630, April 2008.
- [31] Martin J Stevens, Burm Baek, Eric A Dauler, Andrew J Kerman, Richard J Molnar, Scott A Hamilton, Karl K Berggren, Richard P Mirin, and Sae Woo Nam. High-order temporal coherences of chaotic and laser light. Opt. Express, 18(2):1430–7, January 2010.
- [32] Koji Suzuki, Shigetomo Shiki, Masahiro Ukibe, Masaki Koike, Shigehito Miki, Zhen Wang, and Masataka Ohkubo. Hot-Spot Detection Model in Superconducting Nano-Stripline Detector for keV Ions. Applied Physics Express, 4(8):083101, July 2011.
- [33] A. Verevkin, J. Zhang, Roman Sobolewski, A. Lipatov, O. Okunev, G. Chulkova, A. Korneev, K. Smirnov, G. N. Gol’tsman, and A. Semenov. Detection efficiency of large-active-area NbN single-photon superconducting detectors in the ultraviolet to near-infrared range. Appl. Phys. Lett., 80(25):4687, 2002.
- [34] J. Zhang, W. Slysz, A. Pearlman, A. Verevkin, Roman Sobolewski, O. Okunev, G. Chulkova, and G. Goltsman. Time delay of resistive-state formation in superconducting stripes excited by single optical photons. Phys. Rev. B, 67(13):132508, April 2003.
- [35] Zili Zhou, Giulia Frucci, Francesco Mattioli, Alessandro Gaggero, Saeedeh Jahanmirinejad, Thang Ba Hoang, and Andrea Fiore. Ultrasensitive N -photon interferometric autocorrelator. 2012.
- [36] C. Zinoni, B. Alloing, L. H. Li, F. Marsili, A. Fiore, L. Lunghi, A. Gerardino, Yu. B. Vakhtomin, K. V. Smirnov, and G. N. Goltsman. Single-photon experiments at telecommunication wavelengths using nanowire superconducting detectors. Appl. Phys. Lett., 91(3):031106, 2007.