Analytical Expressions For Light-Curves
Of Ordinary And Superluminous Supernovae Type Ia
Abstract
Supernovae of type Ia (SNeIa) can be produced by the explosion of slowly-rotating carbon-oxygen white dwarfs whose mass increases beyond a critical value by mass accretion. Collision with circumstellar material during their photospheric and early nebular phase can enhance the bolometric luminosity of otherwise ordinary SNeIa to become superluminous. A few simplifying assumptions lead to a simple analytic master formula, which describes quite well the bolometric light-curves of ordinary SNeIa and supeluminous SNeIa in terms of few initial physical parameters. Other main properties of SNeIa, including the empirical ’brighter-slower’ Phillips’ relation that was used to standardize ordinary SNeIa as distance indicators and led to the discovery of the accelerating expansion of the universe, are reproduced.
1 Introduction
Despite large observational, theoretical and numerical efforts over decades, supernovae explosions are not fully understood. Standard stellar evolution theory predicts that stars with initial mass end their short life in core-collapse supernovae explosions, while long-lived stars of mass eject most of their outer layers, leaving a carbon oxygen (C-O) white dwarf (WD) that cools slowly by radiation, possibly for billions of years. If the mass of such a C-O WD increases by accretion and approaches the Chandrasekhar mass limit, (Chandrasekhar 1931), its core temperature rises and triggers a runaway thermonuclear explosion (Hoyle and Fowler 1960) in which no central object is left over. In such explosions, most of the nuclear binding energy release is converted to kinetic energy of the debris of type Ia supernova (SN), while the observed bolometric light-curve is powered mainly by the decay of the relatively long-lived end-product radioactive elements that were synthesized in the explosion (Colgate & McKee 1969).
As the progenitors of core-collapse SNe are much more luminous than WDs, they have been identified from archival images on multiple occasions (e.g., Smartt 2009), while there have not yet been any direct observations of the WD progenitor of an SNIa. However, the SNeIa explosion paradigm is strongly supported by several observational facts (see, e.g., Hillebrandt, & Niemeyer 2000; Maoz & Mannucci 2012; Astier 2012 and references therein) such as:
-
•
WDs are produced by long-lived stars of less than , which eject most of their outer layers, leaving a C-O WD that cools slowly by radiation, for billions of years. Indeed SNeIa are the only type of SNe observed in old stellar environments such as elliptical galaxies.
-
•
The fast exothermic nuclear fusion reactions, starting with helium capture by 12C and 16O, produce the intermediate mass elements (IME) Si, S and Ca observed in the spectrum of SNeIa but not H and He, which are lacking in the initial state and in the spectra of SNeIa.
-
•
The fast exothermic nuclear fusion reactions end with the near center production of 56Ni whose radioactive decay chain seems to power the light-curves and explain the late appearance of iron group elements’ spectral lines.
-
•
The kinetic energy of the debris, the bolometric light-curve, the spectrum and the spectral evolution of SNeIa are roughly those expected.
Two main scenarios where the mass of a WD may approach were proposed, the so called ’SD and DD scenarios’. In the single-degenerate (SD) scenario, the mass transfer is from a non-degenerate star (Whelan & Iben 1973), while in the double degenerate (DD) scenario two WDs in a tight binary merge through loss of energy and angular momentum to gravitational waves (Iben & Tutukov 1984, Webbink 1984). A third scenario where a WD may approach/cross is WD collisions in triple star systems (Kusnir eta. 2013). But despite enormous observational efforts, it is still unknown by which mechanism the mass of a WD approaches , which leads to its thermonuclear explosion. Furthermore, recent observations have put strong limits on the above scenarios (see, e.g., Maoz and Mannucci 2012 Chomiuk 2013, and references therein).
Another scenario in which WDs may reach a critical mass is mass accretion of fall-back matter by a nascent WDs in proto planetary nebulae. When the luminosity of the nascent WD decreases below the Eddington luminosity it may accrete fall-back He matter from the pulsation expulsion of the outer layers of the long-lived star of a mass less than , until reaching a central thermonuclear ignition temperature. Moreover, the SNIa debris may collide with slowly moving circumstellar mass and produce a super luminous SNIa, such as SN 2003fg (Howell et al. 2006) SN 2007if (Scalzo et al. 2010) and SN 2009dc (Silverman et al. 2011).
Because of the enormous diversity and complexity of the late phase of stellar evolution, mass expulsions and stellar explosions, it is natural to believe that only detailed numerical simulations with three dimensional hydrodynamics, thermonuclear energy release and transport by shocks, radiation and neutrinos are able to reproduce the observed light-curves and complex spectra of SNe. However, despite the complexity of SN explosions, SNeIa light-curves and spectra display an approximate ’standard candle’ behavior (see, e.g., Branch & Tammann 1992) with simple correlations between various properties, such as peak luminosity and the decline rate of light-curves following the peak luminosity (e.g., Phillips 1993; Hamuy et al. 1996a,b,c,d,; Phillips 1999; Goobar and Perlmutter 1995; Riess et al. 1996; Tripp 1998). These empirical correlations were used to standardize SNe Ia and have allowed to improve the precision of cosmic distances estimated from SNeIa observations that led to the discovery of the accelerating expansion of the universe (Perlmutter et al. 1999; Riess et al. 1998).
The nearly standard properties of SNeIa during their photospheric (ph) phase suggest that perhaps the bolometric light-curves and other general properties of SNeIa can be obtained, to a good approximation, directly from a simple model, despite the complexity of SNeIa and the details of the complex radiation transport in their ejecta. Such semi-analytic approaches have been pioneered by Colgate and McKee (1969), Arnett(1979), Colgate, Petschek and Kriese (1980), Arnett (1982). Improved semi-analytic solutions for the conversion of radioactive decay energy into the light-curves of SNe Ia have been proposed more recently, e.g., by Pinto & Eastman (2000) and Piro & Nakar (2013;2014). Here, using even a simpler analytical model, we derive the main properties of ordinary SNeIa, super Chandrasekhar SNeIa, and supeluminous SNeIa during their photospheric and early nebular phases, which depend on the 56Ni mass produced in the thermouclear explosion and the circumstellar mass. In particular, Collision with relatively slowly moving circumstellar material ejected before the SN explosion can enhance the bolometric light curve of ordinary SNeIa during their photospheric and nebular phase to appear as superluminous SNeIa or as an ”ordinary” SNeIA powered by production of a Ni56 mass that exceeds the Chandrasekhar mass limit. In a following paper we also apply the master formula to describe other types of superluminous SNe such as SNeIb and super luminous SNeII (see, e.g., Gal-Yam 2012 and references therein for the current classification of SNe)
2 Derivation of SNeIa General Properties
We adopt the current paradigm of SNeIa explosions that mass accretion by a carbon-oxygen (C-O) white dwarf that accretes fall-back matter or mass from a companion star and approaches a critical mass , raises its central temperature and triggers a thermonuclear explosion, which produces IME via deflagration (Nomoto et al. 1976, 1984) followed by a transition to detonation that converts a fraction of the IME to 56Ni whose decay chain powers the bolometric light-curves of SNe Ia (Colgate & McKee 1969; Arnett 1979; Colgate et al. 1980; Arnett 1982; Kuchner et al. 1994). The total mass of IME and iron group elements that is synthesized in the explosion, probably depends on unknown initial conditions, such as the distributions of density, composition and angular momentum in the WD progenitor when its mass approaches . For simplicity, we assume a spherical symmetry, and that that the amounts of 56Ni and IME that are synthesized in the SNIa explosion are roughly a constant fractions of . synthesized during the SNIa explosion.
2.1 The kinetic energy of the explosion:
The nuclear binding energy release per nucleon in the synthesis of C+O into typical IME, such as 28Si and 40Ca (0.62 and 0.77 MeV respectively) is not significantly different from that released in the synthesis of 56Ni (0.815 MeV). Only a small fraction of the nuclear binding energy release escapes by neutrino and photon emissions. Most of it is converted to the kinetic energy of the explosion. Moreover, when the mass of an accreting WD crosses , the sum of the gravitational binding energy and free energy of the degenerate electron gas is . Consequently, if kinetic energy of the explosion is approximately the nuclear binding energy released in the synthesis of IME and 56Ni. If approximately the entire mass is converted in the explosion to IME and 56Ni, then,
| (1) |
Hence, ergs for .
2.2 The expansion velocity
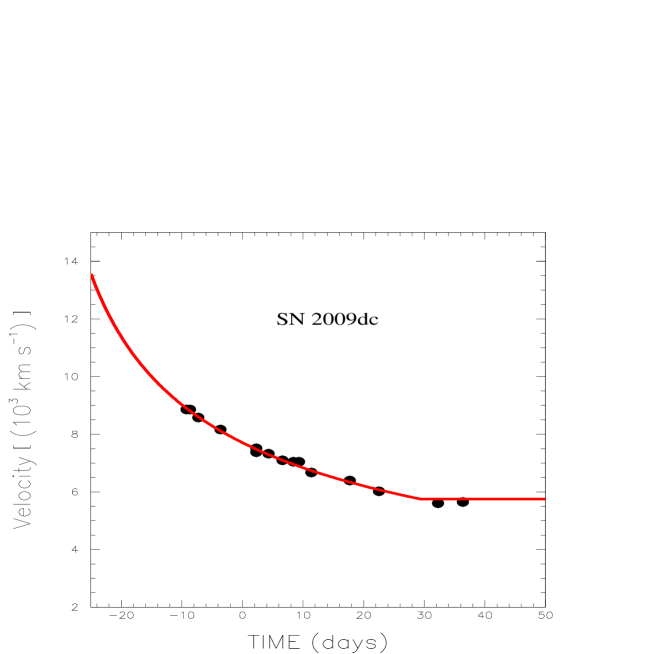
Early time spectroscopic observations of bright SNeIa show a bimodal expansion velocity (see, e.g., Childress et al. 2014). The high velocity component right after the explosion, as measured from the CA II IR triplet and Ca II H&K and from Si II 6355 is usually in the range between 20,000-30,000 km/s, while the lower velocity photospheric component as measured from the same lines and from the OI triplet and CII 6580 and CII 7234 lines is usually in the range 14,000-16,000 km/s.
The bimodal photospheric velocity probably indicates a bimodal structure, such as an homologous expansion plus a large number of higher velocity ”bullets”. Such structures were discovered in high resolution imaging of nearby young supernova remnants such as SNR Cas A (Fesen et al. 2006) and SNR 3C 58 (Fesen et al. 2007) and in nearby planetary nebulae (PNe) such as the Helix nebula (Matsuura et al. 2007, 2009), and in many other PNe. The origin of these high velocity bullets is not clear. Probably they were expelled from the stellar surface by a Rayleigh-Taylor unstable shock/detonation-front propagating from the center of the star to its surface. In all the above cases the total mass and momentum of the ”bullets” are a small fraction of the mass and momentum of the exploding star.
The expansion velocity of the SN fireball can be estimated, assuming homologous expansion, i.e., a uniform spatial density throughout the expanding mass at any moment. That implies that the expansion velocity at distance from the center satisfies where R is the radius of the fireball and is its radial expansion rate at R. Consequently, the total kinetic energy of the explosion is and the initial expansion velocity of SNeIa fireballs is .
Note that for an homologous expansion, at Early time when the SN is highly opaque to radiation, i.e., when the optical depth of the SN fireball satisfies , the photospheric radius and photospheric velocity satisfy, respectively, and .
2.3 The bolometric luminosity
Let t be the time after shock break-out. As long as the SN fireball expands into ”free space” its bolometric light-curve is powered mainly by trapping energy of gamma rays and positrons from the radioactive decay chain . Throughout the photospheric phase, the SN fireball is highly opaque to both optical photons and rays. The thermal energy density is dominated by black body radiation, i.e., , and the total thermal energy of the SN fireball is . During the photospheric phase, the SN fireball loses energy mainly by expansion, at a rate (for a constant V), and by emission of photons, which are transported to the surface by a random walk. The photon emission yields a bolometric luminosity , where is the mean diffusion time of photons to the surface by a random walk, is their mean free path and is the fireball opacity where the summation extends over all particles in the fireball (ions, neutral atoms and free electrons) with density and effective cross section . Roughly and . Hence, the mean diffusion time decreases with time roughly like and can be written as .
During the photospheric phase, the opacity is mainly due to Compton scattering off free electrons, and hence where is the Thomson cross section and is the fraction of free (ionized) electrons. Assuming that only the 3s and 3p electrons outside the neon-like closed shells core of IME such as Mg, Si, and S, and only the 4s and 3d electrons outside the argon-like closed shell core of the iron group nuclei (IGN) are ionized, one obtains and , respectively. Thus, for we expect .
During the photospheric phase, energy conservation can be approximated by
| (2) |
where is the energy deposition rate in the fireball after the thermonuclear explosion by the decay of radioactive isotopes synthesized in the explosion. The solution of Eq. (2) is
| (3) |
Consequently, the bolometric luminosity that satisfies is given by the simple analytic expression
| (4) |
For a luminosity that is powered by the radioactive decay chain , where
| (5) |
is the power supply by -rays, and
| (6) |
is the power supply by the kinetic energy loss of the positrons from the decay of 56Co, (branching ratio 19.48%, average positron kinetic energy 632.5 keV) which, presumably, are trapped by the turbulent magnetic field of the SN fireball. and are the absorbed fractions of the-ray energy in the SN fireball from the decay of 56Ni and 56Co, respectively. is the ratio of the energy released as positron kinetic energy and as -ray energy in the decay of 56Co nuclei.
For a uniformly distributed 56Ni over the entire SN fireball, these absorbed fractions are given roughly by
| (7) |
where
| (8) |
is the optical depth of the SN fireball, and is the effective cross section for energy transfer () to electrons in Compton scattering.
The effective cross section for energy deposition in Compton scattering is obtained by integrating the Klein-Nishina (KN) energy transfer differential cross section over solid angle and by averaging over all the emitted rays. In the KN domain, the average energy loss is a fraction of and where . The average -ray energies from the decay of 56Ni and 56Co are 0.53 MeV and 1.09 MeV, respectively. The corresponding effective energy transfer cross sections are and for the 56Ni and 56Co -rays, respectively. They yield and for . A single collision approximation is justified only when the SN fireball becomes semi-transparent to -rays (). A proper calculation of energy transfer in the multiple collisions when , however, has only a small effect on and yields very similar bolometric light curves.
The positrons from the -decay of 56Co (and the from the decay of other relatively long lived radioactive isotopes that were synthesized in the thermonuclear explosion) are presumably trapped in the SN fireball by its turbulent magnetic field. The decay of 56Co and from other long lived isotopes may dominate the power supply when the fireball becomes highly transparent to -rays and optical radiation during the nebular phase. During that phase, ionization and excitations by the -rays and lead to scintillation and bremsstrahlung emission, which dominate the SN emission.
2.4 Early-time and late-time luminosities
changes rather slowly with t relative to and can be factored out of the integration in Eq. (4), yielding
| (9) |
Hence, the bolometric luminosity rises initially like and has the late-time asymptotic behavior . Note that the derivation of Eq. (4) is valid only for the photospheric phase. However, its late-time behavior is also the correct behavior of during the nebular phase. Thus Eq. (9) is valid for both phases.
2.5 The luminosity peak-time
The approximate expression peaks at d for d, in good agreement with the peak-time of given by Eq. (4). The peak-time depends on (), but not on the synthesized mass of 56Ni.
2.6 The peak luminosity - nickel mass relation for ordinary SNeIa
The peak value of the bolometric luminosity satisfies It then follows from Eq. (4) that when the SN is still opaque to radiation at the peak time , the peak luminosity satisfies , which is the Arnett relation (1979). In particular for d, the Arnett relation yields
| (10) |
2.7 The color temperature during the photospheric phase
As long as the fireball is optically thick (), its continuum spectrum is approximately that of a black body, and its luminosity is given by the Stefan-Boltzmann law. For homologous expansion, the photospheric velocity decreases like , and the Stefan-Boltzmann law (as long as ) yields an effective photospheric temperature
| (11) |
where . During the transition from the photospheric phase to the nebular phase, when free-free emission and scintillations take over, the temperature decreases rather slowly.
2.8 The colour light-curves and peak times
As long as the SN fireball is optically thick, it radiates like Planck’s black body and the light-curves at a frequency satisfy
| (12) |
where is the Planck constant, is the Boltzmann constant, and . Near the peak-time of the bolometric luminosity, the temperature has the approximate behavior . Moreover, in the VBU bands, and since for , the maximum of is reached at a time
| (13) |
2.9 The peak luminosity - decline rate correlation
Although the peak intrinsic luminosity of SNeIa is not a standard candle, it appears to be correlated to the shape of their light-curves (Phillips 1993). Since 1993, various empirical correlations between the peak absolute magnitude of SNe Ia and the measured shapes of their intrinsic light-curves have been adopted for the use of SNe Ia as standard candles for distance measurements (e.g., Hamuy et al. 1996a,b,c,d; Riess et al. 1996, 1998; Perlmutter et al. 1999; Phillips et al. 1999; Goldhaber et al. 2001; Prieto et al. 2006). Most methods have used , the magnitude difference in the intrinsic B-band light-curve between maximum brightness and the brightness 15 days past it, as a measure of the decline rate. To a good approximation, the B-band luminosity is proportional to the bolometric luminosity. Hence, where is given by Eq. (10). At 32.5d, , and . Thus, . Consequently, it follows from Eqs. (5) and (10) that for ,
| (14) |
where But, , and if , then roughly
| (15) |
which may explain, e.g., the correlation with (and ) found by Hamuy et al. (1996a,b,c,d) for 18 ordinary SNeIa with a measured peak bolometric luminosity, assuming a Hubble constant .
3 Super luminous SNeIa
SNeIa explosions can become super luminous by interaction with a circumstellar matter, such as a slowly expanding proto PN. However, the unknown density distribution of the near circumstellar environment of SNeIa may be very complex. For simplicity and demonstration purposes, consider a plastic collision (c) between a fast expanding SNIa fireball with a velocity and a slowly moving circumstellar (cs) spherical shell with a velocity that begins at and ends at . Assume that the cs has a wind-like density profile, for where , . and . Neglecting momentum loss through radiation and emission of cosmic ray particles, conservation of momentum during the collision implies that where , which yield
| (16) |
Hence, the expansion velocity and radius as functionn of time are given by
| (17) |
respectively, where . The swept in circumstellar mass by is given by . The rate of mass loss by a ’constant wind’ from the progenitor before the expolosion is given by and the energy deposition rate in the SN fireball by plasic collision with this massive ’wind’ is
| (18) |
This additional power supply must be included in in Eqs. (2)-(4) as long as . During the collision, , and increases with time, roughly like . After , when , Eq. (2) yields
| (19) |
where and .
4 Comparison with observations
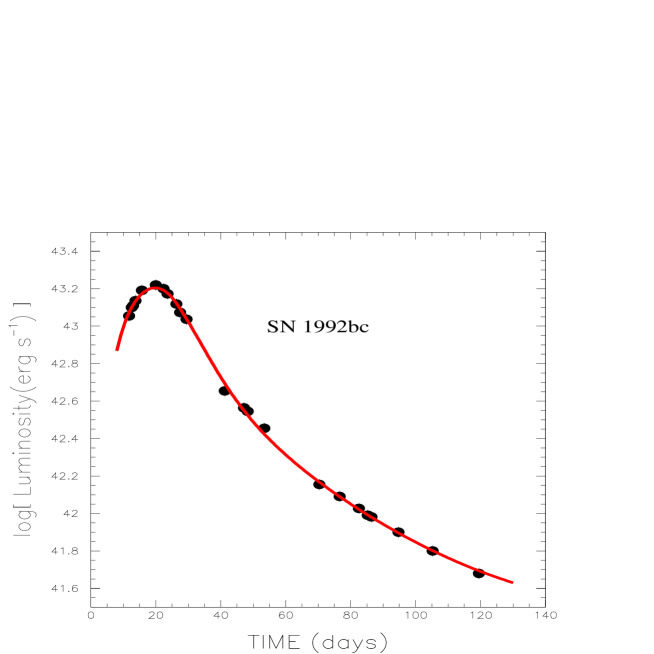
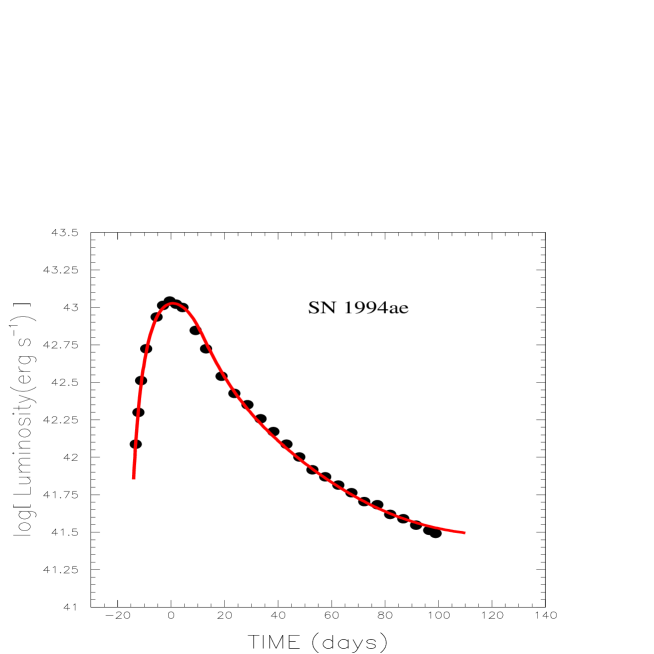
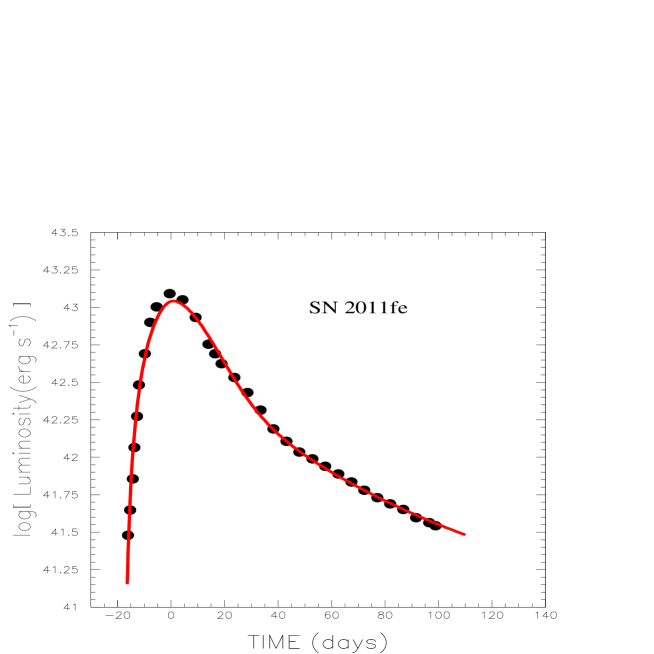
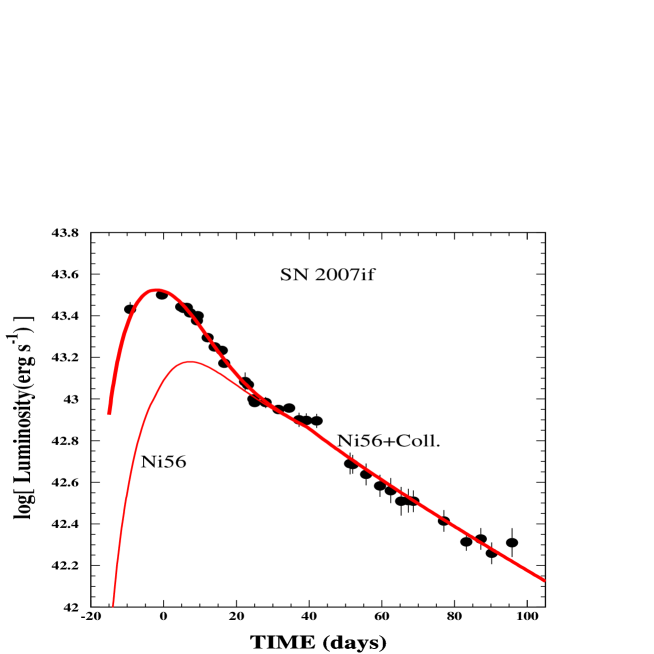
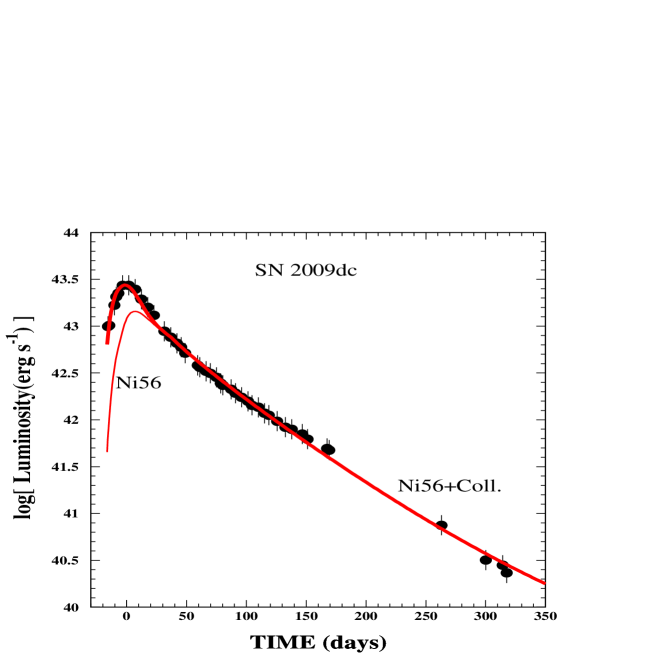
In figures 1-3 we compare our analytic expression Eq. (4) and the observed rest-frame bolometric light-curves of three representative ordinary SNeIa () that were powered by the decay of 56Ni, had a very early detection and continuous follow up: SN 1992bc (Contardo et al. 2000), SN 1994ae (Contardo et al. 2000) and SN 2011fe in M101 (Nugent et al. 2011; Munari et al. 2012). In Figures 4-5 we compare the bolometric light-curve of the superluminous SN 2007if (Scalzo et al. 2010) and SN 2009dc (Taubenberger et al. 2011) and our analytical expressions Eqs. (4)-(8) and (17)-(19) for the bolometric light curve of superluminous SNeIa assuming they are powered by the decay of 56Ni and by collision with circumstellar matter. The values of the best fit parameters are listed in Table I.
Our best fits for the ordinary SNeIa, SN 2011fe (Nugent et al. 2011; Munari et al. 2012), SN 1994ae (Contardo et al. 2000) and SN 1992bc (Contardo et al. 2000), have yielded parameters consistent with their theoretical expectations for , namely , a negligible contribution, if any, from collision, and an ordinary expansion velocity.
The best fits obtained for the superluminous SNeIa explosions SN 2007if (Scalzo et al. 2010) and SN 2009dc (Taubenberger et al. 2011) have yielded a considerable contribution from collision with a circumstellar matter with a much smaller velocity (see Fig. 6), and
For the best fit b=0.081/d and a typical proto PN radial expansion of km/s, the mass loss rate from the progenitor star before the SN explosion is . The swept in circumstellar mass is .
5 Conclusions
Supernovae type Ia, like all other types of supernovae, are a very complex astrophysical events that depend on the detailed late stage evolution of their progenitors and their environment. These unknowns determine in a complex way the properties of ordinary and superluminous SNeIa. Nevertheless, here we have demonstrated that the observed bolometric lightcurves of normal SNeIa during their photospheric and early nebular phase are well described by a simple analytic expression, which involves only five adjustable parameters (). For sure, this is an over simplification of the diversity and complexity of SNIa explosions, and the demonstrated success of the master formula (Eq. (4)) sto reproduce their main properties is partly due to the use of adjustable parameter. However, the fact that the values of these adjustable parameters are very close to their theoretical expected values, indicates that our simple model probably provides a useful simple description of the photospheric and early nebular phase of SNeIa.
Neither the energy deposition by positrons from the decay of Co56, nor the additional energy from recombination seems to be able to power the bolometric light curves of several SNe during their photospheric and nebular phase. In such cases circumstellar interaction may provide the additional power needed to explain their bolometric light curves during the photospheric and early nebular phase. Moreover, if the circumstellar interaction begins early enough, i.e., during the photospheric phase, it can supply a considerable fraction of the energy required to power superluminous SNeIa and delay the peak time of the bolometric light curve due to a larger copacity. In that case Eq. (10) is not valid. If used, it overestimates the Ni56 mass synthesized in the explosion, and can even yield .
Superluminous SNeIa may be strongly interacting SNeIa whose bolometric light curve is powered by both the synthesis of of 56Ni and early collision with circumstellar matter such as that around the center of proto-planetary nebulae. This has been demonstrated in this paper , admittedly, using an oversimplified model and a couple of adjustable parameters. Interestingly, the model best fits of the bolometric lightcurve of the superluinous SN 2007if and SN 2009dc yield and , respectively. These values are within the observed range of the values of obtained for ordinary SNeIa.
A significant fraction of ordinary SNeIa could take place during PN formation or a failed PN formation: The X-ray and radio upper limits of nearby, normal type Ia, which show no sign of circumstellar gas to very faint limits may be explained if the fall back takes place at an early stage of the PN (or ”failed” PN) formation. However, it still remains to be tested both by detailed numerical calculations (e.g., G. Shaviv et al. to be published) and by conclusive spectroscopic observations whether accretion of fall-back matter (mainly He4) onto a nascent WDs at the center of proto-PN can trigger a significant fraction if not most of the ordinary SNeIa and superluminous SNeIa.
Acknowledgement: We thank an anonymous referee for very careful examination of our manuscript, and for constructive criticism and uggestions.
References
- Arnett (1979) Arnett, W. D., 1979, ApJ, 230, L37
- Arnett (1982) Arnett, W. D., 1982, ApJ, 253, 785A
- Astier (2012) Astier, P., 2012, Rep. Prog. Phys. 75, 116901
- Branch and Tamman (1992) Branch, D. & Tammann, G. A. 1992, ARA&A, 30, 359
- Chandrasekhar (1931) Chandrasekhar, S., 1931, ApJ, 74, 81
- Childress (2014) Childress, M. J., et al. 2014 MNRAS, 437, 338
- Chomiuk (2013) Chomiuk, L., 2013, arXiv:1307.2721
- Colgate et al. (1980) Colgate, S. A., Petschek, A. G., & Kriese, J. T. 1980, ApJ, 237, L81
- Colgate and McKee (1992) Colgate, S. A. & McKee, C. 1969, ApJ, 157, 623
- Contardo et al. (2000) Contardo , G., Leibundgut, B., Vacca, W. D. 2000, A&A, 359, 876
- Fesen et al. (2006) Fesen, R., et al. 2006, ApJ, 645, 283
- Fesen et al. (2007) Fesen, R., et al. 2007, ApJ, 174, 379
- Gal-Yam (2012) Gal-Yam, A., 2012, Science, 337, 927
- Goldhaber et al. (2001) Goldhaber G., et al., 2001, ApJ, 558, 359
- Goobar and Perlmutter (1995) Goobar, A. & Perlmutter, S. 1995, ApJ, 450
- Hamuy (1993) Hamuy, M. et al. (1993). AJ, 106, 2392
- Hamuy et al. (1996a) Hamuy, M., et al. 1996, AJ, 112, 2391
- Hamuy et al. (1996b) Hamuy, M., et al. 1996, AJ, 112, 2398
- Hamuy et al. (1996c) Hamuy, M., et al. 1996, AJ, 112, 2408
- Hamuy et al. (1996d) Hamuy, M., et al. 1996, AJ, 112, 2438
- Howell et al. (2006) Howell, D., et al. 2006, Nature, 443, 308
- Hoyle and Fowler (1960) Hoyle, F. & Fowler, W. A., 1960, ApJ, 132, 565
- Iben (1984) Iben, I. & Tutukov, A. V., 1984, ApJ, 284, 719
- Kuchner et al. (1994) Kuchner, M. J., et al. 1994, ApJ, 426, L89
- Kushnirshnir (20132013) Kushnir, D., et al. 2013, ApJ, 778, L37
- Maoz (2012) Maoz, D. & Mannucci, F. 2012, PASA, 29, 447
- Matsuura et al. (2007) Matsuura, M., et al. 2007, MNRAS, 382, 1447
- Matsuura et al. (2009) Matsuura, M., et al. 2009, ApJ, 700, 1067
- Munari et al. (2012) Munari, U., et al. 2012, preprint, arXiv:1209.469
- Nomoto et al. (1976) Nomoto, K., Sugimoto, D., & Neo, S., Ap&SS, 1976, 39, L37
- Nomoto et al. (1984) Nomoto, K., Thielemann, F.K., & Yokoi, K., ApJ, 1984, 286, 644
- Nugent et al. (2011) Nugent P. E., et al., 2011, Nature, 480, 344
- Perlmutter et al. (1999) Perlmutter, S., et al., 1999, ApJ, 517, 565
- Phillips (1993) Phillips, M. M., 1993, ApJ, 413, L105
- Phillips (1999) Phillips M. M., et al. 1999, AJ, 118, 1766
- Pinto and Eastman (2000) Pinto, P. A., & Eastman, R. G. 2000, ApJ, 530, 744
- Piro (2013) iro, A. & E. Nakar, 2013, ApJ 769, 67; 2014, ApJ, 784, 85
- Prieto (2006) Prieto J. L., Rest A., Suntzeff N. B., 2006, ApJ, 647, 501
- Riess et al. (1996) Riess A. G., Press W. H., Kirshner R. P., 1996, ApJ, 473, 88
- Riess et al. (1998) Riess, A. G., et al. 1998, AJ, 116, 1009
- Scalzo (2010) Scalzo, R. A., et al. 2010, ApJ, 713, 1073
- Smartt (2009) Smartt, S. J., 2009, ARA&A, 47, 63
- Silverman (2011) Silverman, J. M., et al., 2011, MNRAS, 410, 585
- Tripp (1998) Tripp, R., 1998, A&A, 331, 815
- Taubenberger (2011) Taubenberger, S., et al., 2011, MNRAS, 412, 2735
- Webbink (1984) Webbink, R. F. 1984. ApJ, 277, 355
- Whelan (1973) Whelan, J. & Iben, Jr. I. 1973, ApJ, 186, 1007
| SNIa | [d] | [d] | [d] | M(56Ni) | ||||
|---|---|---|---|---|---|---|---|---|
| SN 1992bc | -19.6 | 12.6 | 26.8 | 0.84 | 0.15 | |||
| SN 1994ae | -16.1 | 10.0 | 28.2 | 0.47 | 0.18 | |||
| SN 2011fe | -17.5 | 14.6 | 19.5 | 0.73 | 0.12 | |||
| average | -17.7 | 12.4 | 0.68 | 0.15 | ||||
| theory | -17.5 | 11.5 | 29.0 | |||||
| SLSNIa | [d] | [d] | b/[d] | [d] | ||||
| SN 2007if | -21.3 | 11.5 | 36.1 | 0.78 | -2.93 | 17.3 | 0.081 | 58.3 |
| SN 2009dc | -21.4 | 12.5 | 25.9 | 0.92 | -5.5 | 16.6 | 0.085 | 42.3 |