Gamma-Ray Burst Science in the Era of the Cherenkov Telescope Array
Abstract
We outline the science prospects for gamma-ray bursts (GRBs) with the Cherenkov Telescope Array (CTA), the next-generation ground-based gamma-ray observatory operating at energies above few tens of GeV. With its low energy threshold, large effective area and rapid slewing capabilities, CTA will be able to measure the spectra and variability of GRBs at multi-GeV energies with unprecedented photon statistics, and thereby break new ground in elucidating the physics of GRBs, which is still poorly understood. Such measurements will also provide crucial diagnostics of ultra-high-energy cosmic ray and neutrino production in GRBs, advance observational cosmology by probing the high-redshift extragalactic background light and intergalactic magnetic fields, and contribute to fundamental physics by testing Lorentz invariance violation with high precision. Aiming to quantify these goals, we present some simulated observations of GRB spectra and light curves, together with estimates of their detection rates with CTA. Although the expected detection rate is modest, of order a few GRBs per year, hundreds or more high-energy photons per burst may be attainable once they are detected. We also address various issues related to following up alerts from satellites and other facilities with CTA, as well as follow-up observations at other wavelengths. The possibility of discovering and observing GRBs from their onset including short GRBs during a wide-field survey mode is also briefly discussed.
keywords:
gamma-ray bursts , high-energy gamma rays , Cherenkov telescopes , cosmic rays , cosmology , special relativity1 Introduction
Gamma-Ray Bursts (GRBs) are the most luminous explosions in the Universe after the Big Bang, liberating as much as erg of isotropic-equivalent energy during a brief period of 0.01-1000 s, primarily as MeV-band gamma rays. They are also the most violent explosions, manifesting rapid and irregular variability on timescales down to sub-millisecond levels. Since their discovery in 1967, research on GRBs has steadily intensified, witnessing particularly rapid progress during the last 10-20 years, driven by observational results from satellite instruments such as the Burst And Transient Source Experiment (BATSE) and the Energetic Gamma Ray Experiment Telescope (EGRET) onboard the Compton Gamma-Ray Observatory (CGRO), the High Energy Transient Explorer (HETE-2), BeppoSAX, Swift, and most recently the Large Area Telescope (LAT) and Gamma-ray Burst Monitor (GBM) onboard the Fermi Gamma-ray Space Telescope. We now know with confidence that: 1. They occur at cosmological distances, typically at redshifts of a few. 2. They are generated by (likely collimated) outflows with ultrarelativisic bulk velocities. 3. Their prompt, MeV-band emission is accompanied by afterglows that span the radio to X-ray bands and gradually decay over hours to days or more, most likely emitted by high-energy electrons accelerated in the blastwave resulting from the interaction of the outflow with the ambient medium. 4. Those with durations longer than 2 seconds (“long” GRBs) exhibit properties systematically different from those with shorter durations (“short” GRBs). 5. At least some long GRBs are associated with the core-collapse supernova events of massive stars. (For recent reviews on GRBs, see e.g. [1, 2, 3, 4, 5].)
However, many other basic aspects are still unknown or unclear, such as the identity and nature of the central engine, the formation mechanism of the ultrarelativistic jet, the physical mechanisms of energy dissipation and particle acceleration therein as well as the prompt and early afterglow emission, their cosmological evolution, the progenitors of short GRBs, etc. Thus they remain one of the most enigmatic phenomena in the Universe, and their origin is among the most important unsolved problems in modern-day astrophysics.
GRBs are also of potentially great importance for other fields of physics and astrophysics. From model-independent considerations, they are thought to be one of the leading candidates for the sources of ultra-high-energy cosmic rays (UHECRs) with energies up to eV, the highest energy particles known to exist in the Universe today and whose origin is yet unknown [6]. The production of UHECRs in GRBs may also induce observable fluxes of high-energy neutrinos. GRBs are also crucial probes for observational cosmology, as they are known to occur and are observable out to extremely high redshifts, including the epochs of cosmic reionization and the earliest star formation [7]. Indeed, the recently detected GRB at is one of the most distant and hence most ancient astrophysical objects known to humankind [8, 9]. Finally, they can serve as valuable beacons for testing fundamental physics, particularly in searching for possible violations of Lorentz invariance [10, 11].
The latest observational advances in GRBs have been brought forth by Fermi [12]. The Fermi LAT instrument has revealed intense emission in the GeV band from a sizable number of GRBs of both the long and short classes. The lack of apparent high-energy spectral cutoffs has allowed important new constraints to be derived on the bulk Lorentz factor of the emitting region. Some notable, common characteristics have also been discerned for the GeV emission compared to the MeV emission, such as the slightly delayed onset, occasionally distinct hard spectral components, temporally extended emission, etc., for which numerous theoretical explanations have already been proposed. However, the generally limited statistics of high-energy photons detected by Fermi LAT (only a few photons above 10 GeV even in the best cases) have so far prevented firm conclusions to be drawn on the nature of the high-energy emission from GRBs.
In order to stimulate further progress, observations with higher sensitivity over a wider energy band are strongly desirable. Compared to Fermi, ground-based, imaging atmospheric Cherenkov telescopes (IACTs) have a large advantage in terms of sensitivity for gamma rays above several tens of GeV because of their much larger effective area, although their field of view and duty cycle are more limited [13, 14]. Past and ongoing follow-up efforts of GRB alerts by current IACTs such as HESS, MAGIC and VERITAS have yet to uncover signals, but their present operational threshold energies of 50-100 GeV and the potential attenuation by the extragalactic background light (EBL) [15, 16] in this band at the typical distances of GRBs could be hindering their detection.
The Cherenkov Telescope Array (CTA), an advanced, next generation ground-based facility 222In the current timeline, start of construction is foreseen from 2015 and that of scientific operations from 2016 [18]., is planned to be two sets of mixed arrays of large-size, mid-size and small-size telescopes (LSTs, MSTs and SSTs, respectively), one each situated in the northern and southern hemispheres 333The CTA North Array may comprise only the LSTs and MSTs and have somewhat lower sensitivity above few tens of TeV compared to the CTA South Array., which when combined will cover the entire sky over a broad energy range from tens of GeV up to hundreds of TeV, with a sensitivity considerably better than existing instruments [17, 18]. The most critical component for GRB observations will be the LSTs, primarily responsible for the lower energy bands. Compared to current IACTs, they will feature: i) appreciably lower threshold energy (30 GeV, possibly down to 15 GeV in some cases), and ii) even larger effective area at multi-GeV energies ( times larger than Fermi LAT at 30 GeV) [19]. In addition, they are designed with iii) rapid slewing capability (180 degrees azimuthal rotation in 20 seconds), comparable to MAGIC-II, allowing the observation of some long GRBs during their prompt phase, and many others in the early afterglow phase. By acquiring high-quality (i.e. high photon statistics) measurements of time-resolved spectra and energy-dependent variability at multi-GeV energies that was not possible with Fermi, some important science goals that can be addressed with CTA include the following. 1. Determine or more robustly constrain the bulk Lorentz factor of the emission zone. 2. Determine the emission mechanisms of prompt GRBs and early afterglows. 3. Reveal hadronic signatures accompanying the production of UHECRs and neutrinos 4. Probe the extragalactic background light at high redshifts, beyond the reach of blazar active galactic nuclei (). 5. Probe Lorentz invariance violation with better precision.
This article aims to provide an overview of the science prospects for GRBs with CTA, and is organized as follows. We begin by reviewing our current knowledge of GRBs, focusing on their emission in the high-energy ( 100 MeV) and very-high-energy ( 100 GeV) gamma-ray regimes in Sections 2 and 3, respectively. In Section 4, selected science cases for CTA are described in some detail. Section 5 presents demonstrative simulations of GRB spectra and light curve measurements, as a first step toward quantitative assessments of the science goals. In Section 6, predictions for GRB detection rates are given from two different perspectives. Section 7 discusses various issues related to following up GRB alerts with CTA and at other wavelengths, as well as the possibility of discovering GRBs with CTA alone during a wide-field survey mode. We conclude and provide an outlook in Section 8.
2 Current Status at GeV Energies
2.1 From EGRET to Fermi
GeV emission from GRBs was first discovered by EGRET on-board CGRO, active during 19912000. While EGRET detected only five GRBs with its spark chambers within 20 MeV30 GeV and a few more bursts with its Total Absorption Shower Counter within MeV, these events already showed diversity [20]. For GRB 940217, GeV emission was seen up to hr after the burst trigger, including an GeV photon at hr [21]. GRB 941017 displayed a distinct, high-energy spectral component up to MeV with a hard spectrum of [22], long duration s and total energy times larger than the low-energy, MeV-band spectral component that lasted several tens of seconds. A promising explanation is inverse-Compton emission from the forward-reverse shock system that forms as the ultra-relativistic GRB outflow is decelerated by the external medium [23, 24]. However, better data are needed in order to conclusively determine the origin of such high-energy components. The Italian experiment Astro-rivelatore Gamma a Immagini LEggero (AGILE), launched in 2007, detected emission from GRB 080514B up to MeV that continued for 13 s, compared to s for the MeV component [25].
Significant progress was brought forth by the Fermi Gamma-ray Space Telescope, which has been detecting about – GRBs per year at energies above a few tens of MeV since its launch on 11 June 2008. Thanks to the very wide energy range covered by its instruments, GBM (8 keV - 40 MeV) and LAT (25 MeV - 300 GeV), the prompt emission spectra of some GRBs have been measured from keV up to GeV. Below is a brief summary of what it has taught us about GRBs and associated high-energy physical processes.
2.2 Energetics & average spectrum
From a comparison of the number of GRBs per year detected by Fermi LAT with expectations based on simple spectral extrapolation of BATSE results [26, 12], as well as the observed flux or upper limits in the GeV-band relative to the MeV flux for individual bursts [27, 28, 29], the energy output in the GeV band appears to be about an order of magnitude less than in the MeV band. In some cases, a high-energy extrapolation of the Band function spectrum [30] overpredicts the GeV flux, indicating the presence of a spectral steepening or cutoff. This is despite the fact that the spectra of many bright GRBs are well described with the Band function over the entire Fermi energy range [31], and the brightest LAT GRBs often exhibit a hard, distinct high-energy spectral component (Section 2.4). At any rate, this suggests that in most GRBs the radiative output at GeV energies s not a major fraction of the total energy budget. However, short GRBs may be different in this respect (Section 2.6).
2.3 Constraints on the Lorentz factor
In addition to its typically enormous isotropic-equivalent luminosities , the prompt emission of GRBs shows significant short timescale variability, with a good fraction of the radiated energy in photons with energies . These properties would imply a huge optical depth to pair production () at the source, which would thermalize the spectrum and be at odds with the observed non-thermal spectrum, unless the emitting material was moving toward us ultrarelativistically with a bulk Lorentz factor . Such “compactness” arguments had been applied to EGRET GRBs to derive lower limits on the value of , typically resulting in , and in some cases as high as a few hundred (see [32] and references therein). However, these limits for EGRET bursts were based on the implicit assumption that the spectra extended to well above the observed energy range, even though direct evidence was lacking for photons with energies high enough that substantiate the opacity constraint.
For Fermi LAT GRBs, one could adopt a more robust approach of relying only on photons within the directly observed energy range. If is the highest observed photon energy, the maximal value of that can be derived corresponds to the case in which this energy is just above the pair production threshold in the comoving frame of the flow where the photons are roughly isotropic, so that
| (1) |
Provided that photons of sufficiently high energies are detected, concrete values for can be obtained by relating the spatial scale of the emitting region to the observed timescale of variability , the exact choice of which constitutes the main uncertainty for . Other uncertainties arise from those on the spectral fit parameters, or on the degree of space-time overlap between the high-energy photon and lower energy photons relevant for pair production. Relying on a single high-energy photon would also induce an uncertainty as it can still escape from regions with an optical depth of up to a few, but accounting for the second or third highest-energy photons helps to mitigate such uncertainties due to Poisson fluctuations. Thus, reasonably robust values have been derived for 3 of the brightest LAT GRBs: for GRB 080916C [33], for GRB 090510 [34], and for GRB 090902B [35].
Nevertheless, these limits rely on the simple assumption of a photon field that is homogeneous, time-independent and isotropic in the rest frame of the emitting material. A fully time-dependent and self-consistent calculation featuring emission from a thin spherical shell over a finite range of radii [36], appropriate for the internal shock model, gives limits that are lower by a factor of . Similar conclusions were recently reached by several studies [37, 38, 39, 40] (see also Section 4.1.)
In one case so far, GRB 090926A [41], a high-energy break or cutoff at GeV was measured at the brightest part of the prompt emission. If this is due to internal pair opacity at the source, for the first time we can determine the Lorentz factor instead of just setting a lower limit, We arrive at for a simple one-zone model, and for the fully time-dependent model mentioned above [36]. However, the available statistics of high-energy photons is insufficient to ascertain whether the measured spectral softening is actually caused by pair opacity or instead has a different physical origin.
The fact that for the bright, short GRB 090510 is comparable and even slightly higher than those for the bright, long GRBs 080916C and 090902B demonstrates that short GRBs are as ultrarelativistic as long GRBs, which was questioned before the launch of Fermi [42]. Note also that since the highest values of are derived for the brightest LAT GRBs, they may be affected by selection effects. For example, GRBs with higher may tend to be brighter in the LAT band by avoiding internal pair production [43].
2.4 Delayed onset & distinct high-energy spectral component
A common feature in Fermi LAT GRBs is a delay in the onset of the emission 100 MeV relative to the emission MeV. Such a delayed onset clearly appears in the four brightest LAT bursts so far, while in dimmer LAT bursts it is often inconclusive because of poor photon statistics. The time delay appears to scale with the duration of the GRB; several seconds in the long GRBs 080916C and 090902B, while s in the short GRBs 090510 and 081024B [34, 44], albeit with a smaller statistical significance for the latter.
Only 3 LAT GRBs so far have shown clear (5) evidence for a distinct, high-energy spectral component. However, these GRBs are the 3 brightest in the LAT, while the next brightest, GRB 080916C, showed a hint for an excess at high energies. This suggests that such distinct high-energy spectral components may be common, but can only be detected with high significance in particularly bright cases. The distinct spectral component is usually well fit by a hard power-law dominating at high energies. In GRB 090902B, a single power-law component dominates over the usual Band component not only above MeV, but also below KeV. There is also marginal evidence for a similar low-energy excess in GRB 090510.
Both the delayed onset and distinct spectral component should be strongly related to the prompt GRB emission and may help elucidate its uncertain radiation mechanism. We discuss here a few selected models, of both leptonic and hadronic types. Further alternative models are described in Sections 4.1 and 4.2.
Leptonic. One might attribute the high-energy spectral component to inverse-Compton emission, in particular the synchrotron-self Compton (SSC) mechanism, if the main MeV-band component is of synchrotron origin [45, 46, 47, 48, 49]. However, it may be difficult to account for the observed , the width of individual spikes in the light curve. Moreover, the observed, gradual steepening with time of the high-energy spectral component is not naturally expected. The fact that the spectral indices of the distinct GeV component and the sub-MeV component are notably different, as well as the existence of the low-energy excess components in some bursts, are also problematic for the simplest leptonic models.
Hadronic. One might identify with the acceleration time of protons (or heavier ions) up to ultra high energies, where they can convert their energy to GeV photons with a reasonable efficiency, e.g. via the proton synchrotron mechanism [50]. If the GeV emission involves photohadronic cascades (i.e. inverse-Compton emission by secondary pair cascades initiated by interactions between ultra-high-energy protons and low-energy photons [51]), some additional delay may occur for the cascades to develop. However, such a scenario for the delayed onset requires the GeV emission to originate from the same physical region over times and implies variability timescales due to the stochastic nature of the acceleration process, which is in contrast to what is usually observed, . The gradual steepening of the high-energy spectral component is evidently not expected, although it might be mimicked by time evolution effects [50]. For GRB 090510, a photohadronic cascade model requires a total isotropic equivalent energy times larger than in MeV gamma rays [51], potentially posing a challenge for models of its progenitor. On the other hand, the low-energy excess component observed in GRB 090902B (and possibly also in GRB 090510) may be naturally explained in this model by synchrotron emission from secondary pairs [51, 52].
2.5 Long-lived high-energy emission
The GeV-band emission in most Fermi LAT GRBs lasts significantly longer than the MeV-band emission. During the prompt phase of the MeV emission, the GeV emission usually shows significant variability, in some cases being correlated with the former. The longer-lived GeV emission, however, is temporally smooth and consistent with a power-law flux decay, typically but ranging over , with roughly flat spectra.
The early GeV emission may be most naturally interpreted as the high-energy counterpart of the prompt MeV emission from the same emission region, especially when the respective light curves show temporal correlation. The long-lived, smooth decay phase is more naturally ascribed to the high-energy component of the afterglow emission from the external forward shock. (For discussion of late-time flaring emission, see Section 4.1.) Although an afterglow origin has been suggested in some cases for the entire GeV emission including the prompt phase [53, 43], it is generally hard to explain the sharp spikes seen in the early LAT light curve [54]. Good multi-wavelength coverage of the afterglow from early times (e.g. [55]) should be a key to identify its origin.
Producing multi-GeV photons is challenging for a leptonic synchrotron origin, both during the prompt emission [33], and even more so during the afterglow (e.g. [56]; see however, [53]) as it requires a very high bulk Lorentz factor and high upstream magnetic field, in addition to very efficient shock acceleration of electrons. For example, the photon with energy GeV (GeV in the cosmological rest frame at redshift ) observed in GRB 090902B at s after the trigger, well after the end of the prompt emission [35], would require in this interpretation. That at least some GRBs are now known to emit photons near 100 GeV is also a crucial fact for ground-based gamma-ray observatories (Section 3). See Section 4.1 for further discussions on the high-energy afterglow emission.
2.6 High-energy emission of long versus short GRBs
Out of the 30 LAT GRBs up to January 2011, 4 and 26 are of the short and long duration class, respectively. Bearing in mind the uncertainty due to the small number statistics, this implies that of LAT GRBs are short, which is marginally consistent with the fraction of short GRBs detected by the GBM. The GeV emission properties of short and long GRBs appear to be rather similar. Both can produce very bright emission in the LAT energy range ([34] vs. [33, 35, 41]), with a correspondingly high lower limit on the bulk Lorentz factor, for a simple one-zone model or for a time-dependent model relevant for internal shocks, as well as a distinct spectral component ([34] vs. [35, 41]). Both show delayed onset and long-lived GeV emission compared to the MeV emission (see also [57] for AGILE results). However, the GeV onset delay time appears to roughly scale with the duration of the GRB, being s for short GRBs and several seconds for long GRBs. Considering that GRB 080916C and GRB 090510 had comparable isotropic equivalent luminosities of several times , this scaling of the delay times may suggest an underlying cause that is largely independent of the outflow’s instantaneous properties and is instead driven by its general evolution over the duration of the GRB, which differs between short and long GRBs and may provide clues to the inner workings of their central engines, e.g. [58]. Another interesting potential difference is that the GeV energy output relative to the MeV output of short GRBs appear to be comparable, while that of long GRBs tend to be a smaller fraction. However, this still warrants confirmation, since there are only 4 short LAT GRBs so far that may be subject to selection effects.
3 Current Status at Very High Energy
Because of their limited effective area, the sensitivity of satellite instruments is often inadequate to measure the decreasing fluxes from gamma-ray sources above few tens of GeV. In this very high energy (VHE) regime, ground-based Imaging Atmospheric Cherenkov Telescopes (IACTs) are the most sensitive instruments. GRB follow-up observations are regularly carried out with the latest generation of IACTs including the Major Atmospheric Imaging Cherenkov Telescope (MAGIC)444http://wwwmagic.mppmu.mpg.de, the High Energy Stereoscopic System (H.E.S.S.)555http://www.mpi-hd.mpg.de/hfm/HESS/, and the Very Energetic Radiation Imaging Telescope Array System (VERITAS)666http://veritas.sao.arizona.edu/. Furthermore, facilities such as Milagro777http://www.lanl.gov/milagro/ and ARGO888http://argo.na.infn.it/ have been conducting searches for VHE emission from GRBs that are complementary to IACTs, with much wider field of view and higher duty cycle, albeit with less sensitivity and higher energy threshold (see e.g. [59, 60, 61, 62, 63] for selected results).
3.1 MAGIC
In view of the expected attenuation of gamma rays due to the EBL ([15, 16], see also Section 4.3) and the generally large redshifts of GRBs, achieving the lowest possible energy threshold for ground based detectors is of paramount importance. Furthermore, since the duration of the prompt emission is typically tens of seconds, fast repositioning of the telescope towards the coordinates provided by satellite detectors is crucial. Both requirements are met with the two MAGIC telescopes. With reflectors of 236 m2 each, they are currently the largest stereoscopic pair of IACTs in the world, aiming to explore the gamma-ray sky with high sensitivity at energies starting well below 100 GeV. Moreover, the lightweight design of their supporting cradle allows MAGIC to slew in azimuth in less than 20 s.
Having a limited field of view, IACTs must generally rely on external GRB alerts such as those provided by the automated satellite link to the Gamma-ray Burst Coordinate Network (GCN)999http://gcn.gsfc.nasa.gov/, which broadcasts the coordinates triggered by selected satellite detectors and sends them to ground based experiments. The GCN information can be received directly over a TCP/IP internet socket connection. A program is necessary to validate the alert with predefined observability criteria. In the case of MAGIC, the alert is automatically accepted and sent directly to the central control software if the following criteria are fulfilled:
-
1.
The Sun is below the astronomical horizon (zenith ).
-
2.
The angular distance from the GRB to the Moon is .
-
3.
The zenith angle for the GRB observation is . Under moonlight the maximal zenith angle is reduced to .
Because of their large localization uncertainties, Fermi GBM alerts are not followed up by many ground based telescopes. In order to increase the chances for simultaneous observations with MAGIC and Fermi LAT, some GBM alerts are accepted according to the following criteria:
-
1.
Flight generated: error , signal-to-noise , hardness ratio (counts at 15-50keV relative to 50-300keV)
-
2.
Ground generated: error , signal-to-noise .
-
3.
The pointing is updated if more precise coordinates arrive.
-
4.
Abort of the observation after 1 h if error .
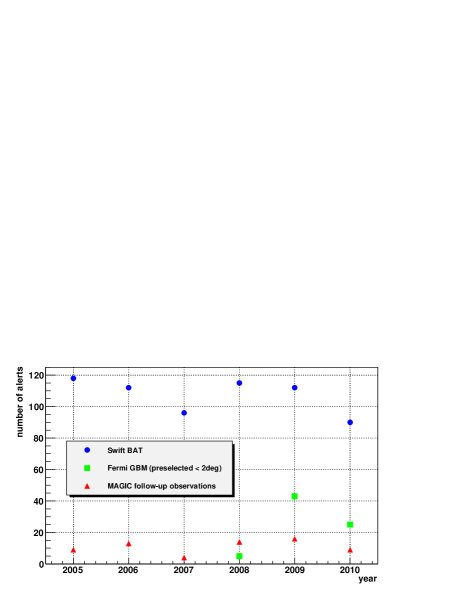
Nominal duration of observations is from the start of the observability until 4 hours after burst trigger, . As the redshift of the source is only known hours to days later, one is obliged to observe all candidates, although the usefulness of the observation can be limited if later follow-up reveals the redshift to be too high, or if it turns out that the redshift could not be measured. Figure 1 shows the frequency of alerts received by MAGIC in the time period between 2005 and 2010. On average 105.4 alerts from BAT and GBM (with some additional preselection) are received per year. Out of this sample, on average 9.6 follow-up observations are performed, which implies a duty cycle of 11%.
MAGIC has followed up 70 GRB alerts up to June 2012. In 23 cases the redshift of the burst was measured and out of this sample 5 GRBs had . Unfortunately, because of delays caused by observability criteria or technical problems, most of the MAGIC data sets were obtained only well after the GRB prompt emission phase. So far no VHE emission components have been detected. Some early MAGIC results on GRBs were presented in [66].
Two MAGIC follow-up observations can be highlighted here, conducted with the single, MAGIC-I telescope. For GRB 080430 [64] and GRB 090102 [65], simultaneous multiwavelength data and the knowledge of the redshift have allowed detailed discussions on the physical implication of the VHE upper limits.
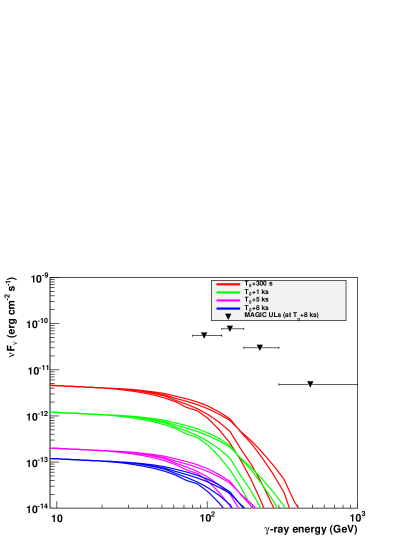
GRB 080430 occurred while the Sun was still above the horizon at the MAGIC site. The MAGIC observation started at s, well after the end of the prompt emission phase, but under very good observing conditions. Analysis of the data set resulted in upper limits (ULs) starting at 80 GeV. Figure 2 shows these MAGIC ULs in comparison with model expectations of the afterglow emission for this event.
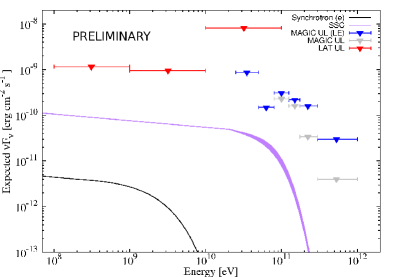
The follow-up observation of GRB 090102 by MAGIC started at s, while Swift and Fermi were still on the target. For the first time, simultaneous ULs with LAT and MAGIC could be extracted (Figure 3), showing the potential impact of ground-based VHE observations that cover the energy range where EBL attenuation is expected to be substantial.
3.2 H.E.S.S.
The H.E.S.S. I array consists of four telescopes with a mirror collection area of 108m2 each, operational in Namibia since 2004. Their energy threshold depends on the zenith distance of the observing position and reaches 100 GeV at zenith. In 2012, the array was complemented with the single H.E.S.S. II telescope with a 600m2 primary mirror, the largest Cherenkov telescope ever built, aiming for a significantly lower energy threshold. The discussion below concerns observations conducted to date with the smaller, H.E.S.S. I telescopes.
While small compared to the LAT instrument for lower energy gamma-rays, the field-of-view of the H.E.S.S. telescopes has a diameter of 5 degrees, significantly larger than those of other past and current IACTs. This is particularly beneficial in the context of GRB observations. Several hard-X-ray satellite-borne GRB instruments provide coarse GRB location accuracies at the first trigger signal. Subsequent on-board or ground analysis improves the positional accuracy with significant latency. All but one GRB trigger followed up by the H.E.S.S. telescopes had error circles associated with the initial trigger which were fully covered by the field-of-view of the H.E.S.S. telescopes. The H.E.S.S. GRB programme follows up on triggers promptly, whenever the location can be observed with the H.E.S.S. array. This requires the GRB trigger to arrive when the telescopes are operational (Sun at least 15 degrees below the horizon, no moonlight, clear skies), and a burst location at trigger corresponding to a zenith angle less than 45 degrees. The duration of the observations extends for at least one hour and depends further on the position of the GRB trigger, potential signals in on-line analysis, and estimates of the GRB redshift as reported on GCN alerts or other sources during ongoing H.E.S.S. observations. Triggers from any instrument feeding the GCN trigger system are accepted. In addition a GRB afterglow observing mode is followed, observing GRB locations as they become observable for H.E.S.S. with a latency of up to 24h after the trigger in case of GRBs with established redshifts. The latency depends on the GRB redshift and fluence. Optical follow-up observations of GRBs visible for H.E.S.S. are obtained with the ROTSE 3c telescope operating at the H.E.S.S. site.
Triggers for prompt observations are passed on directly from the local socket connection to the telescope operation system. Since 2010 they interrupt any ongoing observations if observability criteria are met automatically. This results in a reduction of the latency of the VHE observations. At any time a GRB shift expert is on-duty, supporting the observers with follow-up investigations of GRB properties, redshift estimates, and further considerations affecting the GRB observations. Results of these studies have been published in [67, 68, 69]. Neither individual GRB observations nor stacked analyses provided the detection of VHE signals. In the case of GRB 070621 the sensitivity of H.E.S.S. allowed establishing upper limits on the VHE energy flux (in , above 200 GeV) which are lower than the detected X-ray energy flux (0.3 - 10 keV, observed with XRT) during the period 300 - 3000 sec after the trigger [67]. Other, particularly noteworthy events are GRB 060602B [68] and GRB 100621A [69]. Observations of GRB 060602B were remarkable because the trigger occurred within the field-of-view of H.E.S.S. at the time of the trigger - even if the position was at the edge of the field-of-view where the sensitivity is significantly reduced compared to on-axis performance. It was the only event witnessed by an IACT with data being taken before, during, and after the trigger. Only upper limits have been obtained [68]. The unusually soft X-ray spectrum and the low Galactic latitude of the event suggest, however, that GRB 060602B was actually a hard Galactic X-ray transient. This notion has been confirmed by [70].
3.3 VERITAS
Located at the Fred Lawrence Whipple Observatory in southern Arizona, USA, VERITAS is an array of four IACTs using a Davies-Cotton design with a 12 m dish and a field-of-view camera composed of 499 photomultiplier tubes. The VERITAS observing strategy assigns highest priority to GRB observations.
GCN alerts are received at the VERITAS basecamp through a TCP/IP socket connection which allows prompt notification to the observers. If the burst localization is higher than elevation and has less than localization uncertainty, the telescopes are immediately slewed toward the least uncertain burst localization. The telescope slewing rate is /s both in azimuth and elevation. Since VERITAS first light in 2006, 36 burst alerts were promptly responded to. For half of them, data taking could start less than 180 sec after the burst trigger with a record of 91 sec.
VERITAS policy is then to continue observation as long as the target remains above elevation and for at least 3 hours in the case of Swift alerts and 1 hour in the case of Fermi GBM alerts (since in most cases, GBM localization uncertainty is much larger than the VERITAS field-of-view). Additionally, in order to maximize VERITAS chances of detecting a GBM burst, an observation mode where the GBM 1- error box is being continuously scanned is in the process of being implemented [71].
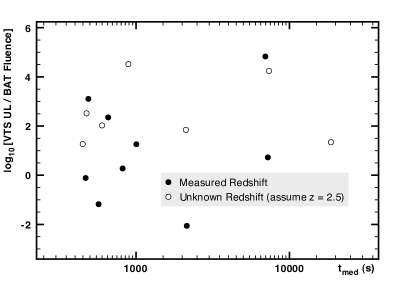
Upper-limits for a sample of 16 Swift-triggered GRBs were recently published [72]. Among the 9 bursts with measured redshifts, 3 could be constrained to have VHE afterglows less energetic than the prompt, low-energy gamma-rays measured by Swift in the 15-350 keV range, as shown in in Fig. 4.
4 GRB Science Cases for CTA
4.1 Physics of GRBs
Many fundamental problems remain unsolved concerning the physical mechanisms behind GRBs. With its large effective area, CTA can detect hundreds or more photons from moderate to bright GRBs (Sections 5 and 6) and achieve unprecedented temporal and spectral resolution in the domain above a few tens of GeV. Here we discuss the prospects for studying the physics of GRBs with CTA, focusing on issues related to the bulk Lorentz factor, the prompt emission, and the afterglow emission.
Bulk Lorentz Factor. The bulk Lorentz factor is a key quantity characterizing ultra-relativistic outflows in GRBs, particularly their acceleration mechanism and composition (or degree of baryon loading and magnetization). The baryon loading is intimately related to jet formation at the central engine, the most enigmatic aspect of GRB physics. In the canonical fireball model of GRB outflows, an optically thick plasma of pairs, photons and some baryons expands and accelerates because of its own pressure and (with sufficient baryon loading) converts most of the initial internal energy to the kinetic energy of baryons, a fraction of which is later dissipated through internal shocks [1, 2]. The electrons associated with the baryons are essential for trapping the radiation, and the corresponding minimum amount of baryons implies an upper limit on of
| (2) |
where is the isotropic-equivalent luminosity and is the initial size of the fireball [73].
As discussed in Section 2.3, can be constrained by identifying the high-energy spectral cutoff due to internal pair production (). Probing the range of in Eqs.1 and 2 will test the fireball model as well as alternatives involving magnetic acceleration [e.g., 74, 75, 76, 77, 78, 79, 80]. Values of would challenge both the fireball model and magnetic acceleration models (in which the acceleration proceeds more slowly with radius) and point to other possibilities, such as converging jets [81] or baryon entrainment during acceleration [82].
Although the instantaneous emission from a thin shell would exhibit a photon spectrum with an exponential cutoff, , where is the opacity to pair production for photons of energy , the shape of the time-integrated spectrum of a single pulse (or multiple pulses) may depend on the details of the emission mechanism and geometry. For example, the simple model of an emitting slab would give
| (3) |
a smoothly broken power-law spectrum [83]. However, this does not account for the realistic contribution to the opacity from the radiation field extending outside the emitting region. It is most likely that time-dependent and/or multi-zone effects (e.g., the superposition of emission from multiple internal shocks) modify the spectral break feature [36, 37, 38, 40]. As for multi-zone effects, the external inverse-Compton (EIC) emission from internal shock electrons at outer radii upscattering seed photons from inner radii can be potentially important and complicate the resulting spectra [37, 39, 58]. The softening of the spectral index could become so mild that observational distinction would be difficult with Fermi, yet feasible with CTA with much higher photon statistics.
Time-resolved spectral analysis with CTA can clarify the evolution of and the corresponding cutoff or break energy where , possibly even within a single pulse of the light curve, as predicted in time-dependent models [36]. Such analysis is also crucial to distinguish the prompt emission from the afterglow. The early afterglow emission could possibly dominate over the prompt emission at and hinder the determination of the bulk Lorentz factor. This includes not only synchrotron self-Compton (SSC; e.g. [84] and references therein) but also EIC emission due to upscattering by external shock electrons [85, 86, 87]. Obtaining sufficient photon statistics for the time window of a single pulse in the prompt emission would help to minimize such contributions from the afterglow, which is expected to be less variable than the prompt emission [87, 88].
In addition to the break or cutoff due to , the high-energy spectrum may reveal either a cooling break, a maximum energy cutoff of synchrotron emission [90, 82, 89], or a Klein-Nishina break of inverse Compton emission [91, 48, 92]. External absorption due to the EBL is also unavoidable and can obscure an intrinsic break or cutoff (Section 4.3). Detailed information on spectral variability from CTA will be vital to discriminate between these possibilities.
Prompt Emission. Since the probability of serendipitously detecting a GRB in the FoV of CTA during standard, pointing-mode observations is small, rapid follow-up within their duration (–s for long GRBs) is generally necessary to catch the prompt emission (see however, Section 7.3). Although the rate of GRB detection during the prompt phase is expected to be per year, once it is achieved, hundreds or more photons from a single event can be potentially obtained and provide invaluable clues to the emission mechanism (Section 6).
The total energy radiated in the GeV band for LAT GRBs is typically a fair fraction of that in the MeV band [28, 29], and in some cases can be considerable. The LAT spectra for some events remain hard up to the highest measured energies [34, 35], and the situation beyond remains unclear. Robust estimates of the total radiated energy can impose constraints on the central engine. For example, if the total intrinsic (i.e. collimation-corrected) energy is larger than a few erg, this might favor rapid accretion onto a newly born stellar-mass black hole [93] over a millisecond magnetar central engine for long GRBs, although the collimation angle is usually poorly constrained on an event-by-event basis. The energy budget is also an issue for hadronic models in which the radiative efficiencies are generally limited (Section 4.2).
CTA is potentially capable of delineating the multi-GeV light curves of GRBs with high photon statistics (Section 5.2), which will be crucial to pin down the emission site of the high-energy photons. Very rapid and large amplitude variability would favor internal shocks or photospheric emission over an external shock origin. Variability will also be the key to discriminate leptonic or hadronic emission mechanisms, since the acceleration and cooling timescales for protons and nuclei relevant for the GeV-TeV emission are generically much longer than for leptons (Section 4.2).
Although the delayed onset of the high-energy emission may be generally challenging to address with CTA as the typical delay s, follow-up of a GRB possessing a precursor pulse might allow the observation of the onset of main burst phase. Another possibility is prompt detection during wide-field mode observations (Section 7.3). Detailed characterization of the delay will be useful for discriminating different models from the different dependences on key variables such as luminosity and photon energy . For example, if the delayed onset is caused by the evolution of the pair opacity cutoff, we expect for kinetic-energy dominated jets [37], and for magnetically-dominated jets [94]. Alternatively, if the delay is related to jet confinement [81], while is independent of or if it is determined by the size of the progenitor system in connection with baryon entrainment [82, 58].
Chances are higher for observing GRBs in coincidence with X-ray flares seen around –s. In view of their strong and rapid variability, they are usually attributed to long-lasting activity of the central engine [88, 95], although they may alternatively arise from sporadic late-time magnetic reconnection events within a highly magnetized outflow [100]. Investigating the high-energy properties of the X-ray flares in comparison with the prompt emission can reveal their true origin. Fermi detected a few GeV photons during the X-ray flaring activity of GRB 100728A [96], but cannot distinguish whether they originate from internal dissipation processes, long-lasting afterglow emission, or moderately variable EIC emission from external shock electrons [84, 97, 98, 99]. High time resolution studies with the superior photon statistics of CTA will be crucial to determine whether the high-energy photons and the X-ray flares are co-spatial, as well as to constrain the bulk Lorentz factor of the emitting region and their emission mechanism.
The prompt emission of short GRBs may only be detectable by CTA through wide-field mode observations (Section 7.3). However, it may still be possible to follow up the extended emission of short GRBs, which is observed in the MeV band to last for s and for which the total radiated energy can sometimes be comparable to or even larger than that of the initial spike. Although this emission is most likely related to the activity of the central engine [101, 102], its exact nature is unknown, and CTA observations could provide a valuable clue.
Afterglow Emission. A promising target for CTA follow-up is the high-energy afterglow emission of GRBs. Fermi LAT has detected long-lived GeV emission up to s from dozens of events and in some cases even up to s, which is most likely related to the afterglow observed at lower energies [55, 103]. There are good chances for CTA to detect such emission at higher energies (Section 6).
The known radio to X-ray afterglow emission is generally well explained as synchrotron radiation from electrons accelerated in the external forward shocks resulting from the interaction of the outflow with the ambient medium [104], especially at times later than s. The simplest explanation of the GeV emission as the high-energy extension of the synchrotron emission from an adiabatic blastwave (together with suppression of the SSC emission) requires rather extreme conditions such as a very low ambient density and no magnetic field amplification [53]. The GeV light curve sometimes decays fairly rapidly as , which might be attributed to a radiative external shock, although the ambient medium then needs to be enriched in pairs at relatively large radii (cm) [43]. Alternatively, the initial rapid decay may be related to inverse Compton cooling effects in the Klein-Nishina regime [105], or perhaps more naturally, the gradual turn-off of the prompt emission overlapping with the afterglow onset [54, 106, 107]. An important test for the synchrotron afterglow model would be detection of the maximum energy cutoff sweeping across the observing band as the Lorentz factor declines [108]. In addition, at later times the Klein-Nishina suppressed SSC spectrum may become visible [105]. CTA could probe these features as well as the closure relation between the temporal and spectral indices and thus help to determine the precise origin of the extended emission, especially in combination with radio to X-ray multiwavelength observations.
CTA can also provide valuable information on the yet unclear nature of the early X-ray afterglow at s, particularly the shallow decay phase seen in most Swift bursts [109, 110, 111], which is not expected in standard models and whose origin has been debated [112]. Possible models include late-time energy injection [111, 113, 114], long-lasting central engine activity [115, 116], time dependence of shock microphysics [117, 118], viewing angle effects [119, 120], shock coasting in a wind medium [121], or contribution from SSC emission [122]. These predict different high-energy emission signatures (e.g. [84, 99]) so that simultaneous observations by CTA and X-ray instruments would be a key tool to identify the actual mechanism.
4.2 Ultra-High-Energy Cosmic Rays and Neutrinos
If the prompt emission from GRBs results from electrons accelerated at internal shocks, the energy in magnetic fields within GRB outflows is inferred to be a sizable fraction of the equipartition value. Then protons and heavier nuclei are also likely to be accelerated under the same conditions, potentially up to eV and beyond, compatible with the observed energies of ultra-high-energy cosmic rays (UHECRs) [123, 124, 125]. This may also apply to external shocks, particularly the reverse shock that occurs during the early afterglow [126], and possibly for the forward shock as well, albeit with nontrivial issues for acceleration to UHE [127]. UHECR acceleration may also proceed via magnetic reconnection rather than shocks [128]. For GRBs to be viable sources of UHECRs, their CR energy output must be consistent with the local UHECR emissivity, at eV [129, 130, 131]. Compared with the estimated local GRB rate [132, 133, 134, 135], the necessary isotropic-equivalent energy per burst in accelerated CRs erg (depending somewhat on the assumed spectral index and the minimum CR energy , where is the mass number of accelerated nuclei). This generally exceeds the observed isotropic energy in MeV gamma-rays by a large amount, entailing efficient CR acceleration as well as an energetic central engine. It may point to significantly larger masses of black holes and/or accreted matter than commonly assumed (note that black hole masses of are inferred in some X-ray binaries [136]), or that the outflow collimation angle is narrower than usually considered so that the total intrinsic energy is actually not excessive.
If UHECRs are produced in internal shocks, the above discussion also points to a high CR baryon-to-electron ratio [137, 138, 139], as the energy in electrons is considered to be comparable to . Similar considerations are valid for an external shock origin of UHECRs, implying that the isotropic kinetic energy of the blastwave is initially much larger than , and either that only a small fraction of the electrons are accelerated [140], or that the CRs efficiently escape before the blastwave becomes adiabatic [141]. Such high proton-to-electron ratios in accelerated particles are observed in low-energy Galactic cosmic rays and are also observationally inferred for the non-relativistic shocks of supernova remnants [142], but the physical processes that determine the relative efficiency of acceleration and energy transfer in collisionless astrophysical shocks are still poorly understood. Dedicated multi-wavelength and multi-messenger observations are necessary to elucidate all these issues.
Efficient proton acceleration in GRBs may induce distinctive GeV-TeV band components in the prompt or afterglow emission [143, 144, 145, 146, 147, 148, 149, 150, 151]. Electron-positron pair cascades initiated by photomeson interactions between UHE protons and low-energy photons can generate synchrotron and inverse Compton (IC) emission with a hard spectrum over a wide energy range from eV to TeV. Fermi indeed detected hard spectral excess components above 0.1 GeV from several bright GRBs in the prompt phase [34, 35, 41]. For GRB 090510 [34] and 090902B [35], low-energy spectral excesses over the Band component below tens of keV were also seen that are consistent with extrapolations of the hard GeV spectra. The hadronic pair cascade emission can readily explain both the keV and GeV excesses [51, 52, 152]. In the case of GRB 090510, the necessary isotropic-equivalent luminosity in accelerated protons [51] is much larger than the observed gamma-ray luminosity and commensurate with the energetics requirements for the GRB-UHECR hypothesis. Models that attribute the hard GeV component to proton synchrotron radiation also demand similarly large [50]. On the other hand, the required value of for GRB 090902B is comparable to [52], so the fractions of energy carried by protons and electrons may vary from burst to burst.
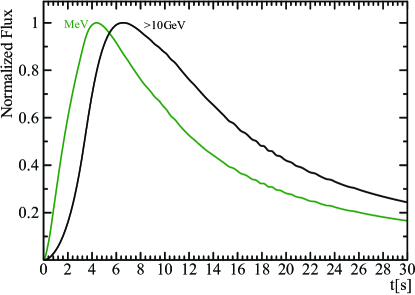
The limited statistics of multi-GeV photons for GRBs measured by Fermi LAT does not allow us to distinguish hadronic models from alternative leptonic models such as those based on synchrotron self-Compton [153, 154, 49] or external inverse Compton (EIC) [85, 155, 37, 58] processes in the prompt phase, or even the early afterglow emission [43, 53]. As most models fare reasonably well in reproducing the observed time-integrated (or coarsely time-resolved) spectra, the key discriminant should be multiband variability data with high time resolution. In the basic internal shock picture, each pulse in the MeV light curve is interpreted as synchrotron emission from electrons in individual expanding shells corresponding to shocked regions within the GRB outflow, and the width of the MeV pulse is mainly determined by the dynamical timescale of the shell [156]. The light curves at higher energies should reflect the nature of the emission mechanism. For example, in one-zone SSC models, the GeV-TeV pulse width and shape should be similar to those at MeV as the cooling timescales of the emitting electrons are typically much shorter than the dynamical time, and the GeV light curve should closely track the MeV light curve except for a marginal delay due to the finite buildup time of the seed photons. Contrastingly, in hadronic models, the acceleration and cooling timescales of the highest-energy protons that trigger the multi-GeV emission are comparable to the dynamical time. While the low-energy and high-energy light curves should be broadly correlated on longer timescales that reflect the dynamical history of the central engine, the individual pulse profiles for the multi-GeV component are expected to be appreciably broader and smoother than at MeV. This is clearly demonstrated from a detailed model calculation in Fig.5 (see [157] for more details). High photon statistics measurements of energy-dependent light curves by CTA (see Section 5.2) will provide a critical discriminant between leptonic and hadronic models, as well as a unique and valuable test of the GRB origin of UHECRs.
The optical to X-ray bands may also be important for probing prompt UHECR generation in GRBs. Besides the keV excess components seen in the bursts mentioned above, the bright, prompt optical emission of the “naked-eye” GRB 080319B [158] can also be interpreted as the lowest-energy portion of the hadronic cascade emission [52]. Had this GRB occurred after the launch of Fermi, the accompanying high-energy emission could have been detectable. Future searches for temporal correlations among the eV to multi-GeV bands including rapid followup by robotic optical telescopes are desired.
For UHECR production in the afterglow, the temporal behavior in specific energy bands may not be sufficient to clearly decipher hadronic gamma-ray signatures. However, unlike the prompt emission, the radiation mechanism at lower frequencies is reasonably well understood as being due to accelerated electrons (Section 4.1). This allows for comparatively robust predictions for the spectra and light curves of associated, leptonic high-energy components, relative to which one can search for anomalous, hadronic components [144, 146, 147]. Broadband coverage including CTA of the afterglow evolution over a range of timescales should provide a crucial diagnostic. X-ray flares often seen during the early afterglow may also be potential sites of photohadronic gamma-ray emission accompanying UHECR acceleration [159], whose detection will be facilitated by its temporal signature.
Except for rare, nearby events, gamma rays in the TeV regime may be difficult to detect from classical long GRBs in view of the severe EBL attenuation expected at these energies and their typical redshifts of . However, low-luminosity GRBs occurring at much lower may constitute a separate class of transients and may possibly be more common, with an estimated local rate of [160, 161]. Such events accompanied by hypernovae are also candidate sources of UHECRs [137, 162, 163], and the associated hadronic signals could be interesting targets for CTA [164, 165], in addition to their high-energy afterglows [166]. For an event like GRB 060218 with erg, duration s, and distance Mpc, the estimated TeV flux is if % of the proton energy is channeled to radiation [162]. This may be detectable by CTA even at TeV energies if such low- events can be identified rapidly and (at least part of) the MSTs can be slewed to achieve sufficient sensitivity.
Recent observations of UHECRs by the Pierre Auger Observatory in the southern hemisphere give hints that their composition may be dominated by heavy nuclei rather than protons at the highest energies [167] (see however [168, 169] for contrasting results from HiRes and Telescope Array in the northern hemisphere). GRBs should also be able to accelerate heavy nuclei to ultra-high energies, but their survival against internal photodisintegration processes mandates photomeson interactions to be inefficient [137, 170, 171], so that % of the cosmic-ray energy can be converted into cascade gamma-rays and neutrinos. Nevertheless, as internal attenuation is then mitigated [137], GeV-TeV signals from nuclear de-excitation, photopair creation or nuclear synchrotron emission may be observable and provide a unique signature of UHECR nuclei acceleration [172, 173]. For example, Lorentz-boosted de-excitation gamma rays at energies , where is the energy of CR nuclei, may be detectable from nearby, low-luminosity GRBs (see however [174]).
The photomeson interactions described above will also give rise to high-energy neutrinos, primarily at multi-TeV to PeV energies, whose detection will provide definitive evidence of hadron acceleration in GRBs [175, 176, 177]. Ongoing measurements by the IceCube neutrino observatory, mainly sensitive to sources in the northern sky, have begun to provide meaningful constraints on theoretical predictions. Stacking analyses of data in coincidence with GRBs indicate that the average photomeson production efficiency during the prompt phase is not very high [178, 179]. However, the current predictions involve large uncertainties, and it is too early to entirely reject the GRB-UHECR scenario at this moment. As it is difficult to obtain detailed information for individual bursts through neutrinos alone, gamma-ray observations will play an independent and complementary role in probing the GRB origin of UHECRs. In the future, synergy can also be expected with the KM3NeT facility that will be more sensitive for neutrino sources in the southern sky [180], as well as the Askaryan Radio Array that is better suited for the EeV energy range [181].
The UHECRs themselves are expected to arrive at us with significant time delays of up to yr due to deflections in intergalactic magnetic fields (IGMFs) during their propagation [182], long after the emission from the burst itself has faded away. Thus UHECR observations alone are unable to directly identify the sources in the case of GRBs, making gamma-ray and neutrino observations indispensable for this purpose. After the UHECRs have escaped from their sources, they can experience further photomeson interactions with the CMB and/or EBL during their propagation and induce secondary cascade gamma rays that are delayed and/or spatially extended, either through inverse Compton [183] or synchrotron [184] processes. Such emission may be detectable and would provide a further unique probe of UHECRs, although its properties depend sensitively on the highly uncertain strength and structure of IGMFs.
4.3 Extragalactic Background Light and Intergalactic Magnetic Fields
The extragalactic background light (EBL) refers to the diffuse and nearly isotropic background of infrared-optical-ultraviolet radiation originating outside of our Galaxy. Although its principal source is thought to be emission from the ensemble of normal stars in the Universe integrated throughout its history, other objects such as quasars or Population III stars may also provide important contributions, as well as possibly exotic processes such as dark matter decay. Since the EBL embodies fundamental information for studies of cosmology and galaxy formation, understanding its detailed properties is of paramount importance. However, its amplitude, spectrum and evolution are difficult to determine precisely from direct measurements, in particular because of the strong but uncertain contamination from zodical foreground emission.
An indirect but powerful means of probing the EBL is through photon-photon () absorption of high-energy gamma-rays. Gamma-rays emitted from extragalactic sources can be absorbed during intergalactic propagation by interacting with photons of the EBL to produce electron-positron pairs, as long as there is sufficient opacity to the process. The observed spectra of the gamma-ray sources should then exhibit corresponding attenuation features, from which one can deduce or constrain the properties of the EBL in a redshift-dependent way. This method has been effectively utilized in TeV observations of blazars by current ground-based Cherenkov telescopes to set important constraints on the EBL in the near infrared to optical bands at relatively low redshifts, [185, 186] (see also [15, 16] for reviews).
GRBs are the most luminous and distant gamma-ray emitting objects known in the Universe, typically arising at redshifts , which correspond to the peak epoch of cosmic star formation activity [187]. Furthermore, they are known to occur at least up to [8, 9, 188], well into the cosmic reionization era, and possibly even beyond, out to the very first epochs of star formation in the Universe [189] (see [190] and references therein for the possibility of especially luminous emission by GRBs from Pop III progenitors). The recent detections by Fermi LAT of dozens of GRBs including GRB 080916C at [33] clearly demonstrate that at least some GRBs have luminous emission extending to few tens of GeV (corresponding to rest-frame energies of up to 100 GeV), and the duration of the multi-GeV emission can last up to several thousand seconds. Thus there are good prospects for CTA of providing a powerful probe of the EBL through the multi-GeV spectra of GRBs with high quality at , as well as for GRBs at and beyond, a regime that cannot be explored with active galactic nuclei (AGNs) [191].
Direct observational determination of the cosmic star formation rate at high redshifts is plagued by various uncertainties, particularly the contribution of faint galaxies below the detection limit of optical-IR telescopes. An in-situ probe of the EBL utilizing gamma-ray absorption in high- GRBs can circumvent this problem. At , the EBL waveband relevant for gamma-ray absorption moves into the UV, providing a more direct measure of the contribution from massive stars. Current theoretical predictions at these redshifts can differ quite strongly among different models, e.g. [192, 193, 194, 195, 196, 197, 198, 199]. Although Fermi detections of AGNs and GRBs up to have provided important upper limits to the EBL in this redshift range [200], the associated spectral cutoffs have not been measurable because of the limited photon statistics. The much larger statistics expected for GRB detections by CTA (a few tens to hundreds of photons above 30 GeV for typical events and even more for brighter events, see Section 6) should allow more robust measurements of EBL-induced cutoffs, leading to more reliable determinations of the EBL and thus the total cosmic star formation at high redshifts.
In the redshift range , various observations indicate that HeII (singly ionized helium) in the intergalactic medium was reionized [201], although the details are not yet understood. Since this process requires photons with energy 54.4 eV and is difficult to attain with stars alone, the implication is that objects with hard UV spectra, most likely quasars, make an important contribution to the UV EBL at these redshifts (e.g. [202, 203, 204] and references therein). EBL absorption measurements in GRBs may thus offer invaluable insight into the reionization of intergalactic HeII as well as the global history of accretion onto supermassive black holes at these epochs, in addition to cosmic star formation.
An exciting, albeit challenging possibility is the detection of GRBs at in the cosmic reionization era. Some time after the epoch of cosmic recombination at redshift , the bulk of the intergalactic hydrogen in the universe must have been somehow reionized by , as indicated observationally from the spectra of high- quasars and the polarization of the CMB. However, the sources, history and nature of this cosmic reionization process are still largely unknown, as most of this redshift range has yet to be explored through direct observations. Because the first stars and galaxies in the universe must have formed during this period, the primary suspect is photoionization by UV radiation from such objects, potentially involving metal-free, Population III stars. Alternative possibilities include mini-quasars, supernova remnants and dark matter decay. Besides providing us with clues to such processes in the early universe, cosmic reionization also profoundly affects the ensuing formation of stars and galaxies, so elucidating this era is one of the most pressing issues in observational cosmology today (for reviews, see e.g. [205, 206]). As discussed by a number of authors [207, 208, 199], UV radiation fields with sufficient intensities to cause the reionization of the intergalactic medium (IGM) are also likely to induce appreciable gamma-ray absorption in sources at at observed energies in the multi-GeV range, with a potentially important contribution from Pop III stars. Measurements of these effects can thus provide important cross-checks of current models of cosmic reionization, a unique probe of the evolving UV EBL during the era of early star formation, as well as a test for the existence of the yet hypothetical Pop III stars. The detection of such very high- GRBs by CTA may be quite rare, however (Section 6).
A generic issue for EBL absorption studies is distinguishing them from spectral cutoffs intrinsic to the source. In this regard, the spectral variability inherent in GRBs offers an advantage. In general, changes in physical conditions of the source that cause variations in flux should also be accompanied by variations of the intrinsic cutoff energy, whether they are due to injection of freshly accelerated particles, changes in the magnetic fields, internal radiation fields, bulk flow velocity, etc. In contrast, cutoffs of EBL origin should be stable in time and independent of the variability state of each object. Acquisition of time-resolved spectra by CTA should thus greatly help in the deconvolution of the two effects.
The interactions between primary gamma rays from the GRB and low-energy photons of the EBL generate electron-positron pairs far away from the source, typically inside intergalactic void regions. The pairs can then be deflected by weak intergalactic magnetic fields (IGMFs) for a short period within the voids before giving rise to secondary GeV-TeV components by upscattering ambient CMB photons. Known as “pair echos”, they arrive with a characteristic time delay relative to the primary emission that depend on the properties of the IGMF and hence constitute a valuable probe of their nature [209, 210, 211, 212, 213, 214]. For GRBs at , the pair echos can last longer than the prompt emission and be detectable during the afterglow phase as long as the amplitude of IGMFs in voids are G and the primary GRB spectra extend into the multi-TeV regime [211, 212, 213]. They can be distinguished from the high-energy afterglow through their typically hard spectra and exponentially decaying light curves. Pair echos from GRBs at higher redshifts are potentially sensitive to somewhat stronger IGMFs, although their detectability demands more extreme properties for the primary emission [214] 101010For blazar AGNs, the time-integrated energy of the primary emission can exceed that of GRBs so that for a certain range of IGMF strengths, the secondary emission may be observable as spatially extended halos rather than through their time delay [215, 191].. The detection of pair echos or even upper limits to such components will provide unique and valuable constraints on IGMFs, whose nature is currently poorly understood but may be related to physical processes in the early Universe or the cosmic reionization epoch [216].
4.4 Lorentz Invariance Violation
Some models of quantum gravity (QG) allow violation of Lorentz invariance, and in particular allow the photon propagation speed to depend on its energy : , where . The Lorentz invariance violating (LIV) part in the dependence of the photon momentum on its energy can be expressed as a power series,
| (4) |
in the ratio of and a typical energy scale for the order, which is expected to be up to the order of the Planck scale , where . Since we observe photons of energy well below the Planck scale, the dominant LIV term is associated with the lowest order non-zero term in the sum, of order , which is usually assumed to be either linear () or quadratic (). The photon propagation speed is given by the corresponding group velocity
| (5) |
where corresponds to the sub-luminal case ( and a positive time delay), while corresponds to the super-luminal case ( and a negative time delay). Taking into account cosmological effects [217], this induces a time delay or lag in the arrival of a high-energy photon of energy , compared to a low-energy photon of energy emitted simultaneously from the same location, of
| (6) |
The focus here is on Fermi results for a linear energy dependence (), which are the best to date from direct time of flight measurements.
Applying Eq. (6) to the highest energy photon detected in GRB 080916C, of energy GeV, which arrived at s after the GRB trigger (i.e. the onset of the MeV emission) resulted in a limit of for the sub-luminal case () , when making the conservative assumption that it was emitted anytime after the GRB trigger (or the onset of any observed emission from this GRB) [33], i.e. . This avoids the need to associate the highest energy photon with a particular spike in the low-energy light curve, which is hard to do in a very robust way. This limit was the strictest of its kind at that time.
However, the next very bright LAT GRB, 090510, was short and had very narrow sharp spikes in its light curve (see Fig 6), thus enabling to set even better limits [218]. The main results for GRB 090510 are summarized in Table 1. The first 4 limits are based on a similar method as described above for GRB 080916C, using the highest energy photon, GeV, and assuming that its emission time was after the start of a relevant lower energy emission episode: . These 4 limits correspond to different choices of , which are shown by the vertical lines in Fig. 6. The low end of the confidence interval for the highest energy photon (GeV) and for the redshift () were used for conservativeness. The most conservative assumption of this type is associating with the onset of any detectable emission from GRB 090510, namely the start of the small precursor that GBM triggered on, leading to . However, it is highly unlikely that the GeV photon is indeed associated with the small precursor. It is much more likely associated with the main soft gamma-ray emission, leading to . Moreover, for any reasonable emission spectrum, the GeV photon would be accompanied by a large number of lower energy photons, which would suffer a much smaller time delay due to LIV effects, and would therefore mark its emission time. Such photons with energies above MeV could easily be detected by Fermi LAT, and therefore the fact that significant high-energy emission is observed only at later times (see Fig. 6) strongly indicates that the GeV photon was not emitted before the onset of the observed high-energy emission. One could choose either the onset time of the emission above MeV or above GeV, which correspond to , and , respectively. 111111Note that there is no evidence for LIV induced energy dispersion that might be expected if indeed the GeV photon was emitted near our choices for together with lower energy photons, for any reasonable emission spectrum. This is evident from the lack of accumulation of photons along the solid curves in panel (a) of Fig. 6, at least for the first 3 values, and provides support for these choices of (i.e. that they can indeed serve as upper limits on a LIV induced energy dispersion).
The 5th and 6th limits in Table 1 are more speculative, as they rely on the association of an individual high-energy photon with a particular spike in the low-energy light curve, on top of which it arrives. While these associations are not very secure (the chance probability is roughly ), they are still most likely, making the corresponding limits interesting, while keeping this big caveat in mind. The allowed emission time of these two high-energy photons, if these associations are real, is shown by the two thin vertical shaded regions in Fig. 6. For the GeV photon this gives a limit of for either sign of .
The last limit in Table 1 is based on a different method, which is complementary and constrains both signs of . It relies on the highly variable high-energy light curve, with sharp narrow spikes, which would be smeared out if there was too much energy dispersion, of either sign. We have used the DisCan method [219] to search for linear energy dispersion in the LAT data within the photon energy range 35 MeV - 31 GeV 121212We obtain similar results even if we use only photons below GeV or GeV. during the most intense emission interval (0.5 – 1.45 s). This approach extracts dispersion information from all detected LAT photons and does not involve binning in time or energy. Using this method we obtained a robust lower limit of (at the 99% confidence level).
The most conservative limits (the first and last limits in Table 1) rely on very different and largely independent analysis, yet still give a very similar limit: . This lends considerable support to this result, and makes it more robust and secure than for each of the methods separately.
Swift found a separate, small precursor s before the GBM precursor that marked the trigger time of GRB 090510 [220], itself about half a second before the start of the main GRB activity. It has been claimed that this can significantly affect the Fermi limit derived under the assumption that the 31 GeV photon was emitted after the onset of any observed emission from GRB 090510. However, it is highly unlikely that the 31 GeV photon was indeed emitted during this Swift precursor since (1) as discussed above for the GBM precursor, it should have been accompanied by a large number of lower energy photons that were in fact not observed, and (2) fine tuning is required for the 31 GeV photon to arrive on top of the brightest emission episode (and also exactly on top of a bright and narrow spike seen at all energies). Therefore, the Swift precursor is unlikely to have major consequences for the derived LIV limit.
LIV Prospects for CTA. In the conventional mode of IACT observations via followup of GRB alerts, improving on the limit set by Fermi for GRB 090510 from the arrival time of the highest energy photon would require detection of a GRB at a similar redshift () at energies TeV, where is the response time from the GRB trigger to the start of CTA observations. This would be quite challenging, since s is generally expected (Sections 3, 7.1), and attenuation by the EBL is also likely to limit the detectability of photons from to TeV [15, 16].
In contrast, for the DisCan method that searches for energy dispersion effects in the light curve, the much larger effective area of CTA compared to Fermi LAT (by roughly 4 orders of magnitude at GeV [19]) can greatly enhance the photon statistics and allow significant progress, as long as sufficiently variable emission occurs at the energies and timescales relevant for CTA. For example, observing a large number of TeV photons with strong variability on timescales s from a GRB at (Section 5.2) might improve the Fermi limit by a factor of . At least at lower energies, such variability is seen in some long duration GRBs tens of seconds after the GRB onset, within the CTA response time.
If a short GRB can be observed from its very onset during the wide-field mode of CTA observations (Section 7.3), a considerable number of TeV photons with variability timescale of a few seconds may be detectable, potentially improving the Fermi limit by up to a factor of . Thus, such wide-field mode observations can make a profound impact on fundamental physics by probing LIV with extraordinary precision.
All methods of constraining LIV require large amplitude, short timescale variability and bright high-energy emission. Hence the prompt emission is more favorable for this purpose than the afterglow, which is fainter and generally has a smooth temporal profile. Nevertheless, the X-ray flares that are often observed by Swift superimposed on the afterglow may also have correlated emission at GeV-TeV energies, as predicted in some models [97, 98, 84] and may have been seen in GRB 100728A [96]. In view of the higher expected detection rates in the afterglow phase with CTA (Section 6), such late-time flares may also be interesting for probing LIV. However, most X-ray flares have durations with respect to the post-trigger time (possibly being a factor of longer at GeV-TeV [84]), and their luminosities rapidly decrease with [221]. Compared to the prompt emission for which the average duration and luminosity of spikes in the light curve are roughly constant, LIV constraints from high-energy flares during the afterglow are thus expected to be weaker.

| limit on | Reason for choice of | limit | |||
|---|---|---|---|---|---|
| (ms) | (ms) | or limit on | (MeV) | on | |
| start of any observed emission | 0.1 | 1 | 1.19 | ||
| start of main 1 MeV emission | 0.1 | 1 | 3.42 | ||
| start of MeV emission | 100 | 1 | 5.12 | ||
| start of GeV emission | 1000 | 1 | 10.0 | ||
| — | association with 1 MeV spike | 0.1 | 1 | 102 | |
| — | if GeV is from spike | 0.1 | 1 | 1.33 | |
| lag analysis of all LAT events | — | 1 | 1.22 | ||
5 Simulations of GRB Observations
In order to quantify the prospects for CTA observations, we now present some simulated spectra and light curves of GRBs. Although our ultimate aim is to assess the different science cases discussed above, in view of the wide range of uncertainties in the current physical models, here we take a purely phenomenological approach as a first step. Choosing as templates some prominent bursts detected by Fermi LAT whose spectra and variability were relatively well characterized up to multi-GeV energies, we simply assume that their intrinsic spectra extend to higher energies as power-law extrapolations, while accounting for the effects of EBL attenuation based on selected models. These simulations should be considered exemplary first results on which we can elaborate further in the future by incorporating more physical ingredients depending on the specific science motivation.
5.1 Simulations of spectra
A series of spectral simulations have been conducted utilizing version 4 of the CTA simulation tool developed by Daniel Mazin and colleagues (see [222] for more details). Our assumptions are as follows.
- 1.
-
2.
Extrapolate their spectra to higher energies using the spectral indices measured by LAT at specific time intervals.
-
3.
Using the time decay indices measured by LAT, normalize the flux at some post-trigger time , allowing for some delay in the telescope response (sometimes optimistically, e.g. 35 sec, otherwise quite reasonably, e.g. 50-150 sec).
-
4.
Besides the template bursts with their actual redshifts, consider also events with the same intrinsic properties but with redshifts scaled to different values from to 6.5, accounting for spectral and temporal redshift corrections.
- 5.
-
6.
Generally take array configuration E (perceived as a balanced choice for a broad range of science goals), but also configuration B (with optimal performance for the lowest energies) in a few selected cases. (See [222] for more information on array configurations.)
-
7.
Assume 20 deg for the zenith angle of observation.
-
8.
Simulate the spectra that would be measured by CTA with the aforementioned tool, taking exposure times in accord with the considered .
-
9.
For GRB 090902B, the considered are all in the extended emission phase at 25 sec, and we take photon index and time decay index [35].
-
10.
For GRB 080916C, the considered correspond to time interval “d” (16-55 sec for ) with . Note that this spectral index is from the LAT only fits and not the GBM+LAT joint fits. The time decay index is always .
-
11.
As the template bursts are at the upper end of the luminosity distribution and the probabililty of their detection could be relatively low (Section 6), consider also events with the same intrinsic properties but with fluxes scaled by factor 1/10 that may correspond to bursts with more typical luminosities.
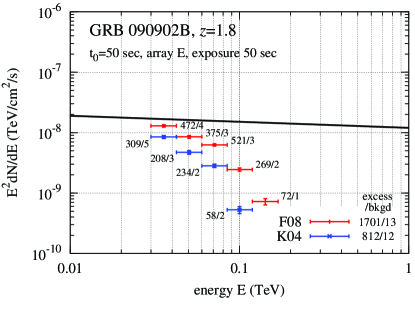
For GRB 090902B, LAT detected 1 photon above 30 GeV at 80 sec, while the CTA simulations for 50 sec exposure near this result in 1000-2000 photons depending on the EBL (Fig.7). This is roughly consistent with the expected factor difference in effective area at 30 GeV [19].
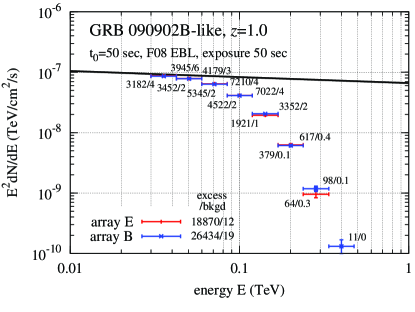
Luminous bursts at low can result in enormous numbers of detected photons (Fig.8) and permit detailed studies of light curves and time-resolved spectra (Section 5.2), from which we may delve into many issues left unsolved by Fermi. For , note also the potentially significant detection even up to 400 GeV and after EBL attenuation by 3 orders of magnitude. However, this postulates that the whole array has been slewed sufficiently rapidly, whereas in reality, the sensitivity at the higher energies from the MSTs/SSTs may not be available, at least not very rapidly. Such simulations and comparison with those for different subarray combinations should be useful for addressing the relative merits/demerits of slewing the non-LST components.
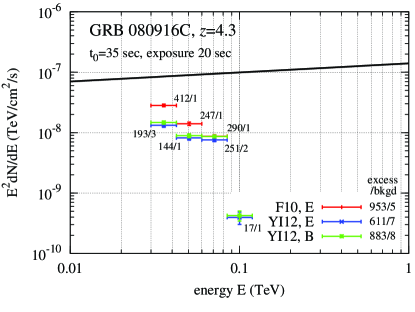
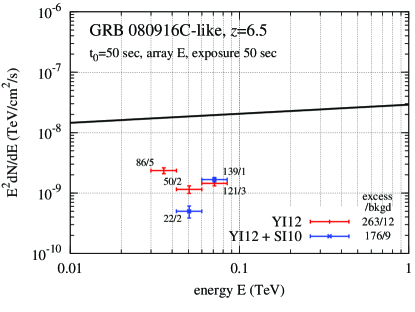
Distant GRBs may also be detectable, which would serve as powerful probes of the EBL at , beyond the expected reach of AGNs (Fig.9), and possibly even into the cosmic reionization epoch at (Fig.10). Even for some EBL models predicting significant absorption down to 10 GeV [208] with seemingly no hope for CTA, the simulations surprisingly reveal that a detection may be possible, notwithstanding heavy attenuation. This is needless to say for less opaque EBL models [198, 199].
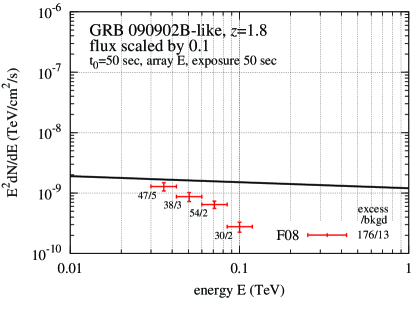
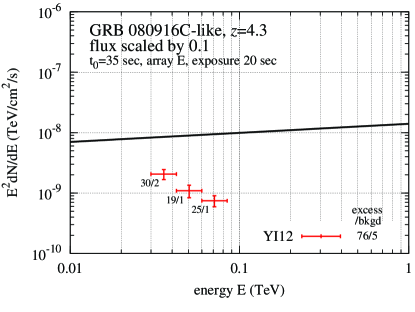
However, as discussed in detail in Section 6, because of the low duty cycle and zenith angle constraints inherent in IACT observations, the probability for CTA to detect bursts with such high luminosities and/or very high redshifts may be limited. In this regard, we chose to simulate more common events with moderate luminosities in a simple way by scaling the fluxes of our template cases by a factor of 1/10 (Fig.11). This still leads to detection of up to a few hundred photons per burst, certainly allowing valuable studies of the various science goals discussed in Section 4. Even non-detections of bursts at can provide important new constraints on the high- EBL.
One rather alarming fact is that for most cases shown here, EBL absorption is affecting almost the entire energy range over which photons are detected, even for the lower redshift bursts. This can prevent us from reliably ascertaining the intrinsic spectrum before EBL absorption and leave large uncertainties in the resulting constraints, unless simultaneous measurements with Fermi LAT can be performed (see Section 3.1).
Fortunately, for all cases, in the lowest plotted energy bin of 30-40 GeV, the number of excess over background events is still significant. This gives us hope that the detection energy threshold can be lowered appreciably for GRBs by going beyond standard analysis criteria as implemented in D. Mazin’s tool and allow access to the spectral region unaffected by EBL absorption. Array B seems to be the best for this goal, but array E does not appear significantly worse; when compared, the latter results in about 30-50 % less photons, but may manage to do a qualitatively competitive job in determining spectra, for either bright or moderate events. Yet the real strength of the B-type configurations may be achieving the lowest thresholds possible, which cannot be properly appreciated with the current tool, and warrants deeper examination.
5.2 Simulations of light curves
As a first demonstrative study, we have also carried out simulations of GRB light curve measurements, assuming the following:
-
1.
Take as template GRB 080916C.
-
2.
Normalize the time-dependent flux with the light curve at GeV as measured by Fermi LAT.
-
3.
Extrapolate the spectra for specific time intervals to higher energies using the spectral indices as determined by LAT for each interval.
-
4.
Adopt the EBL model of [223].
-
5.
Consider array configuration E and zenith angle of observation 20 deg.
-
6.
Taking a given time bin as the exposure time, evaluate the flux in a given energy band that would be measured by CTA with the aforementioned simulation tool. Repeat the procedure for all time bins to produce a light curve.
-
7.
Consider also a burst with the same properties but with fluxes scaled by factor 1/10 so as to simulate events with more moderate luminosities.
The results are shown in Figs.12-13 . Thanks to its significantly larger effective area compared to Fermi, CTA is potentially capable of resolving the light curve in exquisite detail for such bright bursts (and to a lesser extent for moderately bright bursts), as long as it can begin observing during the prompt phase. The energy-dependent light curves 131313Note that for the higher energy bands, some time bins with too few photons may not allow reliable flux measurements, so that studies of the energy-dependent variability will be restricted to the brighter pulses in the light curve. would be especially valuable for extracting crucial information on the physics of the emission mechanism (Sections 4.1-4.2). In particular, it could reveal definitive signatures of hadronic emission processes (see Fig.5) that was impossible with time-integrated spectra alone. It will also be valuable for distinguishing whether spectral cutoffs are due to EBL attenuation or physics intrinsic to the GRB (Section 4.3; see also [16]), not to mention searches for Lorentz invariance violation (Section 4.4). These aspects will be investigated more quantitatively in the future by incorporating the relevant physics in more detail. For all these goals, an energy threshold as low as possible is strongly desirable in order to achieve the broadest spectral lever arm over which we can exploit the energy-dependent variability. Corresponding studies for the afterglow emission are also forthcoming.
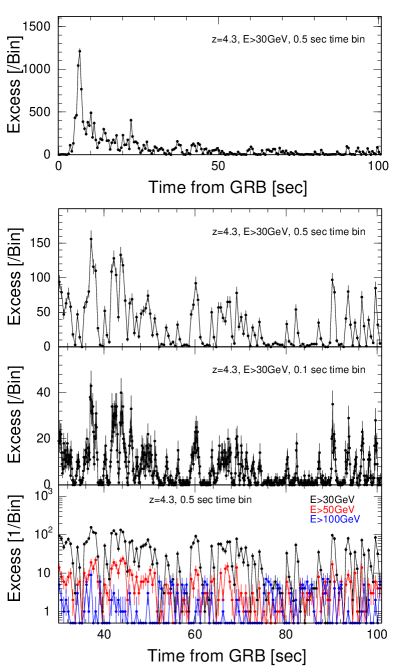
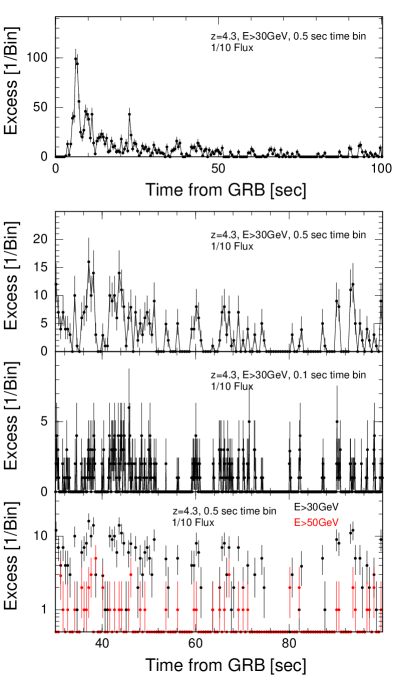
6 Detection Rate Expectations
We now discuss expectations for the detection rate of GRBs with CTA. Two independent approaches are presented, one by Gilmore et al. (see also [224, 225]) and another by Kakuwa et al. (see also [226]). Although they share some similarities in the assumptions, the main difference lies in the modelling of the GRB population, the former based directly on observed GRB samples, and the latter using a somewhat more theoretical method. The treatment of the CTA performance is also different; Gilmore et al. employ a phenomenological model, whereas Kakuwa et al. utilizes the official CTA performance files. The results obtained through the two approaches are generally within a factor of 2 of each other and can be considered consistent.
Note that the “delay time” as used below refers to the sum of all types of delays between the satellite-onboard burst trigger and the start of targeted CTA observations, including the time for the GRB alert to reach the telescopes from the satellite, any other kind of delay before the telescopes can start slewing, as well as the slewing time of the telescopes.
6.1 Observation-based population model
Despite being high-priority targets for current IACTs, GRBs have so far escaped detection at VHE and only yielded flux upper limits despite dozens of follow-up attempts (Section 3). High hopes come with the CTA observatory to finally succeed in this endeavor, thanks in particular to its order of magnitude improvement in sensitivity and much lower energy threshold. Unfortunately, because of their transient nature, GRBs are unlikely to be observed serendipitously in the limited field-of-view of IACTs. For example, assuming a whole sky rate of GRBs/year, a diameter FoV and a duty cycle, the telescopes will cover a patch of the sky where a GRB is expected to go off only once every years. (However, note that CTA will also have the ability to observe in a wide-field mode by splitting its array of MSTs so as to increase its sky coverage at a given time, albeit with a reduced sensitivity, a strategy already foreseen for survey and monitoring purposes; see Section 7.3).
In order to significantly increase the chances of detecting VHE emission from GRBs, an essential strategy is to follow-up on external GRB alerts to point the telescope array toward a localized GRB. Such GRB alerts are provided by various space-based missions through the Gamma-ray Coordinates Network (GCN). Which GRB-dedicated missions will still be operating at the start of CTA operation is fairly uncertain and depends mainly on the contingency of mechanical failures and funding issues. Currently the following two instruments are providing the large majority of GCN alerts:
SVOM [231, 232], a French-Chinese mission dedicated to the study of GRBs, is expected to be launched near CTA’s first light.141414Expected launch in It will provide GCN alerts with very similar characteristics as Swift alerts: alert rate GRBs/year and excellent localization well within the CTA field-of-view. Here we estimate the probability for CTA to detect VHE emission from these two very different types of GCN alerts: Swift-like (i.e. from Swift itself or SVOM) and GBM-like. The results presented in this section are taken from an in-depth analysis published in [225], to be consulted for more details.
A Monte-Carlo simulation was used to model the performance of the CTA array 151515Only the LST and MST array were considered, as the energy range of the SSTs (threshold TeV) is not suitable for studying distant extragalactic sources on account of the expected spectral attenuation in the EBL. as well as the properties of the GRB emission at VHE derived from a phenomenological approach, which uses temporal and spectral information of GRBs detected by Fermi LAT and other instruments operating at sub-MeV energies (Fermi GBM, Swift, BATSE). Because of our lack of knowledge on the spectral characteristics of GRB very high-energy emission, we constructed two spectral models in between which we reasonably expect the true GRB population to lie:
-
1.
‘Bandex’ model: a simple extrapolation of the Band function 161616Band function parameters are all drawn from BATSE distributions, although for Swift simulated bursts, a global fluence multiplier of 0.75 is applied to the BATSE fluence distribution to provide the best fit between BATSE and Swift BAT fluences in the keV range. to VHE with a maximum limit of -2.0 for the high energy index.
-
2.
‘Fixed’ model: a power-law component is added to the Band function, with a fixed spectral index of -2.0 and a normalization chosen so that the energy flux ratio between the LAT () and BATSE () energy range is 10%.
We note that these two spectral scenarios are consistent with the LAT detection rate of GRBs/year and more specifically the ‘Bandex’ and ‘Fixed’ models are consistent with the spectral behavior of GRB 080916C [33] and GRB 090902B [35] respectively. The redshift distribution of observed GRBs was derived from Swift-detected GRBs and all spectra were naturally convolved with the EBL model of [198]. However, we stress that intrinsic spectral curvature is not considered in our model mostly because of the large theoretical uncertainty of this feature. As a consequence of this caveat, the actual CTA detection rate could be lower than our predictions if strong intrinsic curvature below GeV is common in GRB spectra. Substantially higher detection rates are considered rather unlikely. The VHE light curve was assumed flat during the prompt emission to which a duration (drawn from the BATSE distribution) was assigned. Extended VHE emission was modeled assuming a temporal decay similar to the one measured for bright LAT GRBs [43], proportional to .
In order to investigate the chances of detecting the prompt emission, we have also considered the case of light curves where no high energy emission emerges after the prompt phase, which are labelled ‘prompt’.
The performance of the LST and MST arrays were derived independently from a simple interpolation of the known performance of current IACTs (more specifically, the VERITAS effective area and background rate). The VERITAS energy threshold ( GeV) was shifted toward lower energies by the ratio of the primary mirror collecting areas ( for LSTs and for MSTs). The normalization was then increased assuming a linear scaling with the number of telescopes (assuming 4 LSTs and 25 MSTs). Finally, the background rate was extrapolated to these new effective areas assuming a spectrum . To allow for uncertainties in the performance of the LST and MST arrays, we also simulated an ‘optimistic’ CTA performance. For this, we further reduced the LST low-energy threshold from 25 GeV to 10 GeV (which might be achieved with an improved trigger system), increased the MST effective area by a factor of 3 (to consider additional MST telescopes up to ) and decreased the background rate for both the LST and MST arrays by a factor of 3 (to consider improved performance through event containment regime and advanced analysis techniques). Lastly, we assumed a typical 60 sec (100 sec) delay for the LSTs (MSTs) to point toward a localized GRB. 171717This includes the delay for GCN alerts to be sent out to the ground, the response time of the observers as well as the slewing time for the telescopes to be on target. Although this is shorter than the typical values realized in current IACT observations (e.g. [228]), we allow for the possibility that future improvements to the GCN and telescope alert procedures and observer response time could lower the delay times.
For a GRB to be detected by CTA, a first necessary criterion is that it is observable by the array at the time of the alert. In our study, we assume a 10% duty cycle although we recognize that observations under moonlight (albeit with a higher energy threshold) could increase the duty cycle to or more. We considered CTA capable of observing a GRB when its zenith angle is smaller than and we parametrized the increase in energy threshold with zenith angle as: . Finally, we also included the effect of the anti-solar bias present in Swift-detected GRBs, as discussed in [227].
In case the simulated GRB was deemed observable, the significance for various observation timescales was computed following the procedure described in [229]. Depending on the phenomenological emission model and array performance used, the average detection rates for Swift-like alerts obtained for one array site (either CTA North or South only) are summarized in Table 2.
| Bandex | Fixed | Bandex prompt | Fixed prompt | |
|---|---|---|---|---|
| baseline [yr-1] | 0.35 | 0.6 | 0.13 | 0.21 |
| optimistic [yr-1] | 0.8 | 1.6 | 0.28 | 0.54 |
In comparison, the estimated detection rates are around GRB/year for current IACTs. These numbers would naturally be increased by a factor of as long as both CTA North and South are built with similar numbers of LSTs. In case of detection, CTA will provide photon statistics about an order of magnitude higher than achievable with currently operating IACTs. In particular, CTA-detected bursts will have significant statistics below GeV where the spectrum is hardly absorbed by the EBL, which makes such detection a golden case for EBL studies.
We also investigated how the average GRB detection rate varies as a function of critical instrument parameters. The low-energy threshold was found to be the most important for CTA’s capability to detect GRBs. For example, if the energy threshold were decreased from GeV to GeV, the average detection rate would increase by a factor of (see Fig. 14, top panel). It is therefore crucial to develop an efficient triggering scheme in order to lower the energy threshold of the LSTs as much as possible. 181818Building the array at higher altitude would also be beneficial. The time delay for the telescopes to slew onto the burst position is an important parameter if one wants to acquire photon statistics early during the burst light curve and hopefully catch the end of the prompt emission of long GRBs. However, changing the time delay from s to s changes the burst detection rate by only (see Fig. 14, bottom panel). The LST design already has s slewing time to any position in the sky so that it seems difficult to further increase the number of GRBs with this parameter. GRB science may benefit from minimizing other sources of time delay, such as GCN reporting time or that due to operator intervention upon receiving a GRB alert. Finally, as previously mentioned, a or more increase in observing time could be obtained by performing moonlight observations (although with a higher energy threshold), an improvement in duty cycle which seems very reasonable to reach.
Finally, we investigated the case of GBM-like alerts which come at a much higher rate but with quite a poor localization 191919We also took into account the fact that GBM bursts are significantly brighter than Swift bursts, on average by a factor of .. The statistical plus systematic error radius ranges from to which is in many cases larger than the LST field-of-view ( diameter). 202020We point out that reducing GBM localization uncertainties is a key objective of the GBM team which might well succeed in further reducing GBM error radius by the time of CTA’s first light.. A simple strategy where the whole CTA array is pointed to the best burst localization yields very poor results (detection rate times lower than for Swift-like alerts). However, it is possible to implement smarter observing strategies, such as a ‘scanning mode’ where the LSTs would scan over the whole GBM error box [71], a ‘divergent pointing mode’ where the LSTs would be initially offset so as to cover the entire error box, or an ‘array splitting mode’ where the MST array would be divided into sub-arrays to cover a larger part of the sky (although the latter two strategies would have the disadvantage of increasing the energy threshold of the observation). We found the scanning mode to yield a detection rate about half that for Swift-like GRBs, which makes GBM alerts competitive in terms of detection rate although photon statistics will certainly suffer from such strategies.
6.2 Theory-based population model
Using a somewhat more theoretical approach for modelling of the GRB population than in the preceding section, here we independently estimate the detection rate with CTA and study how the results depend on properties such as array configuration, delay time, etc. For this section, we mainly consider Fermi GBM as the GRB alert facility, although estimates for the case of SVOM alerts are also given at the end. These can be compared with the respective results for GBM-like and Swift-like alerts of the previous section. More details together with complementary discussions are presented in a separate publication [226]. We adopt the cosmological parameters km s-1Mpc-1, and .
Intrinsic GRB Properties. We simulate the GRB population using Monte Carlo methods. Following [135], the GRB luminosity function, i.e. the GRB rate per unit comoving volume at redshift per logarithmic interval of 1– keV peak luminosity is assumed to be , where for , for , for , and for , which is consistent with the observed characteristics of Swift GRBs. From the measured properties of a sample of GBM bursts, we also determine the relations between , time-averaged luminosity and isotropic-equivalent energy as and . Then the duration evaluated by forms a distribution that provides a good match to the one observed by GBM for long GRBs.
The light curve of the prompt emission is assumed to have a top-hat shape with luminosity and duration . Its fiducial spectrum is described by the Band function [30], with normalization fixed by as above, the spectral peak energy given by the observed – relation [233, 234], and the low-energy and high-energy spectral indices and sampled from the distribution observed in bright BATSE bursts [235] with the restriction . We also consider cases with an extra spectral component with photon index -2 and whose 0.1–100 GeV luminosity is a fraction of . The high-energy afterglow is characterized by a spectrum with fiducial photon index and 0.1–100 GeV luminosity that evolves as as a function of postburst observer time , taken to be nonzero only for and with fiducial temporal decay index [43].
We adopt the EBL model of Razzaque et al. [223] which is limited to , so the redshift range cannot be treated in this calculation. For comparison, the EBL model of Kneiske et al. [192] is also employed.
CTA Follow-up Observations. For GBM alerts, the trigger threshold in peak photon flux is taken to be in the keV band, which is satisfied by of actual GBM bursts. Follow-up with CTA will be feasible for only a fraction of them that is sufficiently well localized so that they can be reasonably covered by the FoV of the LSTs. Here we choose the criterion for initiating follow-up to be when the GBM error radius is deg (note the current condition of deg for MAGIC; Section 3.1). Compared with the deg diameter currently foreseen for the LST FoV, this implies that a considerable fraction of the bursts can be missed by falling outside the FoV. Although the actual situation would vary somewhat from burst to burst, we approximate the probability that such GBM bursts are still caught within the LST FoV with a constant value of (see [226] for more details), which is incorporated in all calculations below. Nontrivial LST follow-up strategies such as divergent initial pointing (currently under study by the CTA Monte Carlo simulation group) or scanning of the GBM error circle [71], as well as future improvements in the GBM localization algorithm can significantly increase this probability, the quantitative effects of which will be discussed in subsequent studies. We also evaluate the probability that a given GBM localization accuracy is realized as a function of the fluence by making use of actually measured values as reported in the GCN. The delay time between the burst trigger and the start of CTA observations is assumed to obey a log-normal distribution, with a fiducial peak at s, dispersion dex, and a lower bound of s. This accounts for a plausible degree of improvement from the delay times actually realized during MAGIC-I observations in 2005-2008, which can be fit by a similar distribution but with s and dex, and for which the average telescope slewing time was s (c.f. [66, 228]).
For the performance of CTA, we make use of the information provided by the CTA Monte Carlo simulation group such as effective area, background rate and energy resolution, particularly from the simulations of the Heidelberg group [222]. The array configurations B, D, and I, are considered, the latter being the fiducial choice. Since the performance files are currently available only for zenith angles and deg, the results are presented for both of these values, i.e. supposing that all GRBs are observed either at or deg; the true situation should lie in between. We also employ the performance files for which the event selection has been optimized for hour exposure time, the shortest available at the moment. For the minute-timescale exposures more appropriate for GRB observations, the actual performance is expected to be better as the background rate should be lower and the effective area higher [19]. The duty cycle is taken to be 10 %, although it may be increased up to 15 % under moonlight at the expense of a higher energy threshold and lower sensitivity. We also set a limit of deg on the observable range of zenith angles. 212121The contribution from deg is expected to be small on account of the correspondingly high energy threshold.
In accord with the standard criteria for IACT observations [236, 17], a detection is declared when the number of photons obtained within a given energy interval during a given exposure time satisfy all of the following: (1) , (2) , and (3) , where is the number of background events, , and . We designate detection in terms of the differential flux when the above applies to one or more energy bins whose widths correspond to the energy resolution. The assumed exposure time is for the prompt emission and up to 4 hours maximum for the afterglow.
Results. For convenience, we classify our model GRB sample into the following subsets:
-
1.
Init: GRBs triggered by GBM that satisfy sec and .
-
2.
CTAobs: GRBs belonging to Init whose deg, localization accuracy deg and occur during the 10 % duty cycle, i. e. bursts which are observable (but not necessarily detectable) by CTA.
-
3.
Pobs: GRBs belonging to CTAobs that satisfy , i. e. bursts which are observable (but not necessarily detectable) during the prompt phase.
-
4.
Pdet: GRBs that are caught within the LST FoV and whose prompt photons are detected.
-
5.
Adet: GRBs that are caught within the LST FoV and whose afterglow photons are detected.
Table 3 summarizes the results for our fiducial parameters , , , s and dex, for one CTA site. The number for both CTA North and South will simply be double these values. Note that the dispersion in the detection rates corresponds to the range of 20–50 deg.
| Init | CTAobs | Pobs | Pdet | Adet | |
|---|---|---|---|---|---|
| Fermi GBM [yr-1] | 200 | 1.8 | 0.66 | 0.013–0.033 | 0.09–0.2 |
| SVOM ECLAIRS [yr-1] | 56 | 2.0 | 0.65 | 0.09 | 0.53 |
Fig. 15 shows the cumulative distribution of photon counts with energies below 300 GeV in the case of prompt detections, compared with that for Pobs, events observable during the prompt phase by CTA. When successfully detected, we expect –150 with 60 % probability and with 20 % probability even for deg.
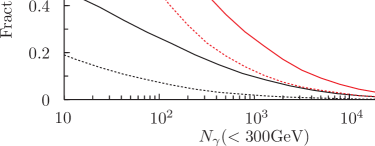
In Fig. 16, we plot the redshift probability distribution functions (PDFs) separately for the cases of prompt and afterglow detections, compared with that for CTAobs, events observable by CTA. Note that although the curves for and can differ significantly, in particular for the afterglow detections, the true result should lie in between them as discussed above. One also sees that 90 % of the prompt detection bursts have redshifts 2.7–3.4.
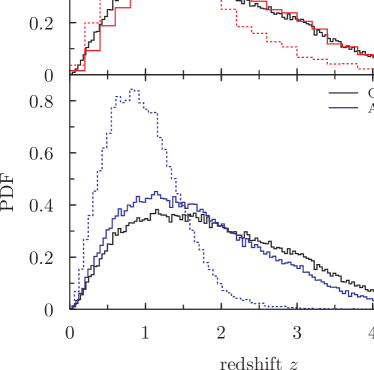
Fig. 17 summarizes the dependence of the detection rate on and other parameters. The prompt detection rate is quite sensitive to , as the relatively steep tail of the duration distribution implies that the number of bursts satisfying varies strongly. The addition of an extra spectral component with increases the detection rate by a factor of , regardless of or . On the hand, the detection rate for afterglows does not depend greatly on on account of their long-lasting nature. Except for some cases with , or , the detection rates do not differ by more than 20% for variations in our parameters (see [226] for details).
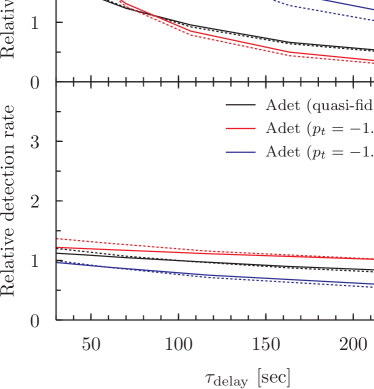
We also estimate the detection rate for the case of alerts from SVOM in a simplified way as follows. Its ECLAIRS instrument will provide alerts with localization at a rate 80 yr-1 [232]. As its energy band (4–250 keV) is similar to Swift BAT (15–150 keV), we assume that the duration distribution will be the same, as presented at the Swift website 222222http://swift.gsfc.nasa.gov/docs/swift/swiftsc.html. Since % of BAT bursts are long GRBs, and 80 % of SVOM bursts are expected at [232], the fraction of SVOM bursts with sec and is taken to be 70 %. For brevity we set sec for all SVOM alerts, anticipated to be faster than GBM. Thus the fraction of long GRBs with is estimated to be %.
Compared to GBM, alerts from SVOM will lead to a larger fraction of bursts that are fainter for CTA, since it 1) can achieve good localization at lower fluences and 2) is more sensitive to softer bursts, including those at higher redshifts that are more affected by EBL attenuation. Here we choose not to account for these effects in detail, but simply assume that the CTA detection efficiency, i. e., the ratio of detectable events (Pdet or Adet) to events that are followed up by CTA (CTAobs), is one-half of that for GBM alerts. We believe this to be a reasonable approximation; for reference, if the trigger threshold in peak photon flux for Swift BAT alerts is set to 0.4 ph s-1cm-2 in the 15–150 keV band (satisfied by 90 % of actual BAT bursts), the CTA detection efficiency with sec would be about 0.4 times that for GBM alerts with sec. In addition, we incorporate a factor of 1.4 enhancement due to anti-solar bias, following [227].
With these assumptions, Table 3 shows the resulting CTA detection rate for SVOM alerts, together with Init, CTAobs and Pobs defined analogously to the GBM case. Compared to GBM alerts, the detection rates for both prompt and afterglow emission are appreciably higher, even though the frequency of SVOM alerts suitable for CTA follow-up is comparable. This underscores the importance of GRB facilities with good localizations in the CTA era.
7 Following up alerts and wide-field mode observations
As discussed above, CTA has major scientific potential to advance our understanding of GRBs. It can both follow up GRBs found with other facilities (Sections 6,7.1) and also find GRBs using both standard and survey (i.e. wide-field) modes of operation (Section 7.3).
7.1 GRB alerts from satellites and other facilities
The study of GRBs depends crucially on localising them in an efficient manner with a positional accuracy good enough to enable multi-wavelength follow-up. Launched in 1991, the BATSE instrument on CGRO discovered thousands of these explosive events [237] but with relatively poor localisation accuracy, of order degrees. The sky and flux distributions of the BATSE GRBs strongly suggested an extragalactic origin. Proof, however, only came in in 1997 when the BeppoSAX satellite [238], which could be slew in a few hours, began to detect X-ray afterglows [239]. The BeppoSAX X-ray localisation accuracies (arcmin) were sufficient to search for optical afterglows [240] and soon led to determination of the first GRB redshifts [241].
More recently, the study of GRBs has been revolutionised by the GRB-dedicated Swift satellite [242]. Launched in 2004, Swift can slew very rapidly once it detects a GRB and use its on-board multiwavelength capability to probe the physics of both the prompt and afterglow emission. The GRB detection capabilities of Swift compared to other current and planned satellite facilities are summarised in Table 4. Although Swift is not the most prolific GRB finder, it currently provides the most accurate (arcsec), rapid (few minute) localisations. Thus the number of GRBs for which redshifts and host galaxies have been identified has dramatically increased. Swift is also used, via a Target of Opportunity upload, to provide accurate localisations for GRBs first discovered by other satellites. The French-Chinese SVOM satellite [231, 232] will provide similarly accurate GRB locations during the period when CTA becomes fully operational.
For CTA to be able to respond to an incoming trigger from another facility, it must be designed to accept such triggers using a standard protocol such as VOEvent or a GCN notice, and then act accordingly. The system must be capable of computing visibility constraints and deciding which CTA telescopes to slew. It would also be desirable to provide a real-time analysis and information distribution system that could be used to rapidly (within a minute) communicate to the community what it has found, again using a standard protocol. This capability will also be required for CTA to be used in real-time, transient survey mode (Section 7.3).
Some alerts may also be provided by ground-based air-shower detectors sensitive to TeV gamma-rays such as HAWC232323http://hawc.umd.edu/ or LHAASO242424http://english.ihep.cas.cn/ic/ip/LHAASO/. For example, HAWC should be able to detect bright bursts similar to GRB 090510 or GRB 090902B on its own, possibly down to energies as low as 50 GeV [243]. Despite having less sensitivity and higher energy threshold compared to IACTs, their much wider FoV and higher duty cycle make them valuable facilities for discovering VHE transients that may be more or less guaranteed to be detectable by CTA if followed up sufficiently rapidly.
We also note that some non gamma-ray survey facilities, such as the GAIA satellite [244], have the potential to find GRBs via their optical light, providing additional targets for CTA.
| Satellite/instrument | Energy | Observed GRB | Typical localisation | Typical |
|---|---|---|---|---|
| range | rate (yr-1) | error (radius) | delay time | |
| Swift BAT | 15–150 keV | 95 | few arcmin | 20 s |
| Swift XRT | 0.3–10 keV | 90 | 3′′ | 70 s |
| Fermi GBM | 8 keV–40 MeV | 250 | 10∘ / 1-3∘ | 20-300 s / 20 min-2 hr |
| Fermi LAT | 20 MeV–300 GeV | 10 | few deg / 10-60′ | 1 min / 4-8 hr |
| INTEGRAL IBIS | 20–100 keV | 25–50 | few arcmin | 60 s |
| Wind-KONUS | 50–200 keV | 100 | - | 1-25 hr |
| Suzaku WAM | 50–5000 keV | 95 | - | several hr |
| MAXI-ISS | 2–10 keV | 10 | 1∘ | 20 min - few hr |
| IPN | various | few | arcmin-degrees | 1-1.5 days |
| SuperAGILE | 10–40 keV | few | few arcmin | 1-3 hrs |
| SVOM Eclairs | 4–250 keV | 80 | 7′ | 10 s |
| SVOM MXT | 0.3–7 keV | 50 | 20′′ | 5 min |
7.2 Multiwavelength follow-up
As GRBs emit at all frequencies their study benefits from a suite of facilities in space and on the ground to follow them up. Examples of follow-up facilities currently in use or planned in the near future are given in Table 5. These facilities can monitor GRBs on timescales ranging from seconds to months or even years after the event. Fast-response smaller facilities are generally used as filters to identify the most important candidates, such as potential high-redshift or heavily reddened objects, which can then be investigated using the larger facilities or space-based assets.
It would be a valuable addition to the CTA observatory to have an on-site robotic telescope observing in the optical/near-infrared. This telescope — probably of 1–2m class — could provide real-time monitoring of all CTA science targets as well as providing rapid follow-up capability for transients such as GRBs. It will be especially crucial for obtaining redshifts for the bursts, either on its own or by providing further alerts with good localization to larger telescopes. The failure to measure a redshift can seriously limit the physics that can be explored even when a CTA detection is achieved.
In addition to photons, GRBs are prime candidates for the study of cosmic non-electromagnetic signals that will be studied by neutrino telescopes such as IceCube [245] (see Section 4.2), as well as gravitational wave experiments such as Advanced LIGO [246]. Gravitational waves may potentially be emitted by GRB progenitors and correlated with electromagnetic radiation in various ways (e.g. [247, 248, 249, 250]). The future simultaneous detection of photons, neutrinos and gravity waves from a GRB would be one of the greatest achievements in astrophysics.
| 6-10m | Bolshoi Teleskop Altazimuth | 2-5m | Anglo-Australian Telescope | ||||
|---|---|---|---|---|---|---|---|
| Optical/nIR | Gemini (North+South) | Optical/nIR | Bok | ||||
| Gran Telescopio Canarias | Calar Alto | ||||||
| Hobby-Eberly Telescope | Canada-France-Hawaii Telescope | ||||||
| Keck (1-2) | ESO 3.6m and 2.2m | ||||||
| Large Binocular Telescope | Hale Telescope | ||||||
| Magellan (Baade+Clay) | Lick Shane Telescope | ||||||
| South African Astronomical Observatory | Magnum Mirror Telescope | ||||||
| Subaru | New Technology Telescope | ||||||
| Very Large Telescope (1-4) | Nordic Optical Telescope | ||||||
| Telescopio Nazionale Galileo | |||||||
| UK InfraRed Telescope | |||||||
| William Herschel Telescope | |||||||
| WIYN Telescope | |||||||
| Up to 2m | ABT | LOAO | RAPTOR | Sub-mm/ | ALMA | Space | Astro-H |
| Optical/nIR | Aristarchos | Lulin | REM | mm/radio | APEX | -based | Astrosat |
| BOOTES | Maidanak | ROTSE | ASKAP | Chandra | |||
| CrAO | MASTER | ROVOR | CARMA | GEMS | |||
| Danish | McDonald | RTT | GBT | Herschel | |||
| Faulkes | MITSuME | SARA | JCMT | HST | |||
| FLWO | MOA | SkyMapper | LOFAR | NuSTAR | |||
| GRAS | Mondy | SMARTS | MeerKAT | SRG-eROSITA | |||
| GRT | Newcastle | SuperLOTIS | e-MERLIN | SVOM-VT | |||
| INT | OSN | Tarot | Mullard | Swift-UVOT | |||
| KAIT | PAIRITEL | THO | PdB | UFFO | |||
| Kanata | Palomar 60′′ | TLS | SMA | XMM-Newton | |||
| Konkoly | Pi of the Sky | Xinglong TNT | EVLA | ||||
| Lightbuckets | PROMPT | Yunnan | WSRT | ||||
| Liverpool | |||||||
7.3 Observations of GRBs and other transients in standard or wide-field modes
CTA also has the potential to open up a unique discovery space for GRBs at very high energies by finding GRBs in its own right, including those with unusual spectral energy distributions which did not trigger gamma-ray instruments. GRBs discovered by CTA itself would lead to complete coverage of the prompt emission phase, addressing important questions on the origins of both long and short-duration GRBs and on Lorentz invariance. Such observations are in fact the only way for CTA to detect or set limits on very high energy prompt emission from short GRBs, which, in the era of gravitational wave capability with Advanced LIGO, will be of great importance. Note that operation in such observing modes requires a real-time analysis routine which identifies new sources, reports new transients to the community upon detection as described in Section 7.1 and may override the current observation.
Standard observing mode. While observing a science target CTA can also be searching for transients within the field of view. Although each field of view is modest in standard mode, the total integration time would be large, CTA would be operating at maximum sensitivity and can be used during the entire duty-cycle.
Wide-field mode. In wide-field or survey mode the telescopes are offset and spread over a wide field of view to maximise solid angle [251]. Although GRBs occur equally in all regions of the sky, those around the Galactic plane are affected by interstellar absorption that hampers X-ray and optical followup efforts, necessary for good localization and redshift determination. Thus spreading the MSTs centered at a high Galactic latitude may be the most promising strategy. The much increased solid angle implies a greater GRB rate at the cost of a decrease in sensitivity, so would be complementary to transient searches in the standard observing mode. While a substantial fraction of time would have to be spent in a wide-field mode, this need not be done consecutively and could be done in parallel while the LSTs/SSTs are observing other sources, providing a low-cost transient survey mode for CTA. This mode also permits a large-area sky survey to be built up over time.
We can estimate the rates for GRBs that are potentially observable in wide-field mode, based on the sky-rates derived from current GRB-triggering satellites Swift and Fermi (Table 4). In contrast to the case of responding to external triggers (Section 6), we would not need to consider satellite time delays for reporting a GRB, nor the size of localisation errors. We assume a configuration of 25 MSTs which cover 2.5% of the sky (minimal overlap with no gaps in the field of view) and have a duty cycle of 10%. Multiplying the observed GRB rate to account for the instrument solid angle and the fraction of time spent able to trigger on GRBs, we arrive at all-sky annual GRB rates of and for BAT and GBM respectively. The rate of Swift- and Fermi-like GRBs that are observable by CTA in wide-field mode is roughly 2–3 per year, or 0.2–0.3 events per 100 hours of observation. Of this, the fraction that is actually detectable requires knowledge of the sensitivity in this mode near the energy threshold on short exposure times that is currently being studied by the MC group and will be available in the future.
A wide-field survey will be of great interest to the wider scientific community, encompassing the study of all transient phenomena, e.g. supernovae and accretion powered sources including active galaxies and X-ray binaries. Further value can be added if the timing and/or field of view were to coincide with comparable surveys at other wavelengths providing a means of characterising newly discovered phenomena. (For other aspects of surveys with CTA, see [251].)
8 Conclusions and outlook
With high photon statistics measurements of their multi-GeV spectra and temporal variability, the science cases that can be explored by observing GRBs with CTA are varied and far-reaching. In addition to the many mysteries surrounding the physics of GRBs themselves, they include the origin of ultra-high-energy cosmic rays and prospects for high-energy neutrinos via hadronic gamma-ray signatures, the cosmic history of star formation, black hole accretion and intergalactic reionization via extragalactic background light attenuation features, and precision tests of special relativity via searches for energy-dependent delays, etc. Further simulations of spectra and light curve observations in greater detail than presented here will be helpful to better quantify the prospects. In view of the modest expected detection rate of a few bursts per year, a key issue will be to assure that all GRB alerts observable with CTA are followed up sufficiently rapidly under stable conditions. Achieving an energy threshold as low as possible will also be crucial, not only for enhancing the detection rate, but also to improve the photon statistics per detection, as well as to attain the broadest energy range over which time-resolved spectra or energy-dependent light curves can be studied to address the science cases discussed here. The principal GRB alert facilities in the CTA era are likely to be SVOM and Fermi GBM, especially if the latter’s localization accuracy can be appreciably improved by that time, and possibly also Swift if its instrumental performance and funding can be maintained. Other potential satellites such as the All-Sky Transient Astrophysics Reporter (A-STAR) will undoubtedly be of great value. An onsite optical-infrared telescope would be valuable for ensuring that redshift measurements are performed for all CTA bursts. Dedicated, wide-field survey mode observations will be a unique way to discover GRBs with CTA alone including short GRBs and to detect long GRBs from their onset, as well as to conduct an unbiased search for transients.
Acknowledgements
We are grateful to Masanori Ohno for providing us with Fermi LAT data on the light curve of GRB 080916C. We thank comments from Felix Aharonian and Elisabetta Bissaldi. This work is supported in part by Grants-in-Aid from the Ministry of Education, Culture, Sports, Science and Technology (MEXT) of Japan, Nos. 22540278 and 24340048 (SI), Nos. 24103006, 24000004, 22244030, 22244019, 21684014 (KI), and No. 21740184 (RY). YI, KM and KT are supported by JSPS Research Fellowships for Young Scientists. JPO acknowledges financial support from the UK Space Agency. RS is supported by a Royal Society fellowship. DW is supported by ? 262053 and from US NSF (PHY-0970134). The research leading to these results has received funding from the European Union’s Seventh Framework Programme ([FP7/2007-2013] [FP7/2007-2011]) under grant agreement no 262053.
References
- [1] T. Piran, Rev. Mod. Phys. 76 (2005) 1143.
- [2] P. Mészáros, Rep. Prog. Phys. 69 (2006) 2259.
- [3] S. E. Woosley, J. S. Bloom, Ann. Rev. Astron. Astrop. 44 (2006) 507.
- [4] N. Gehrels, E. Ramirez-Ruiz, D. B. Fox, Ann. Rev. Astron. Astrop. 47 (2009) 567.
- [5] P. Mészáros, Astropart. Phys. (2012) (current issue; arXiv:1204.1897)
- [6] E. Waxman, Nuc. Phys. B Proc. Sup. 151 (2006) 46.
- [7] V. Bromm, A. Loeb. in Gamma-ray Bursts, Cambridge Univ. Press (arXiv:0706.2445).
- [8] N. R. Tanvir et al., Nature 461 (2009) 1254.
- [9] R. Salvaterra et al., Nature 461 (2009) 1258.
- [10] J. Ellis, N. E. Mavromatos, Astropart. Phys. (2012) (current issue; arXiv:1111.1178).
- [11] M. Doro, J. Conrad et al. (for the CTA Consortium), Astropart. Phys. (2012) (current issue).
- [12] J. Granot, for the Fermi LAT collaboration, in the Proceedings of ”The Shocking Universe - Gamma-Ray Bursts and High Energy Shock phenomena”, Venice (Italy), September 2009 (arXiv1003.2452).
- [13] F. Aharonian, J. Buckley, T. Kifune, G. Sinnis, Rep. Prog. Phys. 71 (2008) 096901.
- [14] J. A. Hinton, W. Hofmann, Ann. Rev. Astron. Astrop. 47 (2009) 523.
- [15] E. Dwek, F. Krennrich, Astropart. Phys. (2012) (current issue; arXiv:1209.4661).
- [16] D. Mazin, M. Raue et al. (for the CTA Consortium), Astropart. Phys. (2012) (current issue).
- [17] M. Actis et al. (CTA Consortium), Exp. Astron. 32 (2011) 193.
- [18] W. Hofmann, M. Martinez et al. (CTA Consortium), Astropart. Phys. (2012) (current issue).
- [19] S. Funk, J. A. Hinton (for the CTA Consortium), Astropart. Phys. (2012) (current issue; arXiv:1205.0832).
- [20] B. Dingus, in High Energy Gamma-Ray Astronomy, AIP Conf. Proc. 558, 2001, p.383.
- [21] K. Hurley et al., Nature 372 (1994) 652.
- [22] M. M. Gonźalez et al., Nature 424 (2003) 749.
- [23] J. Granot, D. Guetta, ApJ 598 (2003) L11.
- [24] A. A. Pe’er, E. Waxman, ApJ 613 (2004) 448.
- [25] A. Giuliani et al., A&A 491 (2008) L25.
- [26] D. L. Band et al., ApJ 701 (2009) 1673.
- [27] D. Guetta, E. Pian, E. Waxman, A&A 525 (2011) A53.
- [28] P. Beniamini, D. Guetta, E. Nakar, T. Piran, MNRAS 416 (2011) 3089.
- [29] M. Ackermann et al., ApJ 754 (2012) 121.
- [30] D. Band et al., ApJ 413 (1993) 281.
- [31] B.-B. Zhang et al., ApJ 730 (2011) 141.
- [32] Y. Lithwick, R. Sari, ApJ 555 (2001) 540.
- [33] A. A. Abdo et al., Science 323 (2009) 1688.
- [34] M. Ackermann et al., ApJ 716 (2010) 1178.
- [35] A. A. Abdo et al., ApJ 706 (2009) L138.
- [36] J. Granot, J. Cohen-Tanugi, E. do Couto e Silva, ApJ 677 (2008) 92.
- [37] Z. Li, ApJ 709 (2010) 525.
- [38] J. Aoi, K. Murase, K. Takahashi, K. Ioka, S. Nagataki, ApJ 722 (2010) 440.
- [39] Y.-C. Zou, Y.-Z. Fan, T. Piran, ApJ 726 (2011) L2.
- [40] R. Hascoët, F. Daigne, R. Mochkovitch, V. Vennin, MNRAS 421 (2012) 525.
- [41] M. Ackermann et al., ApJ 729 (2011) 114.
- [42] E. Nakar, Phys. Rep. 442 (2007) 166.
- [43] G. Ghisellini, G. Ghirlanda, L. Nava, A. Celotti, MNRAS 403 (2010) 926.
- [44] A. A. Abdo et al., ApJ 712 (2010) 558.
- [45] R. Sari, R. Narayan, T. Piran, ApJ 473 (1996) 204.
- [46] H. Papathanassiou, P. Mészáros, ApJ 471 (1996) L91.
- [47] R. P. Pilla, A. Loeb, ApJ 494 (1998) L167.
- [48] Z. Bosnjak, F. Daigne, G. Dubus, A&A 498 (2009) 677.
- Asano & Mészáros [2011] K. Asano, P. Mészáros, ApJ 739 (2011) 103.
- [50] S. Razzaque, C. D. Dermer, J. D. Finke, OAJ 3 (2010) 150.
- [51] K. Asano, S. Guiriec, P. Mészáros, ApJ 705 (2009) L191.
- [52] K. Asano, S. Inoue, P. Mészáros, ApJ 725 (2010) L121.
- [53] P. Kumar, R. Barniol Duran, MNRAS 400 (2009) L75.
- [54] H. N. He, X. F. Wu, K. Toma, X. Y. Wang, P. Mészáros, ApJ 733 (2011) 22.
- [55] M. De Pasquale et al., ApJ 709 (2010) L146.
- [56] Z. Li, E. Waxman, ApJ 651 (2006) 328.
- [57] A. Giuliani et al., ApJ 708 (2010) L84.
- [58] K. Toma, X. F. Wu, P. Mészáros, MNRAS 415 (2011) 1663.
- [59] R. Atkins et al., ApJ 630 (2005) 996.
- [60] A. A. Abdo et al., ApJ 666 (2007) 361.
- [61] T. Aune, P. M. Saz Parkinson for the Milagro Collaboration, Proc. of the 31st ICRC (2009) 1436.
- [62] G. Aielli et al., ApJ 699 (2009) 1281.
- [63] G. Aielli et al., Astropart. Phys. 32 (2009) 47.
- [64] J. Aleksić et al. , A&A 517 (2010) A5.
- [65] J. Aleksić et al., A&A, submitted.
- [66] J. Albert et al., ApJ 667 (2007) 358.
- [67] F. Aharonian et al., A&A 495 (2009) 505.
- [68] F. Aharonian et al., ApJ 690 (2009) 1068.
- [69] D. Lennarz et al., Proc. 32nd ICRC (2009).
- [70] S. D. Barthelmy, K. Hurley, GRB Coordinates Network 6013, 1 (2007).
- Finnegan et al. [2011] G. Finnegan, for the VERITAS Collaboration, arXiv:1111.0121
- Acciari et al. [2011] V. A. Acciari, E. Aliu, T. Arlen et al., ApJ 743 (2011) 62.
- [73] P. Mészáros, M. J. Rees, ApJ 530 (2000) 292.
- [74] C. Thompson, MNRAS 270 (1994) 480.
- [75] P. Mészáros, M. J. Rees, ApJ 482 (1997) L29.
- [76] H. C. Spruit, F. Daigne, G. Drenkhahn, A&A 369 (2001) 694.
- [77] D. Giannios, A&A 480 (2008) 305.
- [78] S. Komissarov, N. Vlahakis, A. Konigl, M. Barkov, MNRAS 394 (2009) 1182.
- [79] A. Tchekhovskoy, R. Narayan, J. C. McKinney, New Astron. 15 (2010) 749.
- [80] J. Granot, S. S. Komissarov, A. Spitkovsky, MNRAS 411 (2011) 1323.
- [81] K. Ioka, Y. Ohira, N. Kawanaka, A. Mizuta, A., Prog. Theor. Phys. 126 (2011) 555.
- [82] K. Ioka, Prog. Theor. Phys. 124 (2010) 667.
- [83] M. G. Baring, ApJ 650 (2006) 1004.
- [84] Y. Z. Fan, T. Piran, R. Narayan, D. M. Wei, MNRAS 384 (2008) 1483.
- [85] A. M. Beloborodov, ApJ 618 (2005) L13.
- [86] A. Panaitescu, ApJ 379 (2007) 331.
- [87] K. Murase, K. Toma, R. Yamazaki, S. Nagataki, K. Ioka, MNRAS 402 (2010) L54.
- [88] K. Ioka, S. Kobayashi, B. Zhang, ApJ 631 (2005) 429.
- [89] X. Y. Wang, Z. Li, Z. G. Dai, P. Mészáros, ApJ 698 (2009) L98.
- [90] D. Guetta, J. Granot, ApJ 585 (2003) 885.
- [91] D. Guetta, J. Granot, MNRAS 340 (2003) 115.
- [92] E. Nakar, S. Ando, R. Sari, ApJ 703 (2009) 675.
- [93] T. A. Thompson, P. Chang, E. Quataert, ApJ 611 (2004) 380.
- [94] Z. Bosnjak, P. Kumar, MNRAS 421 (2012) L39.
- [95] D. N. Burrows et al., Science 309 (2005) 1833.
- [96] A. A. Abdo et al., ApJ 734 (2011) L27.
- [97] X. Y. Wang, Z. Li, P. Mészáros, ApJ 641 (2006) L89.
- [98] A. Galli, D. Guetta, A&A 480 (2008) 5.
- [99] K. Murase, K. Toma, R. Yamazaki, P. Mészáros, ApJ 732 (2011) 77.
- [100] D. Giannios, A&A 455 (2006) L5.
- [101] S. D. Barthelmy et al., Nature 438 (2005) 994.
- [102] J. P. Norris, J. T. Bonnell, ApJ 643 (2006) 266.
- [103] S. B. Cenko et al., ApJ 732 (2011) 29.
- [104] J. van Paradijs, C. Kouvelitou, R. A. M. J. Wijers, ARAA 38 (2000) 379.
- [105] X. Y. Wang, H. N. He, Z. Li, X. F. Wu, Z. G. Dai, ApJ 712 (2010) 1232.
- [106] R. Y. Liu, X. Y. Wang, ApJ 730 (2011) 1.
- [107] A. Maxham, B.-B. Zhang, B. Zhang, MNRAS 415 (2011) 77.
- [108] T. Piran, E. Nakar, ApJ 718 (2010) L63.
- [109] J. A. Nousek et al., ApJ 642 (2006) 389.
- [110] P. T. O’Brien et al., ApJ 647 (2006) 1213.
- [111] B. Zhang, Y. Z. Fan, J. Dyks, S. Kobayashi, P. Mészáros, D. N. Burrows, J. A. Nousek, N. Gehrels, ApJ 642 (2006) 354.
- [112] J. Granot, Il Nuovo Cimento B, 121 (2007) 1073.
- [113] M. J. Rees, P. Mészáros, ApJ 496 (1998) L1.
- [114] J. Granot, P. Kumar, MNRAS 366 (2006) L13.
- [115] G. Ghisellini, M. Nardini, G. Ghirlanda, A. Celotti, MNRAS 393 (2009) 253.
- [116] P. Kumar, P., R. Narayan, J. L. Johnson, Science 321 (2008) 376.
- [117] J. Granot, A. Königl, T. Piran, MNRAS 370 (2006) 1946.
- [118] K. Ioka, K. Toma, R. Yamazaki, T. Nakamura, A&A 458 (2006) 7.
- [119] J. Granot, A. Panaitescu, P. Kumar, S. E. Woosley, ApJ 570 (2002) L61.
- [120] D. Eichler, J. Granot, ApJ 641 (2006) L5.
- [121] R. Shen, C. D. Matzner, ApJ 744 (2012) 36.
- [122] M. Petropoulou, A. Mastichiadis, T. Piran, A&A 531 (2011) 76.
- Waxman [1995] E. Waxman, Phys. Rev. Lett. 75 (1995) 386.
- Vietri [1995] M. Vietri, ApJ 453 (1995) 883.
- Milgrom & Usov [1996] M. Milgrom, V. Usov, Astropart. Phys. 4 (1996) 365.
- [126] E. Waxman, J. N. Bahcall, ApJ 541 (2000) 707.
- [127] M. Lemoine, G. Pelletier, MNRAS 402 (2010) 321.
- [128] D. Giannios, MNRAS 408 (2010) L46.
- Waxman & Bahcall [1998] E. Waxman, J. N. Bahcall, Phys. Rev. D 59 (1998) 023002.
- Murase & Takami [2009] K. Murase, H. Takami, ApJ 690 (2009) L14.
- Katz et al. [2009] B. Katz, R. Budnik, E. Waxman, JCAP 03 (2009) 020.
- Guetta et al. [2005] D. Guetta, T. Piran, E. Waxman, ApJ, 619 (2005) 412.
- Daigne et al. [2006] F. Daigne, E. Rossi, R. Mochkovitch, MNRAS 372 (2006) 1034.
- Le & Dermer [2007] T. Le, C. D. Dermer, ApJ 661 (2007) 394.
- Wanderman & Piran [2010] D. Wanderman, T. Piran, MNRAS 406 (2010) 1944.
- Prestwich et al. [2007] A. H. Prestwich et al., ApJ 669 (2007) L21.
- Murase et al. [2008] K. Murase, K. Ioka, S. Nagataki, T. Nakamura, Phys. ReV. D 78 (2008) 023005.
- Eichler et al. [2010] D. Eichler, D. Guetta, M. Pohl, ApJ 722 (2010) 543.
- Waxman [2010] E. Waxman, 2010, arXiv:1010.5007
- Eichler & Waxman [2005] D. Eichler, E. Waxman, ApJ 627 (2005) 861.
- Dermer [2007] C. D. Dermer, ApJ 664 (2007) 384.
- Aharonian et al. [2006] F. A. Aharonian et al., A&A 449 (2006) 223.
- Vietri [1997] M. Vietri, Phys. Rev. Lett. 78 (1997) 4328.
- Böttcher & Dermer [1998] M. Böttcher, C. D. Dermer, ApJ 499 (1998) L131.
- Totani [1998] T. Totani, ApJ 509 (1998) L81.
- [146] B. Zhang, P. Mészáros, ApJ 559 (2001) 110.
- Peer & Waxman [2005] A. Peer, E. Waxman, ApJ 638 (2005) 1018.
- Dermer & Atoyan [2006] C. D. Dermer, A. Atoyan, New J. of Phys. 8 (2006) 122.
- Gupta & Zhang [2007] N. Gupta, B. Zhang, MNRAS 380 (2007) 78.
- Asano & Inoue [2007] K. Asano, S. Inoue, ApJ 671 (2007) 645.
- Asano et al. [2009] K. Asano, S. Inoue, P. Mészáros, ApJ 699 (2009) 953.
- Murase et al. [2012] K. Murase, K. Asano, T. Terasawa, P. Mészáros, ApJ 746 (2012) 164.
- Bošnjak et al. [2009] Ž. Bošnjak, F. Daigne, G. Dubus, A&A 498 (2009) 677.
- Corsi et al. [2010] A. Corsi, D. Guetta, L. Piro, A&A 524 (2010) 92.
- Toma et al. [2009] K. Toma, X.-F. Wu, P. Mészáros, ApJ 707 (2009) 1404.
- Kobayashi, Sari & Piran [1997] S. Kobayashi, R. Sari, T. Piran, ApJ 490 (1997) 92.
- [157] K. Asano, P. Mészáros, ApJ 757 (2012) 115.
- Racusin et al. [2008] J. L. Racusin et al., Nature 455 (2008) 183.
- [159] K. Murase, S. Nagataki, Phys. Rev. Lett. 97 (2006) 051101.
- Soderberg et al. [2006] A. M. Soderberg et al., Nature 442 (2006) 1014.
- Liang et al. [2007] E. Liang, B. Zhang, F. Virgili, F., Z. G. Dai, ApJ 662 (2007) 1111.
- Murase et al. [2006] K. Murase, K. Ioka, S. Nagataki, T. Nakamura, ApJ 651 (2006) L5.
- Wang et al. [2007] X. Y. Wang, S. Razzaque, P. Mészáros, Z. G. Dai, Phys. Rev. D 76 (2007) 083009.
- Asano & Mészáros [2008] K. Asano, P. Mészáros, ApJ 677 (2008) L31.
- Murase [2009] K. Murase, Phys. ReV. Lett. 103 (2009) 081102
- He et al. [2009] H. N. He, X. Y. Wang, Y. W. Yu, P. Mészáros, ApJ 706 (2009) 1152.
- Abraham et al. [2010] J. Abraham et al. (Pierre Auger Collaboration), Phys. Rev. Lett. 104 (2009) 091101.
- Abbasi et al. [2010] R. U. Abbasi et al. (HiRes Collaboration), Phys. Rev. Lett. 104 (2010) 161101.
- Tsunesada [2011] Y. Tsunesada et al. (Telescope Array Collaboration) 2011, arXiv:1111.2507
- Wang et al. [2008] X. Y. Wang, S. Razzaque, P. Mészáros, ApJ 677 (2008) 432.
- Metzger et al. [2011] B. D. Metzger, D. Giannios, S. Horiuchi, MNRAS 415 (2011) 2495.
- Murase & Beacom [2010] K. Murase, J. F. Beacom, Phys. Rev. D 82 (2010) 043008.
- Inoue [2012] S. Inoue, in preparation.
- [174] F. Aharonian, A. M. Taylor, Astropart. Phys. 34 (2010) 258.
- Waxman & Bahcall [1997] E. Waxman, J. Bahcall, Phys. Rev. Lett. 78 (1997) 2292.
- Dermer & Atoyan [2003] C. D. Dermer, A. Atoyan, Phys. Rev. Lett. 91 (2003) 071102.
- Murase & Nagataki [2006] K. Murase, S. Nagataki, Phys. Rev. D 73 (2006) 063002.
- Abbasi et al. [2011] R. Abbasi et al. (IceCube Collaboration), Phys. Rev. Lett. 106 (2011) 141101.
- Abbasi et al. [2012] R. Abbasi et al. (IceCube Collaboration), Nature 484 (2012) 351.
- [180] P. Sapienza et al. (Km3Net Collaboration), Nuc. Phys. B Proc. Supp. 217 (2011) 272.
- [181] P. Allison et al. (ARA Collaboration), Astropart. Phys. 35 (2012) 457.
- [182] J. Miralda-Escude, E. Waxman, ApJ 462 (1996) L59.
- [183] E. Waxman, P. S. Coppi, ApJ 464 (1996) L75.
- [184] F. A. Aharonian, S. R. Kelner, A. Yu. Prosekin, Phys. Rev. D 82 (2010) 043002.
- [185] F. A. Aharonian et al., Nature 440 (2006) 1018.
- [186] J. Albert et al., Science 320 (2008) 1752.
- [187] N. R. Butler, J. S. Bloom, D. Poznanski, ApJ 711 (2010) 495.
- [188] A. Cucchiara et al., ApJ 736 (2011) 7.
- [189] V. Bromm, A. Loeb, ApJ 642 (2006) 382.
- [190] K. Toma, T. Sakamoto, P. Mészáros, ApJ 731 (2011) 127.
- [191] H. Sol, A. Zech, C. Boisson et al. (for the CTA Consortium), Astropart. Phys. (2012) (current issue).
- [192] T. M. Kneiske, T. Bretz, K. Mannheim, D. Hartmann, A&A 413 (2004) 807.
- [193] F. W. Stecker, M. A. Malkan, S. T. Scully, ApJ 648 (2006) 774.
- [194] A. Franceschini, G. Rodighiero, M. Vaccari, A&A 487 (2008) 837.
- [195] R. C. Gilmore, P. Madau, J. R. Primack, R. S. Somerville, F. Haardt, MNRAS 399 (2009) 1694.
- [196] J. Finke, S. Razzaque, C. D. Dermer, ApJ 712 (2010) 238.
- [197] A. Dominguéz et al., MNRAS 410 (2011) 2556.
- [198] R. C. Gilmore, R. S. Somerville, J. R. Primack, A. Dominguéz, MNRAS (2012) 422, 3189.
- [199] Y. Inoue, S. Inoue, M. A. R. Kobayashi, R. Makiya, Y. Niino, T. Totani, ApJ, submitted (arXiv:1212.1683)
- [200] A. A. Abdo et al., ApJ 723 (2010) 1082.
- [201] P. Jakobsen et al., Nature 370 (1994) 35.
- [202] S. R. Furlanetto, S. P. Oh, ApJ 691 (2008) 1.
- [203] C.-A. Faucher-Giguère, A. Lidz, L. Hernquist, M. Zaldarriaga, ApJ 688 (2008) 85.
- [204] C.-A. Faucher-Giguère, A. Lidz, M. Zaldarriaga, L. Hernquist, ApJ 703 (2009) 1416.
- [205] R. Barkana, A. Loeb, Phys. Rep. 349 (2001) 125.
- [206] B. Ciardi, A. Ferrara, Space Sci. Rev. 116 (2005) 625.
- [207] S. P. Oh, ApJ 553 (2001) 25.
- [208] S. Inoue, R. Salvaterra, T. R. Choudhury, A. Ferrara, B. Ciardi, R. Schneider, MNRAS 404 (2010) 1938.
- [209] R. Plaga, Nature 374 (1995) 430.
- [210] S. Razzaque, P. Mészáros, B. Zhang, ApJ 613 (2004) 1072.
- [211] K. Ichiki, S. Inoue, K. Takahashi, ApJ 682 (2008) 127.
- [212] K. Takahashi, K. Murase, K. Ichiki, S. Inoue, S. Nagataki, ApJ 687 (2008) L5.
- [213] K. Murase, B. Zhang, K. Takahashi, S. Nagataki, MNRAS 396 (2009) 1825.
- [214] K. Takahashi, S. Inoue, K. Ichiki, T. Nakamura, MNRAS 410 (2011) 2741.
- [215] A. Neronov, D. Semikoz, Phys. Rev. D 80 (2009) 123012.
- [216] L. Widrow, Rev. Mod. Phys. 74 (2002) 775.
- [217] U. Jacob, T. Piran, JCAP 01 (2008) 031.
- [218] A. A. Abdo et al., Nature 462 (2009) 331.
- [219] J. D. Scargle, J. P. Norris, J. T. Bonnell, ApJ 673 (2008) 972.
- [220] E. Troja, S. Rosswog, N. Gehrels, ApJ 723 (2010) 1711.
- [221] R. Margutti et al., MNRAS 417 (2011) 2144.
- [222] K. Bernlöhr et al. (for the CTA Consortium), Astropart. Phys. (2012) (current issue; arXiv:1210.3503).
- [223] S. Razzaque, C. D. Dermer, J. D. Finke, ApJ 697 (2009) 483.
- Gilmore et al. [2011,b] R. C. Gilmore, J. R. Primack, A. Bouvier, A. N. Otte, 2011, arXiv:1102.2112
- Gilmore et al. [2011,a] R. C. Gilmore, A. Bouvier, V. Connaughton, A. Goldstein, A. N. Otte, J. R. Primack, D. A. Williams, Exp. Astron., in press (arXiv:1201.0100).
- [226] J. Kakuwa, K. Murase, K. Toma, S. Inoue, R. Yamazaki, K. Ioka, MNRAS 425 (2002) 514.
- Gilmore et al. [2010,d] R. C. Gilmore, F. Prada, J. R. Primack, MNRAS 402 (2010) 565.
- [228] M. Garczarczyk et al., arXiv:0907.1001
- Li & Ma [1983] T. Li, Y. Ma, ApJ 272 (1983) 317.
- Meegan et al. [2009] C. Meegan et al., ApJ 702 (2009) 791.
- [231] S. Schanne et al., 2010, Proc. of the conference ”The Extreme sky: Sampling the Universe above 10 keV”, October 13-17, 2009, Otranto (Lecce) Italy, in press, (arXiv:1005.5008)
- Paul et al. [2011] J. Paul, J. Wei, S. Basa, S.-N. Zhang, Comptes Rendus Physique 12 (2011) 298 (arXiv:1104.0606).
- [233] D. Yonetoku, T. Murakami, T. Nakamura, R. Yamazaki, A. K. Inoue, K. Ioka, ApJ 609 (2004) 935.
- [234] G. Ghirlanda, L. Nava, G. Ghisellini, A. Celotti, C. Firmani, A&A 496 (2009) 585.
- [235] Y. Kaneko, R. D. Preece, M. S. Briggs et al., ApJS 166 (2006) 298.
- [236] F. A. Aharonian, A. K. Konopelko, H. J. Völk, H. Quintana, Astroparticle Phys. 15 (2001) 335.
- [237] W. S. Paciesas et al., ApJS 122 (1999) 465.
- [238] G. Boella et al., A&AS 122 (1997) 299.
- [239] E. Costa et al., Nature 387 (1997) 783.
- [240] J. van Paradijs et al., Nature, 386 (1997) 686.
- [241] M. Metzger et al., Nature 387 (1997) 878.
- [242] N. Gehrels et al., ApJ 611 (2004) 1005.
- [243] A. U. Abeysekara et al., Astropart. Phys. 35 (2012) 641.
- [244] M. A. C. Perryman, Ap&SS 280 (2002) 1.
- [245] F. Halzen, S. R. Klein, Review of Scientific Instruments 81 (2010) 081101.
- [246] G. Harry et al., Class. Quantum Grav., 27 (2010) 084006.
- [247] C. S. Kochanek and T. Piran, ApJ 417 (1993) L17.
- [248] S. Kobayashi and P. Mészáros, ApJ 589 (2003) 861.
- [249] G. E. Romero, M. M. Reynoso, H. R. Christiansen, A&A 524 (2010) A4.
- [250] C. L. Fryer and K. C. B. New, Living Rev. Relativity 14 (2011) 1.
- [251] G. Dubus et al. (for the CTA Consortium), Astropart. Phys. (2012) (current issue; arXiv:1208.5686).