NEAR-INFRARED POLARIMETRY OF A NORMAL SPIRAL GALAXY VIEWED THROUGH THE TAURUS MOLECULAR CLOUD COMPLEX
Abstract
Few normal galaxies have been probed using near-infrared polarimetry, even though it reveals magnetic fields in the cool interstellar medium better than either optical or radio polarimetry. Deep band (1.6 m) linear imaging polarimetry toward Taurus serendipitously included the galaxy 2MASX J04412715+2433110 with adequate sensitivity and resolution to map polarization across nearly its full extent. The observations revealed the galaxy to be a steeply inclined (°) disk type with a diameter, encompassing 90% of the Petrosian flux, of 4.2 kpc at a distance of 53 Mpc. Because the sight line passes through the Taurus Molecular Cloud complex, the foreground polarization needed to be measured and removed. The foreground extinction AV of 2.000.10 mag and reddening of 0.1250.009 mag were also assessed and removed, based on analysis of 2MASS, UKIDSS, Spitzer, and WISE photometry using the NICE, NICER, and RJCE methods. Corrected for the polarized foreground, the galaxy polarization values range from zero to 3%. The polarizations are dominated by a disk-parallel magnetic field geometry, especially to the northeast, while either a vertical field or single scattering of bulge light produces disk-normal polarizations to the southwest. The multi-kpc coherence of the magnetic field revealed by the infrared polarimetry is in close agreement with short wavelength radio synchrotron observations of edge-on galaxies, indicating that both cool and warm interstellar media of disk galaxies may be threaded by common magnetic fields.
1 Introduction
What roles do magnetic fields play in the interstellar media (ISM) of galaxies, and how are those fields created and sustained? How common are galaxy-wide magnetic fields in normal galaxies like the Milky Way? Radio observations have revealed a wealth of information about magnetic fields by tracing total and polarized synchrotron emission and Faraday rotation in the warm, diffuse gas in galaxies (see reviews by Beck et al., 1996; Beck, 2009), but there are few observational techniques capable of probing magnetic fields in the cooler, star-forming ISM in normal galaxies (e.g., Jones, 1997; Packham et al., 2011).
The radio observations generally show disk-parallel (toroidal) magnetic fields for edge-on disk galaxies (e.g., Sukumar & Allen, 1991; Dumke et al., 1995; Krause et al., 2006; Soida et al., 2011), with transitions to more vertical (poloidal) fields in the halos. Optical wavelength polarizations, originally thought to arise from dichroic (selective) extinction (Serkowski et al., 1975) that traced magnetic fields (e.g., Scarrott & Draper, 1996), show polarization orientations perpendicular to galaxy disks. Fendt et al. (1996) carefully compared their optical polarimetry to radio synchrotron polarimetry for three highly-inclined disk galaxies and concluded that single scattering dominates at optical wavelengths. As a result, magnetic information is not revealed by optical polarimetry of such galaxies. In the near-infrared (NIR), scattering is less important (Wood, 1997; Wood & Jones, 1997), enabling NIR polarimetry to reveal magnetic fields in the cool, star-forming ISM that radio synchrotron emission and polarization often appear to avoid (Beck, 2009).
The Galactic Plane Infrared Polarization Survey (GPIPS: Clemens et al., 2012a) is in the process of using background NIR starlight polarization at band (1.6 m) to probe the magnetic field of the star-forming mid-plane of the northern Milky Way. GPIPS reveals the field to distances in the disk of about 5 – 7 kpc, on arcmin scales. To put GPIPS findings in context and to enable testing models of the Milky Way magnetic field (Pavel, 2011; Jansson & Farrar, 2012a, b), NIR polarimetric observations of external, Milky Way analog galaxies are needed. Only a few edge-on systems have been previously polarimetrically detected (Jones, 1989) or partially mapped (Jones, 1997) in the NIR. Recent observations of M51, a face-on grand-design spiral previously mapped with optical polarimetry (Scarrott et al., 1987), failed to detect band polarization, to quite low levels (Pavel & Clemens, 2012). Infrared polarimetry of active galaxies, such as M82 (Bingham et al., 1976; Jones, 2000) and others (Ruiz et al., 2000, 2003), have revealed complicated, multi-origin polarization components, but the degree to which these objects inform our understanding of the magnetic fields in more normal galaxies like the Milky Way is unclear.
A new small area, deep band polarization survey of a portion of the Taurus Molecular Cloud complex (distinct from the study of Chapman et al. 2011) was undertaken to examine relationships between magnetic fields and turbulence (Falgarone et al., 2013). Serendipitously, one resolved disk galaxy was apparent in the observations. The galaxy proved bright enough to measure near-infrared (NIR) polarization across almost its full extent. Given how very few galaxy observations in the NIR meet those conditions, a more detailed analysis was warranted.
However, because this galaxy (2MASX J04412715+243311, designated hereafter as the ‘T-Galaxy’ for its location in Taurus), is viewed through the gas, dust, and magnetic fields associated with the Taurus Molecular Cloud complex (Heyer et al., 1987), it was necessary to calibrate and remove the foreground Galactic effects on the polarization and photometric observations. This was challenging because the expected T-Galaxy band polarization and the foreground Taurus polarization were likely to have similar percentage values. Described in the following sections are the new band polarization observations, the data reduction, the general properties determined for the T-Galaxy from the band photometry, the determination of the Taurus region foreground polarization and extinction, the correction to the T-Galaxy polarization observations, and analysis of the nature of the magnetic field present in the T-Galaxy and how its field relates to those in other normal galaxies.
2 Observations and Data Reduction
2.1 Polarimetry
Ground-based near-infrared band (1.6 m) imaging polarimetry observations were conducted on the night of 2011 October 13 (UT) using the Mimir instrument (Clemens et al., 2007) on the 1.83 m Perkins telescope, located outside Flagstaff, AZ. The observations consisted of four sets of 96 images, each of 10 s exposure time. Each set consisted of six sky dither positions, distributed about a hex-pattern of diameter 15 arcsec, with sixteen images at each dither position. Those sixteen images were obtained through sixteen distinct rotation angles of the cold, compound half-wave-plate (HWP) to modulate the incoming linear polarization stellar signals and were analyzed by a cold, fixed wire grid prior to detection by the pixel InSb Aladdin III array. They provided a four-fold redundancy for calculating the four independent polarization position angles (IPPAs: 0, 45, 90, 135°) used to form the total intensity normalized linear polarization Stokes and percentages222Stokes values in this paper are formally and , but are designated and to reflect conventional usage at optical and infrared wavelengths.. The pixel size was 0.58 arcsec and the full image size was arcmin. The details of the data collection methodology follow closely those employed for GPIPS, as described in Clemens et al. (2012a).
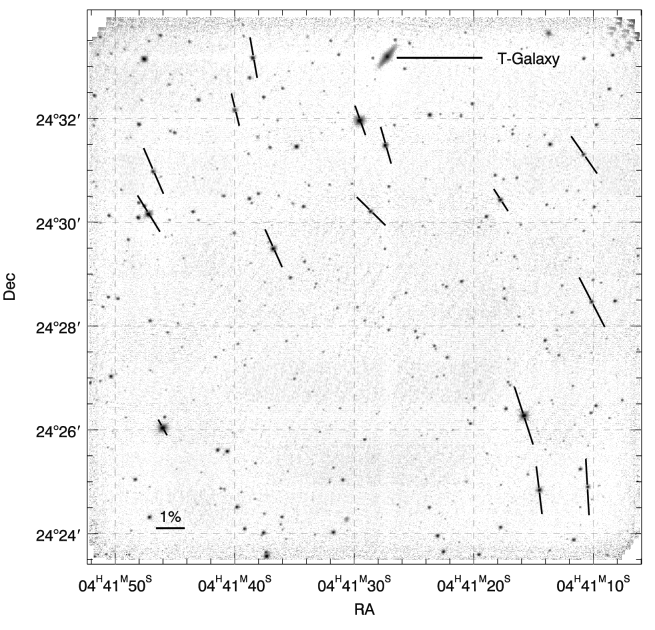
Reduction of the Mimir data also followed the GPIPS pipeline approach (Clemens et al., 2012a), which included detector non-linearity correction, HWP angle-specific flat-fielding, and dark current corrections as well as corrections for sky transmission variations and instrumental polarization. The images were background-corrected in two ways. For analysis of the stars in the field, development of ‘super-sky’ corrections were used to model and remove the background from the images, as is normally done for GPIPS data. For analysis of the T-Galaxy, the same images had background zones free of emission identified and those pixels were used in a second order fit to model and remove the background near the T-Galaxy. This avoids inadvertent removal of faint, extended emission from the T-Galaxy that super-sky use might cause, given the small dither offsets used. All of the images were combined to yield a Stokes (total intensity) image, shown in Figure 1. The T-Galaxy appears in the top middle of the Figure. The stars have FWHM values of pixels, or 1.75 arcsec.
GPIPS stellar polarization values are normally calculated from point spread function (PSF) cleaned aperture photometry of the stars found in the 16 HWP images for each field, after registering and averaging the corresponding HWP images from all dithered observations. Stars in the T-Galaxy field were analyzed for their polarization properties using the normal GPIPS stellar processing, which yielded a catalog of polarizations, positions, and photometry for the stars that matched to 2MASS (Skrutskie et al., 2006) ones. A total of 239 stars had polarization measurements completed, though less than 10% of those were significantly detected in polarization. This low detection rate is due to the low numbers of stellar photons counted for the fainter stars and the background levels present in the band. Figure 1 shows the polarization properties of fifteen field stars exhibiting low polarization uncertainties (, but also filtered such that %). The 200+ polarization non-detection stars are still useful, as their Stokes and percentages are gaussian distributed, and may be averaged, with weighting, to yield significant polarimetric information, as described in Section 4.1, below.
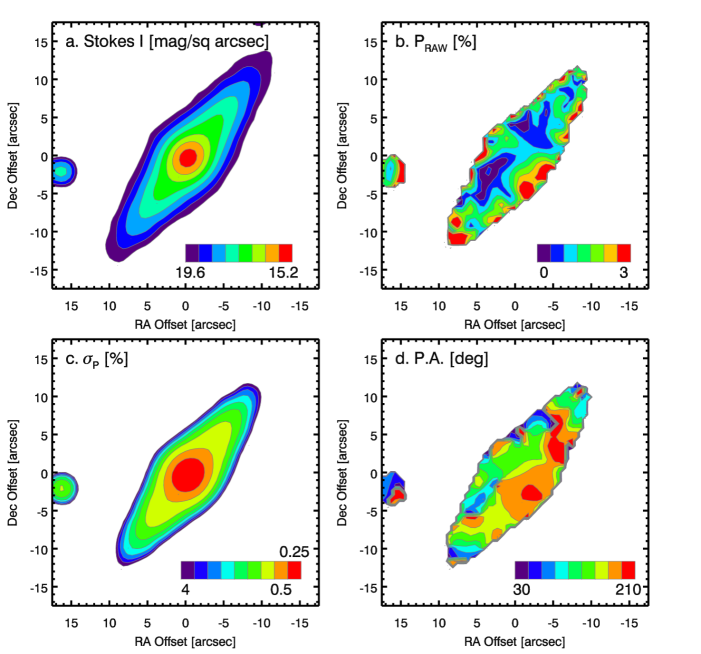
To polarimetrically analyze the resolved T-Galaxy data, the HWP images were instead averaged into four IPPA images and combined to produce Stokes and percentage and uncertainty images. These were corrected for the Mimir instrumental polarization (Clemens et al., 2012b), before uncertainty-weighted smoothing with a 1.75 arcsec FWHM gaussian (matching the seeing). The resulting and images were used to calculate raw percentage polarization and position angle P.A. images, along with uncertainties. The Stokes , raw polarization percentage , polarization percentage uncertainty , and polarization P.A. images are all shown in Figure 2. Each panel in the figure spans a arcsec portion of the Figure 1 field that is centered on the T-Galaxy and includes an unrelated, Galactic star at center left.
The total intensity Stokes image (Figure 2.a) shows an inclined, disk-type galaxy with a central bulge. Along the major axis, it shows emission above the sky level over about 40 arcsec, or about 10 kpc at a distance of 52.7 Mpc (Crook et al., 2007). The color legend in the panel indicates the range of excess surface brightness in the band, above the background of 14.2 mag arcsec-2, spanning 19.6 to 15.2 mag arcsec-2 in a logarithmic fashion. The polarization percentage uncertainty image (Figure 2.c) shares the same shape characteristics as the Stokes image, indicating that poisson noise dominates the photometric, and thereby polarimetric, uncertainties. The rendering is clipped at an upper value of 4%, and used as the basis to generate an image mask that is applied to the (Fig. 2.b) and P.A. (Fig. 2.d) images. These images are displayed as colored contours only between the limits indicated in the color legends shown at lower right in each panel.
The panel (Figure 2.b) shows polarization detection across almost the full extent of the galaxy, with lower values in two zones offset from the center and higher values (albeit more uncertain) toward the galaxy edges. The P.A. panel (Figure 2.d) displays the polarization P.A.s, which have been modified to resolve aliasing about 180°, so as to track behavior of the pixels across the histogram of P.A.s (not shown) more smoothly. This results in apparent P.A. values spanning a range of 30 to 210°, as indicated in the color legend in that panel. The P.A. values seem to favor polarization orientations of about 130° to the northeast (NE) of the photometric center and closer to 188° to the southwest (SW). The former is close to the elongation direction of the major axis (142°, see below). Neither is along the direction favored by the polarization orientations of the stars in the field (Figure 1). Thus, although correction for the Taurus foreground polarization contribution will be important to generating images of and P.A. intrinsic to the T-Galaxy, the apparent detections presented in Figure 2 were not produced by the foreground polarization.
2.2 Spectroscopy
NIR spectroscopy observations were obtained toward the mag core of the T-Galaxy, using Mimir and the Perkins on the night of 2012 September 25. The spectral range covered the full H and K bands (1.4 - 2.5m) at a resolution of about 500, using a 1.2 arcsec wide by 5 arcmin tall slit. Eight spectral images with 5 min exposure time were dithered along the slit. Wavelength calibration used an Argon lamp. Correction for telluric absorption was done using observation of k Tau (a bright A0V star) through nearly the same airmass and sky direction. All spectra were wavelength-calibrated, using the 2D dispersion function obtained from the Argon images, and registered before adding (with outlier rejection). The k Tau spectrum was fit and modeled to remove its hydrogen absorption lines in order to develop a telluric transmission spectrum, using the xtellcor routine in the SpeXTool package (Cushing et al., 2004). This was wavelength matched and divided into the summed T-Galaxy spectrum. The resulting atmosphere-corrected spectrum for the T-Galaxy is shown as Figure 3. It presents a mostly thermal, cool stellar population appearance, peaking at about 1.65 m. There are no strong emission or absorption lines seen, to a limit of 5% of the continuum. This includes a lack of Br (2.166 m), either at zero velocity or at the redshift indicated for the T-Galaxy (see below).
3 T-Galaxy General Properties
This galaxy was first studied by Crook et al. (2007), who used the 2MASS Extended Source Catalog (XSC: Jarrett et al., 2000) as input to the 2MASS Redshift Survey (2MRS: Huchra et al., 2005a, b) to search for groups of galaxies containing at least three members. The T-Galaxy was listed as the second rank member of the five-galaxy group designated number 308 by Crook et al. (2007), whose measured radial velocity of 3868 km s-1 places the T-Galaxy at a distance of 52.7 Mpc (z 0.013 for = 73 km s-1 Mpc-1). Its nearest group neighbor is located some 11 arcmin (170 kpc) away in sky projection, so they are unlikely to be interacting.
The T-Galaxy Stokes image (Figure 2.a) exhibits a circular radius encompassing 90% of the Petrosian flux (Petrosian, 1976) of 11.75 pixels, or 1.75 kpc at 53 Mpc. The similarly computed 50% radius lead to a Petrosian concentration index of 2.9. This 50% Petrosian radius is about twice the FWHM seeing, so the concentration index should be unaffected.
This image of the T-Galaxy was fit with a combination Sérsic (1963, 1968) disk model and an exponential bulge model using the MPFIT package (Markwardt, 2009). The galaxy disk was assumed to be circular when viewed face-on to allow deprojecting the fundamental disk and bulge parameters simultaneously. The deprojected bulge was allowed to be elliptical with its own eccentricity and orientation. The line-of-sight inclination angle was found to be 73.70.1° (i.e., close to edge-on), deprojected along P.A. 141.60.1°, measured East from North.
The independent fits to the bulge and disk allowed calculation of the bulge-to-total (B/T) flux ratio, found to be 0.240.04. This is a brighter bulge than for the Milky Way, whose B/T ratio is in the range 0.11–0.13 (van der Kruit, 1984). The T-Galaxy disk scale length was found to be 11.30.3 pixels (1.7 kpc) and the bulge scale length was 0.890.03 pixels (130 pc). Milky Way disk scale lengths are larger, with estimates ranging from 2.26 kpc (Drimmel & Spergel, 2001) to 3.3 kpc (López-Corredoira et al., 2002). The T-Galaxy bulge orientation was 142.65.6° (well-aligned with its disk) and the bulge inclination was 60.93.7°. The radial profile shows a small excess around a deprojected radius of 4 arcsec (1 kpc), which could indicate the presence of luminous spiral arms in the disk and confirm the spiral galaxy designation.
The band magnitude integrated out to the Petrosian radius is 11.35, yielding an absolute magnitude in this band of prior to any extinction correction (see section 4). The radius, concentration index, B/T ratio, and absolute magnitude are all consistent with the T-Galaxy being a mid-type spiral. The HK spectroscopy confirms that the bulge does not appear to harbor a significant active galactic nucleus (AGN).
In all of these aspects, the T-Galaxy would seem to be a Milky Way analog, though smaller, of somewhat lower mass, and with a brighter bulge.
4 Foreground Extinction and Polarization Determinations
Because the T-Galaxy is viewed through the nearby (d = 147.60.6 pc: Lionard et al., 2007) Taurus Molecular Cloud complex, which is known to exhibit both significant extinction, in the form of dark clouds and intercloud material (e.g., Heyer et al., 1987), and magnetic fields, as previously traced through optical (Moneti et al., 1984; Heyer et al., 1987) and NIR starlight polarimetry (Moneti et al., 1984; Goodman et al., 1992; Chapman et al., 2011), the effects of this foreground material had to be quantified and removed to obtain the intrinsic T-Galaxy properties. For the foreground polarization, analysis of the Mimir polarimetry of the stars in the field containing the T-Galaxy was performed and evaluated. For the photometric extinction and contributed reddening, analysis of stellar photometry in a somewhat larger field centered on the T-Galaxy was performed, using several available data sets.
4.1 Foreground Polarization
Within the arcmin Mimir field, 239 stars were sufficiently bright for polarimetric evaluation (i.e., were detected in each of the four IPPAs of the HWP). Of these, twelve showed good polarization signal-to-noise () and 227 stars showed lower signal-to-noise. By separating the stars into two stellar samples based on their S/N ratios, the effects of distance on the foreground polarization contribution could be examined. This analysis followed that described in Clemens et al. (2012c), where stellar sample mean magnitude (which relates to S/N for poisson-limited polarimetry) was shown to be a useful proxy for distance. The Stokes and percentages for each of these two samples were separately averaged, using inverse variance weighting.
The same Stokes uncertainty variance weighting was applied to the band magnitudes for each stellar sample, resulting in a weighted mean of 10.7 mag for the 12 star sample and 13.6 for the remainder sample. If both samples contain the same types of stars, the remainder sample would be on average about four times more distant than the 12 star sample. A high fraction of the stars in both samples are expected to be giants, and to be located kiloparsecs beyond (Clemens et al., 2012a) the much nearer Taurus Molecular Cloud complex. There should be relatively few stars foreground to Taurus in the Mimir field, and any present would likely show little to no band polarization.
The Stokes and percentage means for the two samples were found to agree to within 1.5 times their propagated uncertainties. Thus, a significant change in polarization across the distances probed using the stars in the field was not found. The two sets were therefore combined and weighted means were computed for the Stokes percentage parameters. The weighted mean percentage values found across all 239 stars were:
| (1) | |||
where the subscript ‘FG’ identifies the foreground contribution and has been Ricean-corrected to debias for the polarimetric uncertainty, following Wardle & Kronberg (1974).
These parameters best represent the foreground, Galactic polarization properties (localized in the dust associated with the Taurus Cloud complex) along the line of sight to the T-Galaxy. It should be noted that the portion of the line of sight between the farthest Galactic star and the T-Galaxy is not represented in our sample of stellar probes. However, the likelihood of that region having sufficient magnetic field tracing dust at these Galactic latitudes to affect the color and polarization of the T-Galaxy is low. Alternatively, the Galactic foreground stellar polarizations could be affected by partially canceling polarization components along the different pathlengths to the stars. The general coherence of the magnetic field orientations revealed in Figure 1 and the close agreement of the Stokes and values for the two subsamples make this also unlikely.
Finally, because the foreground polarization is small and the optical depth at band is much less than unity, subtraction of the FG Stokes percentages from the observed and percentage images for the T-Galaxy is sufficient to correct the polarization properties for the effects of the foreground Taurus layer.
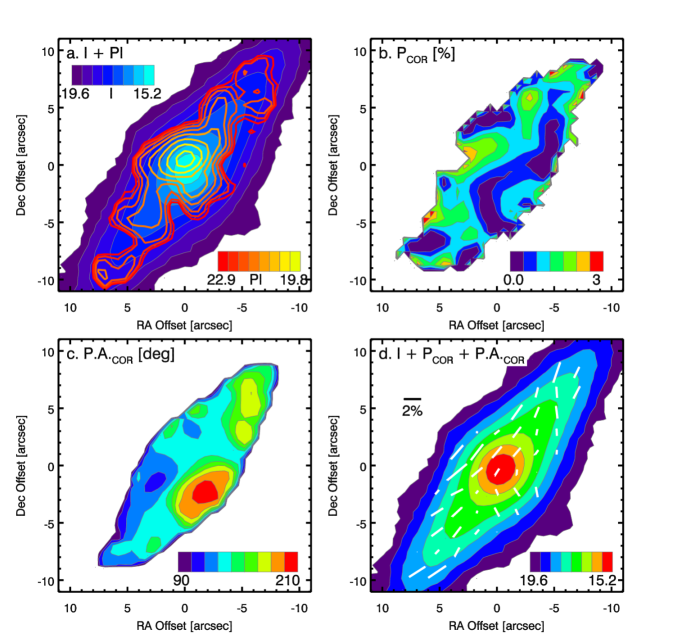
In summary, the steps taken to develop images of the intrinsic NIR polarization of the T-Galaxy begin with forming the four IPPA images from the 16 HWP images and using these to generate Stokes and percentage images and their uncertainty images. These were each smoothed, using a gaussian of 1.75 arcsec FWHM with inverse variance squared weighting from the uncertainty images. From the smoothed and images, the foreground contributions and were subtracted. The new and images and their uncertainty images were combined to form and P.A.COR images (and uncertainties), where the subscript ‘COR’ denotes correction for the foreground contributions. Finally, the polarization percentage uncertainty image was used to Ricean-correct the polarization percentage image to yield a image. To allow comparison with radio synchrotron maps, the Stokes image was multiplied by the image to produce a polarized intensity () image. All of these quantities are displayed for the central arcsec of the T-Galaxy in Figure 4 and described in detail in section 5.2, below.
4.2 Foreground Extinction and Reddening
In addition to correcting for the foreground polarization effects, correcting for the reddening by the Taurus layer is necessary in order to obtain accurate colors for the T-Galaxy. In particular, reddening correction in the color is needed to allow comparing the T-Galaxy polarimetry and dust column densities to similar values for the Milky Way and edge-on galaxies (Jones, 1997). Such an assessment can reveal whether the polarization measured across the T-Galaxy is dominated by dichroic (selective) extinction, and so able to trace magnetic fields, or whether scattering dominates and is unable to reveal magnetic field properties.
Several photometric data sets were available for estimating the extinction and reddening along this sight line, up through the DR7 data release from the Galactic Cluster Survey (GCS) of the UKIRT Infrared Deep Sky Survey (UKIDSS: Lawrence et al., 2007). Methods for estimating reddening and extinction from broadband photometric data include Near-Infrared Color Excess (NICE: Lada et al., 1994), NICE-Revisited (NICER: Lombardi & Alves, 2001), and Rayleigh-Jeans Color Excess (RJCE: Majewski et al., 2011).
The Appendix summarizes the steps, tests, and potential pitfalls associated with estimating the foreground extinction along this line of sight from these multiple data sets and methods. The values of and finally adopted were mag and mag, respectively.
5 Analysis
5.1 2MASS Color and Excess
The Figure 1 field was observed here only through a single filter () using Mimir. So, to examine the color variation across the T-Galaxy, 2MASS images in , , and bands were examined, and an color map was formed. This observed color map was corrected for the foreground color (0.125 mag) and a second correction of 0.15 mag was subtracted. This latter value is that typically used in the NICE method (Lada et al., 1994) as representing the average intrinsic color for field stars (in the absence of a reference field color distribution). The net effect was the production of a color excess map to use as a proxy for dust column density across the T-Galaxy.
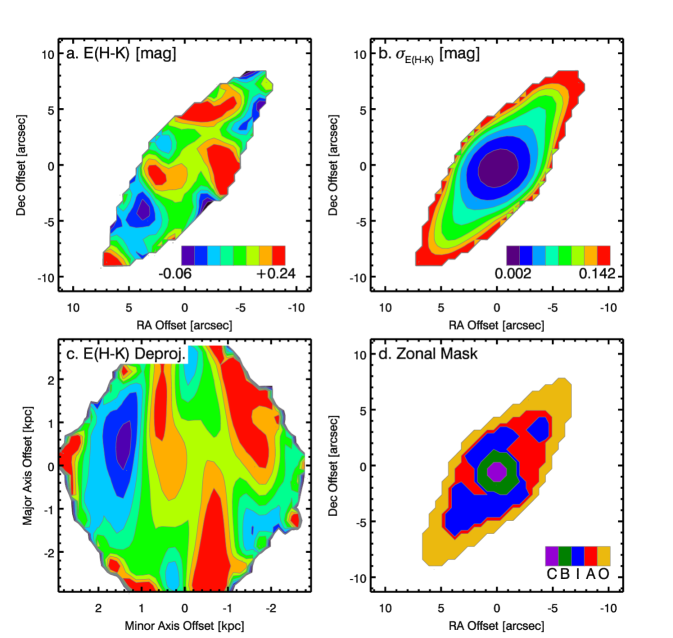
The distribution of this 2MASS-traced color excess is shown in the upper left panel of Figure 5, with its uncertainty shown in the upper right panel. The panel reveals weak, but significant color shifts across the face of the T-Galaxy. Two symmetric arm-like features are seen to the East and West of the galaxy center as regions of increased reddening, surrounded by regions of decreased reddening. Using the orientation and inclination properties described in Section 3, a deprojected and rotated version of the map was calculated and is presented in the lower left panel of Figure 5. Axes for this panel are presented as linear offsets along the directions of the (projected) major and minor axes, based on the distance to the T-galaxy. If the two reddened arm-like features are spiral arms, they are located only 1 - 2 kpc from the galaxy center. They likely correspond to the photometric feature noted at four arcsec radial offset in Section 3 as possibly indicating the presence of spiral arms. Note that this representation only spans the inner 5 kpc where color uncertainties are small; the full photometric extent is about twice as large.
Finally, the bottom right panel of Figure 5 displays a classification of zones in the T-Galaxy, selected for their color excess uncertainty, polarization percentage uncertainty, and, for two of the zones, their color excess values. The selection criteria are listed in the second through fourth columns of Table 1. Classification names of ‘Core,’ ‘Bulge,’ ‘Interarm,’ ‘Arms,’ and ‘Outer’ reflect their locations and color properties. The first two zones have the smallest uncertainties of color excess and polarization, but no color value selection. These criteria map to the brightest pixels in the T-Galaxy Stokes image. The next two zones have identical color excess and polarization uncertainty criteria, but were split into two groups about mag. This produces an ‘Arms’ zone that encompasses at least the inner, more certain color excess and polarization locations showing the redder extinctions identified in Figure 5.a, as distinct from the ‘Interarm’ zones that exhibit bluer colors. Finally, the ‘Outer’ zone collects the remaining locations for which the polarization uncertainty is under 1.2%. Analysis of the T-Galaxy classified into these five zones with the foreground-corrected polarization properties (see next section), enabled testing for correlations between polarization and color excess that may relate to zone classification and galaxy structure.
5.2 T-Galaxy Polarization
The foreground corrected polarization properties for the T-Galaxy are shown for the central arcsec in Figure 4. The upper left panel (Figure 4.a) shows contours of polarized intensity overlaid on a false color logarithmic representation of the Stokes image. There, the brightest peak in is offset to the North of the photometric center, while a weaker secondary peak is offset to the South. An alternate explanation is that the photometric peak is bisected by a depolarization feature that is distributed somewhat linearly and mostly parallel to the major axis, as though the bright bulge were shadowed, at least polarimetrically, by the intervening disk. Superposition of disk-parallel and disk-normal (vertical) magnetic fields could also account for the apparent depolarization. The image shows extensions along the major axis to the NW and SE, with hints of localized maxima at the ends of the major axis.
The polarization percentage image (Figure 4.b) reveals polarizations of about 1–2% across most of the extent of the T-Galaxy. There is a prominent zone of nearly zero polarization percentage surrounding the isolated 1% polarized feature centered at an offset of arcsec. This same feature shows distinctly different P.A. values (Figure 4.c) than the remainder of the T-Galaxy. Most of the T-Galaxy shows a relatively uniform P.A. of about 130°, which is similar to the major axis position angle on the sky.
When the corrected polarization percentage and position angle data are combined with the photometric image, the result, shown in Figure 4.d, reveals coherent behavior across many kpc of separation. The vectors shown represent the and P.A.COR behavior averaged over pixels (FWHM seeing) and rendered only every three pixels in each direction to preserve independence. A predominance of disk-parallel polarization is seen, though in the region SW of the center the polarization vectors become disk-normal. This SW feature may be evidence for a vertical (poloidal) magnetic field or it could signify scattering of bulge light by disk or halo dust. The absence of a symmetric zone of disk-normal polarizations to the NE of the center would seem to favor the latter explanation.
Overall, the NIR polarizations look remarkably similar to many of the radio synchrotron polarization maps of the disk portions of edge-on galaxies, such as those in Sukumar & Allen (1991), Dumke et al. (1995), Krause et al. (2006), and Soida et al. (2011). In particular, the combined Effelsberg 100 m and VLA radio polarization map of NGC5775 by Soida et al. (2011) exhibits virtually all of the same magnetic field characteristics as seen in the NIR for the T-Galaxy. Both galaxies show nearly edge-on disks dominated by disk-parallel magnetic fields. The NGC5775 radio map (Figure 7 of Soida et al. (2011)) shows the same disk-normal component offset from the center to the SW as seen here in Figure 4.d.
The NGC5775 radio observations are better able to probe fields in the warm ionized plasma and reveal an ‘X-shaped’ halo field off of the disk plane (a model is sketched in Figure 12 of Soida et al. (2011)). The NIR of Figure 4.d may be revealing a similar X-shaped halo field to the SW, but some caution must be applied, as the NIR polarization is more strongly affected by scattering than would apply to the radio. It is fortuitous that the VLA observations of NGC5775 and the NIR data reported here for the T-Galaxy have about the same effective resolutions (about 10-15 independent samples along the luminous disks), though NGC5775 is at half the distance of the T-Galaxy and is twice as large, physically. NIR polarimetry of NGC5775 could help establish whether the radio X-shaped halo fields are capable of being revealed in the NIR.
The NIR better traces the cool, star-forming ISM in the T-Galaxy, revealing a coherent magnetic field with a disk-parallel orientation over extents as large as 4 kpc. In addition, there is weak indication of a rise in polarization percentage and P.A. flaring near the ends of the major axis that may hint at connections to a more vertical orientation for a halo magnetic field of the T-Galaxy or a decrease in the disk-parallel field strength. At present, there are no radio observations of the T-Galaxy which would permit direct comparison with the NIR. Based on the NIR observations, a disk-parallel orientation for the B-field is predicted for synchrotron observations of the T-Galaxy disk at short cm wavelengths.
5.3 Polarization versus Extinction
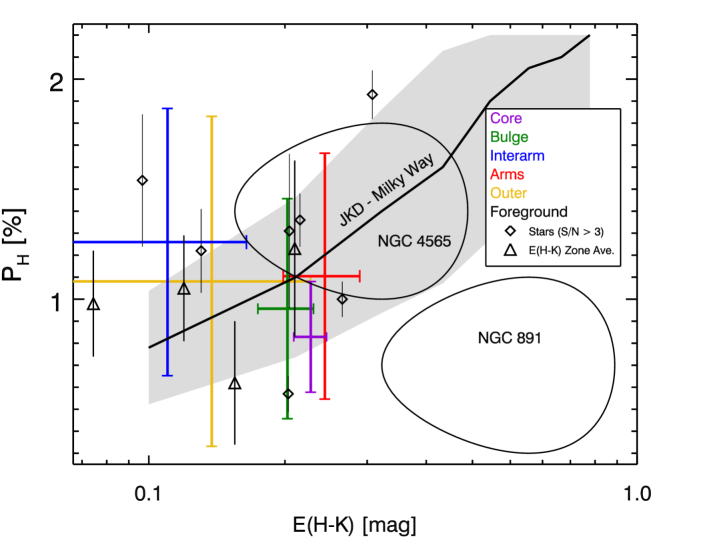
In the disk of the Milky Way, sight lines to reddened stars show infrared polarization, with the correlation between reddening and polarization well-modeled using a mixture of uniform and random magnetic field components distributed into multiple decorrelation cells (Jones et al., 1992, hereafter JKD). The polarization arises from the interaction of the magnetic field with spinning, aligned dust grains, yielding dichroic extinction of the background starlight.
In the galaxy NGC 4565, Jones (1997, in his Figure 4) found that points sampled mostly across the edge-on dust lane exhibited similar polarization and color excess behavior to the JKD model, while the similarly edge-on galaxy NGC 891 showed weaker polarizations.
The T-Galaxy is less edge-on than either NGC 4565 or NGC 891. Thus the sight lines through the T-Galaxy disk will be geometrically shorter, though they could still achieve significant optical depths. This is true even at band, because although the dust extinction per unit gas column is much less than in the optical, scattering efficiency can be more than twice as high (Wood & Jones, 1997).
The five zone classifications of Figure 5.d were applied to the T-Galaxy (foreground-corrected) images of polarization percentages and color excesses to identify pixel values in each zone. There were averaged and plotted, along with summaries abstracted from Jones (1997) for NGC 4565 and NGC 891, in Figure 6. Each of the five T-Galaxy zone characterizations are shown as colored crossed error bars representing the dispersions of pixel values of polarization percentage and color excess for each zone. These zone average values and their uncertainties are also listed in the last two columns of Table 1. An abstraction of the JKD curve, based on Jones (1997), is also shown, surrounded by a gray band depicting the approximate 1 range of stellar values seen in Figure 6 of JKD.
In addition to the T-Galaxy zone averages and dispersions, values of the polarizations and color excesses for stars appearing in the Mimir field of view are shown in Figure 6. Seven of the high signal-to-noise polarization stars are represented as black open diamonds. The remaining, low significance polarization stars were grouped into similar NICER-traced extinction bins and averaged (using Stokes and percentages, with inverse variance weighting). These are plotted as black open triangles with vertical error bars. All of the stellar values reflect the reddening and polarization induced on the distant stars by the foreground Taurus Molecular Cloud complex.
The T-Galaxy zone averages and sample extents all fall either within or very close to the region populated by NGC 4565 measurements and also mostly fall on or very near the JKD curve. This high degree of agreement of the T-Galaxy zones with the JKD model strengthens the argument for dichroic extinction and a magnetic field origin for the NIR polarizations.
The mean zone polarizations and color excesses are plotted against zone designation in Figure 7. The mean polarizations show a weak rise from the Core to the Outer zone of the T-Galaxy. The reddest regions are the Arms, Core, and Bulge. Though the color excess values could be due mostly to the zone definitions, the rise in polarization is not. A similar weak rise in polarization with distance from a bright central region was noted by Jones (1997) for the case of the nuclear region of IC 694 in Arp 299. He argued that this was a result of the change from poloidal to toroidal magnetic field dominance in the polarizing path length. Alternatively, the central region of the T-Galaxy could be suffering either depolarizing due to long pathlengths through the intervening disk or a transition from dichroism in the NE disk to single scattering in the SW portion.
5.4 Polarization Directions Within the T-Galaxy
In the modeling of Wood & Jones (1997), such ‘polarization nulls’ near, but offset from photometric centers arise from an admixture of scattering and magnetic field induced dichroic extinction producing a ‘crossed-polaroid’ effect. This is most prominent for light originating from the far side of steeply inclined galaxies. If these effects hold for the T-Galaxy, then the broken symmetry revealed in the NIR polarimetric observations may lift the degeneracy on inclination angle and identify the near and far sides of the T-Galaxy disk.
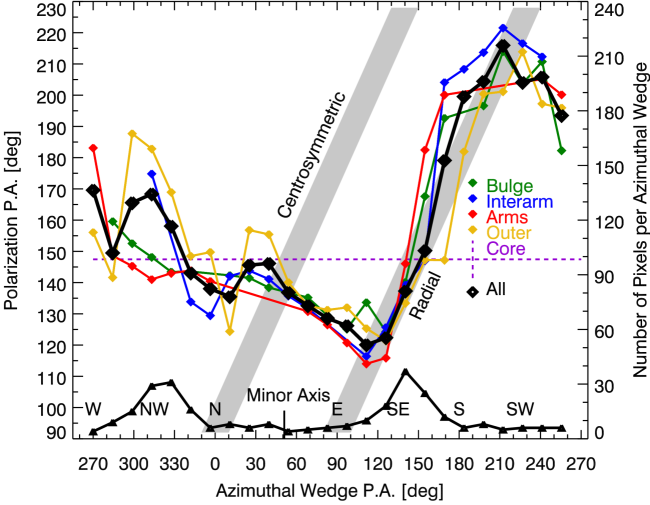
The T-Galaxy foreground-corrected polarization P.A. map of Figure 4.c was examined quantitatively to permit assessing the applicability of the Wood (1997) and Wood & Jones (1997) models. Pixels in the P.A. map were apportioned into 25 equal angle azimuthal wedges (relative to the photometric center) and were also subdivided into the five zone classifications.
Figure 8 displays how the resulting polarization P.A. and location are related in the T-Galaxy. Because the Figure 4.c map was not deprojected in this analysis, the number of pixels apportioned into each azimuthal wedge varied. This is shown in Figure 8 as the lower, solid black curve and the right hand vertical axis that together report the number of pixels included in each azimuthal wedge. The horizontal axis advances North (0°), counterclockwise from West (270°), which is equivalent to the usual ‘East from North’ meaning with a 270° horizontal axis shift. The azimuth directions to the NW (320°) and SE (140°) major axis extents of the T-Galaxy are seen as increases in the pixel numbers in those bins.
The colored points and connecting lines show the mean polarization P.A. values for each zone in each azimuth wedge, with the exception of the Core zone. The Core spans only four pixels, right at the photometric center, hence it supplies little azimuthal information. Nevertheless, the Core shows significant polarization, at an average P.A. of °, shown as the dashed violet line and error bar. Solid lines connect plotted points for the other four zones, though azimuth wedges lacking particular zonal pixels were not plotted. The large black filled diamonds connected by thick solid black lines represent the all-region average for each azimuth wedge.
There are a couple of important trends in Figure 8. For the half of the T-Galaxy located roughly North and East of the major axis, between Azimuth Wedge P.A. values of 270 and 110°, there is a mostly linear, negative slope swing in polarization P.A. from about 160 to °. A very different swing in P.A. is present in the portion of the T-Galaxy located South and West of the major axis, where the polarization P.A. values jump up to a mostly constant value near +200°.
Two gray zones in the Figure highlight the behaviors expected for a centrosymmetric (scattering) pattern and for a radial pattern, which can also arise from scattering, though not from a single central source (Wood & Jones, 1997). None of the P.A. values line up with the centrosymmetric zone, ruling out strong centrally-illuminated single scattering dominating the NIR polarization pattern for the T-Galaxy.
The SW half of the T-Galaxy shows some of the weakest polarization percentages (Figure 4.b) with a region-averaged of %, while the NE half averages %. The zone of low SW polarization and most radial polarization P.A. orientations may be evidence for the ‘crossed polaroid’ effect described in Wood & Jones (1997) for the far-side of inclined disks, though mostly affecting only a portion of the SW half. The near-side of the disk, here the NE half, better permits starlight to experience magnetic field tracing dichroic extinction, leading to the observed polarization, while the far-side (SW) suffers depolarization and/or single scattering.
There is remarkably little difference in the polarization P.A. azimuth wedge averages for the different zones in the T-Galaxy. The Outer zone may exhibit somewhat more angular scatter, but this is likely a result of the higher polarization P.A. uncertainties there. The strong agreement of the polarization P.A.s across the many zones and across almost the full extent of the T-Galaxy is strong evidence for a large-scale uniform magnetic field component.
6 Discussion
In exploiting the opportunity provided by the serendipitous NIR polarimetric observation of the T-Galaxy, as augmented by analyses of other existing stellar data, have clear understandings emerged regarding the nature of the T-Galaxy and how its properties might relate to those in the Milky Way and other normal galaxies?
First, is the T-Galaxy a Milky Way analog? Is it a disk galaxy that lacks a central AGN (so that the polarization observed is not AGN related)? The decomposition of the Stokes image into bulge and disk components argues for a significant bulge contribution to the total luminosity, but not one so high as to be AGN dominated. The B/T ratio and Petrosian concentration index are both comparable to values seen for other disk galaxies (e.g., Benson et al., 2007; Lackner & Gunn, 2012), as are the surface brightness, disk scale length, and bulge scale length (MacArthur et al., 2003; Ganda et al., 2009). Optical spectroscopy of the nucleus could test for the presence of an AGN, though Crook et al. (2007) do not comment on this. Our own HK-band spectroscopy shows a cool stellar population (thermal-like) spectrum, that is unchanged when deextincted. Further, the lack of narrow or broad emission lines in our HK spectrum argues against the presence of a strong AGN. A fairly conservative upper limit of 0.15% of the T-Galaxy luminosity for its nuclear emission lines was arrived at through combining three times the noise in the spectrum with a notional linewidth of 150 km s-1. Such a low upper limit on the spectral line power for the nucleus of the T-Galaxy rules out normal Seyferts and other AGNs.
The bulge to disk luminosity ratio is consistent with Sb-Sbc types (Graham & Worley, 2008). A bump at four arcsec radial offset in the photometric profile of the Mimir band image used in the Sérsic fits hinted at possible spiral arms. The 2MASS color excess image, after foreground reddening correction, showed evidence for symmetric red features emanating from the vicinity of the core/bulge and extending to the T-Galaxy edges. These red features are likely to be tracing the dust enhancements expected for spiral arms in the T-Galaxy and they appear at the right radial offset to match the photometric bump. The 2.3 kpc circular radius to 90% of the Petrosian flux is significantly smaller than the extent of the Milky Way disk, but other aspects indicate that the T-Galaxy is a fair, though smaller, Milky Way analog.
Second, have magnetic fields in the T-Galaxy been detected? Polarization can arise from many sources, though in the NIR, generally only scattering and dichroic extinction will dominate in normal galaxies. Modeling by Wood (1997) and Wood & Jones (1997) of NIR polarization from steeply inclined disk galaxies explored the observational effects of each of scattering and dichroic extinction alone, as well as together. When scattering dominates, Wood (1997) found that face-on galaxies show strong centrosymmetric polarization patterns and edge-on galaxies show polarizations perpendicular to the disk. Dichroic extinction tends to produce polarizations parallel to the disk, since the disk magnetic field they modeled was toroidal. The model of mixed scattering plus dichroism for an inclined galaxy, shown as Figure 3 (center) in Wood (1997), contains many of the polarization features and properties present in Figure 4.d here.
The azimuthal variation of polarization P.A.s, shown here as Figure 8, reveals both the negative-sloped swing of P.A. for the higher mean polarization (NE; near) side of the T-Galaxy disk as well as the strong positive unity-sloped P.A. swing that signifies radial (single scattering) for the lower mean polarization (SW; far) side of the disk. This azimuthal variation is also seen in the radio polarization map of NGC5775 (Soida et al., 2011). Similar quantitative characterizations in future modeling studies could help sharpen comparisons and interpretations. This would also address whether NIR and radio polarizations are both probing halo magnetic fields equally or if the NIR is affected by scattering.
The overall match of the T-Galaxy polarization percentages and color excesses with the Milky Way based JKD model and with the values seen toward the edge-on galaxy NGC 4565, shown in Figure 6, argue for a common magnetic field plus dichroic extinction origin for the polarizations and reddenings from these three galaxies.
At present, the T-Galaxy lacks resolved kinematic observations, which are needed to ascertain the rotation direction. The polarization map does reveal a broken symmetry about the major axis, which interpreted under current models was used to predict the near and far-side locations of the T-Galaxy disk. The same map also showed coherent P.A. swings. Kinematic data would be able to test these near-side/far-side predictions.
This galaxy was not targeted, but was contained in a field of deep Taurus stellar observations, and these stellar values were able to reveal and calibrate the foreground polarization properties. The stellar polarization properties show the orientation of the local Galactic magnetic field contained within the Taurus layer and could be combined with observations from Planck to improve the removal of Galactic foregrounds from CMBR observations aimed at mapping B modes (Jones, 2003).
7 Summary
Deep band linear polarization observations toward one arcmin field in Taurus serendipitously contained an inclined, 53 Mpc distant, (small) Milky Way analog galaxy. The polarization data were sensitive enough to permit measuring the intrinsic polarization generated by the combination of magnetic fields and aligned dust grains across nearly the full extent of that galaxy.
Because the galaxy was observed through the gas and dust in the Taurus Molecular Cloud complex, it was necessary to measure and remove the foreground contributions by Taurus to the distant galaxy polarization, extinction, and reddening. The foreground extinction and reddening were measured using multiple methods applied to several stellar photometric data sets. Corrected for this reddening, an color excess map of the galaxy revealed red spiral arms at locations in agreement with a photometric bump in the radial band profile.
Once foreground-corrected, the distant galaxy NIR polarizations were found to be comparable to Milky Way stellar values, indicating that they most likely are tracing the uniform component of the magnetic field in the galaxy disk. The field revealed shows remarkable similarities to the magnetic fields revealed by radio synchrotron polarimetry of edge-on disk galaxies. As NIR polarimetry for this galaxy mostly arises from dichroic extinction in the cool, star-forming interstellar medium and radio synchrotron arises in a much warmer component, the correspondence of the magnetic field patterns for the two favors a single uniform magnetic field threading both components.
A broken symmetry in the degree of polarization and its orientation direction with respect to the major axis was found, likely due to a change in the relative mix of dichroic absorption and scattering from the NE front and SW back sides of the disk of that galaxy.
The approach of using the stellar foreground polarization properties to characterize the local, Galactic magnetic field projected orientation could prove useful for constraining models aiming to correct Planck CMBR observations for Galactic contamination.
Appendix A Foreground Extinction and Color Excess Determination
The NASA/IPAC Extragalactic Database (NED) reported results from the model of Schlegel et al. (1998), based on COBE/DIRBE and IRAS/ISSA image analysis, as updated using Sloan Digital Sky Survey (SDSS) data by Schlafly & Finkbeiner (2011), for estimating foreground extinctions toward the T-Galaxy. These had an effective angular resolution of about 6 arcmin (Schlegel et al., 1998), comparable to the entire Mimir field of view. The values reported for the Schlafly & Finkbeiner (2011) update are mag and mag, the former is listed in the first row of Table 2 (the original Schlegel et al. 1998 values are listed in italics in the second row of the Table). When converted to reddening, using Indebetouw et al. (2005), the Taurus layer contribution would have been mag. The overall observed T-Galaxy color from 2MASS is 0.42 mag, as reported in NED (and was confirmed here by differential photometry in the images, tied to the colors of eleven 2MASS PSC stars located within two arcmin of the T-Galaxy). Hence, correction of the observed color by this indicated reddening would yield a galaxy color of 0.16 mag, which is significantly bluer than the colors of normal spiral galaxies (Mannucci et al., 2001). Indeed, a quick search of SDSS galaxies reveals only 3.3% show bluer colors (A. A. West, priv. comm.). This blue galaxy conclusion seemed unlikely, so several other methods and data sets were examined and the initial two rows of Table 2 were not used in the subsequent analyses.
The direction to the T-Galaxy misses the most highly extincted Taurus clouds (the direction is near and between the Eastern ends of TMC-1/HCL-2 and TMC-2/B18) showing the strongest CO emission (Goldsmith et al., 2008) in the region, and thus is expected to be a low-density, low-column ISM line of sight. The Goldsmith et al. (2008) maps suggest a total H2 column density between about cm-2 (A mag; row 3 of Table 2). This extinction range is also indicated in the NICER-based map, derived from 2MASS photometry, presented by Lombardi et al. (2010) and listed as the fourth row of Table 2.
To obtain better extinction and reddening estimates, catalog data from several surveys were mined and analyzed for a region centered on the T-Galaxy and also for a reference region located 1.9° away ([J2000] = ; [J2000] = ). The reference region was chosen, based on examination of the Goldsmith et al. (2008) and Lombardi et al. (2010) maps, as a direction relatively near on the sky to the T-Galaxy and showing no associated Taurus cloud CO emission or 2MASS extinction. Stellar photometry catalogs for both the T-Galaxy zone and the reference zone were searched out to 10 arcmin radii from those centers. The catalogs included 2MASS, UKIDSS, the Spitzer Space Telescope (Werner et al., 2004) archive, and the WISE (Wright et al., 2010) All-Sky Data Release products.
The resulting point source catalogs were position-matched and merged with the Mimir polarimetry and band photometry several ways to test the effects of inclusion of the various catalogs. For example, the Spitzer archive included deep InfraRed Array Camera (IRAC: Fazio et al., 2004) observations for a Taurus ‘Legacy-Class’ survey (Padgett et al., 2008) that overlapped the T-Galaxy field, but did not overlap the reference field. The WISE all sky survey observed both fields, but had higher uncertainties in its W2 (4.6 m) band, compared to B2 (4.5 m) for IRAC. The best photometry toward the T-Galaxy field would include the Spitzer data, but such a choice could introduce bias. The Spitzer IRAC/B2 magnitudes for stars in the T-Galaxy field were compared to the matching WISE/W2 magnitudes and found to be in excellent agreement (mean difference = mag for 374 stars), indicating that use of Spitzer for the T-Galaxy field and WISE for the reference field would not introduce meaningful bias.
Use of UKIDSS (only the band data for this region were contained in DR7) and Mimir deep photometry added fainter stars beyond the 2MASS sensitivity limits, though most of these did not have corresponding Spitzer or WISE photometry. Given the weak reddening seen for Spitzer IRAC bands (Indebetouw et al., 2005), compared to the , , and bands, all WISE/W1 (3.4 m) and Spitzer/B1 (3.6 m) magnitudes were considered to be equivalent (3.45 m) band values, and similarly the W2 and B2 magnitudes were considered to be equivalent (4.75 m) band values, despite the somewhat different bandpasses and mean wavelengths for the bands used for the two missions. The combined data sets for each region were assembled using the lowest uncertainty photometric value for each star for each band (with sufficient departure tests from this requirement to ascertain a lack of important biases).
The three main methods for obtaining extinctions and reddenings from these merged data sets used the data in different ways. The NICE method relies only on and bands, and infers extinction from the reddening in the color relative either to means for unextincted stars, or to means of stars in an unextincted reference field. Here, the 581 stars with colors in the T-Galaxy region yielded an average AV of mag. A value of mag was found for the 475 stars in the reference field. Both values were obtained when each region’s stars were compared to an average intrinsic color of 0.15 mag (Lada et al., 1994). The near zero extinction for the reference field obtained for the NICE method would appear to be confirmation of that method’s utility. Differencing the T-Galaxy and reference zone values yielded the AV listed in the fourth row of Table 2.
The NICER method333Using the C. Beaumont IDL implementation utilizes either all three 2MASS bands (, , and ), or can be extended to include any number of bands. Applying NICER/3 (, , and bands only) to the reference region returned mag, in sharp contrast to the near zero value from NICE. Including the and band magnitudes (i.e., NICER/5) increased this to mag, increasing the concern that NICE may be in error.
The RJCE method is based on colors, as the intrinsic spread of such colors for unextincted stars is exceedingly small (Majewski et al., 2011), much smaller than for the color used by NICE. Application of RJCE to the reference region yielded A mag, not far from the NICER values.
Hence, the reference region, though selected to avoid the Taurus dark and molecular clouds, and although showing no extinction under the NICE method, exhibits significant NICER and RJCE traced near-infrared color and therefore dust extinction, most probably associated with atomic or ionized hydrogen gas and not molecular gas. Examination of W3 (12 m) images revealed the presence of extended dust emission, in the form of IR cirrus, confirming the stellar color findings from NICER and RJCE.
A second reference region, previously studied by Swift & Welch (2008), was selected to serve as the zero extinction calibrator. While still within the large Taurus region, it is further on the sky from the T-Galaxy than the first reference region. This may affect comparison of the stellar types present in this second reference region and the T-Galaxy field stars. Similar to the approach already described, existing photometric databases were mined for photometry in the five NIR bands. This new region, similar to the first reference region, had data but no data. The stellar colors, uncertainties, and covariances needed to calibrate the NICER method (Lombardi & Alves, 2001) were obtained for the 261 stars located within 10 arcmin of the second reference center ([J2000] = , [J2000] = ) and having low uncertainties ( mag) for all colors. Using this second reference zone calibration, the T-Galaxy region stellar data set was analyzed using NICER/3 (i.e., ), NICER/5 (M′), and RJCE, with all results listed in the final three rows of Table 2.
Figure 9 presents an illustration of the application of the RJCE method. In the left panel, the color-color distribution of versus stellar values for the T-Galaxy field are presented and, in the right panel, the distribution of AV values derived from these data using RJCE are shown. The solid and dashed black lines in the left panel show the Bessell & Brett (1988) loci for unextincted giants and dwarfs, respectively. The near vertical run between 0.1 to 1.2 mag of highlights the narrow spread in intrinsic colors exploited by the RJCE method.
To compute the AV histogram shown in Figure 9.b, the measured photometric uncertainties were propagated to extinction uncertainties. These uncertainties were typically around 1 - 1.5 mag, much larger than the bin widths typically used when constructing AV histograms. To build this histogram, each AV value and its uncertainty were replaced with a set of several thousand, normally distributed, Monte Carlo realizations and these were placed into the corresponding histogram bins. Without this probabilistic approach, AV histograms become artificially noisy and subject to over-interpretation. The AV histogram in Figure 9.b shows that the direction to the T-Galaxy is well-represented by a single extinction and polarization layer, localized to the Taurus Molecular Cloud complex, with little to no extinction beyond Taurus to the multi-kpc distances of the Galactic stars probed.
Taking into account the several methods used for analyzing the stellar data sets, values of A mag and mag (Table 2) appear to be the best characterizations of the line of sight to the T-Galaxy. The most conservative correction might consider only the stellar difference values between the T-Galaxy region and first reference region examined, but, as described above, that reference region (and by inference most of the Taurus regions mapped in CO and using NICER) seems to exhibit an extinction nearly as large as that found for the T-Galaxy direction. This required use of the second, more angularly offset reference region of Swift & Welch (2008). The even higher extinctions found by Schlegel et al. (1998) and Schlafly & Finkbeiner (2011) through combining , , and SDSS data (first two rows of Table 2) may be traced to a strong departure of the modeled dust temperature along this direction (D. Finkbeiner, priv. comm.), justifying avoidance of their use here.
For each of the NICE, NICER, and RJCE analyses, extinction maps across the T-Galaxy region were also developed. These did not show large gradients in extinction, nor particular holes or peaks at the T-Galaxy position. The maps have higher uncertainties, however, as only a handful of stars contribute information at each map location. Given the lack of new insight offered by these maps, the region mean values listed above (and in Table 2) were adopted for all corrections.
References
- Beck (2009) Beck, R. 2009, Astrophys Space Sci, 320, 77.
- Beck et al. (1996) Beck, R., Brandenburg, A., Moss, D., Shukurov, A., & Sokoloff, D. 1996, ARA&A, 34, 155
- Benson et al. (2007) Benson, A. J., Džanovíc, D., Frenk, C. S., & Sharples, R. 2007, MNRAS, 379, 841
- Bessell & Brett (1988) Bessell, M. S., & Brett, J. M. 1988, PASP, 100, 1134
- Bingham et al. (1976) Bingham, R. G., McMullan, D., Pallister, W. S., et al. 1976, Nature, 259, 463
- Casali et al. (2007) Casali, M., Adamson, A., Alves de Oliveira, C., et al. 2007, A&A, 476, 777
- Chapman et al. (2011) Chapman, N. L., Goldsmith, P. F., Pineda, J. L., et al. 2011, ApJ, 741, 21
- Clemens et al. (2007) Clemens, D. P., Sarcia, D., Grabau, A., et al. 2007, PASP, 119, 1385
- Clemens et al. (2012c) Clemens, D. P., Pavel, M. D., & Cashman, L. R. 2012c, ApJS, 200, 21
- Clemens et al. (2012b) Clemens, D. P., Pinnick, A. P., & Pavel, M. D. 2012b, ApJS, 200, 20
- Clemens et al. (2012a) Clemens, D. P., Pinnick, A. P., Pavel, M. D., & Taylor, B. W. 2012a, ApJS, 200, 19
- Crook et al. (2007) Crook, A. C., Huchra, J, P., Martimbeau, N., et al. 2007, ApJ, 655, 790
- Cushing et al. (2004) Cushing, M. C., Vacca, W. D., & Rayner, J. T. 2004, PASP, 116, 362
- Drimmel & Spergel (2001) Drimmel, R., & Spergel, D. N. 2001, ApJ, 556, 181
- Dumke et al. (1995) Dumke, M., Krause, M., Wielebinski, R., & Klein, U. 1995, A&A, 302, 691
- Falgarone et al. (2013) Falgarone, E., et al. 2013, in prep.
- Fazio et al. (2004) Fazio, G. G., Hora, J. L. Allen, L. E., et al. 2004, ApJS, 154, 10
- Fendt et al. (1996) Fendt, C., Beck, R., Lesch, H., & Neininger, N. 1996, A&A, 308, 713
- Ganda et al. (2009) Ganda, K., Peletier, R. F., Balcells, M., & Falcón-Barroso, J. 2009, MNRAS, 395, 1669
- Goodman et al. (1992) Goodman, A. A., Jones, T. J., Lada, E. A., & Myers, P. C. 1992, ApJ, 399, 108
- Goldsmith et al. (2008) Goldsmith, P. F., Heyer, M., Narayanan, G., et al. 2008, ApJ, 680, 428
- Graham & Worley (2008) Graham, A. W., & Worley, C. C. 2008, MNRAS, 388, 1708
- Hambly et al. (2008) Hambly, N. C., Collins, R. S., Cross, N. J. G., et al. 2008, MNRAS, 384, 637
- Hewett et al. (2006) Hewett, P. C., Warren, S. J., Leggett, S. K., & Hodgkin, S. T. 2006, MNRAS, 367, 454
- Heyer et al. (1987) Heyer, M. H., Vrba, F. J., Snell, R. L., et al. 1987, ApJ, 321, 855
- Hodgkin et al. (2009) Hodgkin, S. T., Irwin, M. J., Hewett, P. C., & Warren, S. J. 2009, MNRAS, 394, 675
- Huchra et al. (2005a) Huchra, J. P., Jarrett, T., Skrutskie, M., et al. 2005a, in Nearby Large-Scale Structures and the Zone of Avoidance, ed. A. P. Fairall & P. A. Woudt (San Francisco: ASP), ASP Conf. Ser. 329, 135.
- Huchra et al. (2005b) Huchra, J. P., Martimbeau, N., Jarrett, T., et al. 2005b, in Maps of the Cosmos, ed. M. Colless, L. Staveley-Smith, & R. Stathakis (San Francisco: ASP), IAU Symp. 216, 170
- Indebetouw et al. (2005) Indebetouw, R., Mathis, J. S., Babler, B. L., et al. 2005, ApJ, 619, 931
- Jansson & Farrar (2012a) Jansson, R., & Farrar, G. R. 2012a, ApJ, 757, 14
- Jansson & Farrar (2012b) Jansson, R., & Farrar, G. R. 2012b, ApJL, 761, L11
- Jarrett et al. (2000) Jarrett, T. H., Chester, T., Cutri, R., et al. 2000, AJ, 119, 2498
- Jones (1989) Jones, T. J. 1989, ApJ, 346, 728
- Jones (1997) Jones, T. J. 1997, AJ, 114, 1393
- Jones (2000) Jones, T. J. 2000, AJ, 120, 2920
- Jones (2003) Jones, T. J. 2003, New Astro. Rev., 47, 1123
- Jones et al. (1992) Jones, T. J., Klebe, D., & Dickey, J. M. 1992, ApJ, 389, 602 (JKD)
- Krause et al. (2006) Krause, M., Wielebinski, R., & Dumke, M. 2006, A&A, 448, 133
- Lackner & Gunn (2012) Lackner, C. N., & Gunn, J. E. 2012, MNRAS, 421, 2277
- Lada et al. (1994) Lada, C. J., Lada, E. A., Clemens, D. P., & Bally, J. 1994, ApJ, 429, 694
- Lawrence et al. (2007) Lawrence, A., Warren, S. J., Almaini, O., et al. 2007, MNRAS, 379, 1599
- Lionard et al. (2007) Loinard, L., Torres, R. M., Mioduszewski, A. J., et al. 2007, ApJ, 671, 546
- Lombardi & Alves (2001) Lombardi, M., & Alves, J. 2001, A&A, 377, 1023
- Lombardi et al. (2010) Lombardi, M., Lada, C. J., & Alves, J. 2010, A&A, 512, A67
- López-Corredoira et al. (2002) López-Corredoira, M., Cabrera-Lavers, A., Garzón, F., & Hammersley, P. L. 2002, A&A, 394, 833
- MacArthur et al. (2003) MacArthur, L. A., Courteau, S., & Holtzman, J. A. 2003, ApJ, 582, 689
- Majewski et al. (2011) Majewski, S. R., Zasowski, G., & Nidever, D. L. 2011, ApJ, 739, 25
- Mannucci et al. (2001) Mannucci, F., Basile, F., Poggianti, B. M., et al. 2001, MNRAS, 326, 745
- Markwardt (2009) Markwardt, C. B. 2009, in Astronomical Data Analysis Software and Systems XVIII, ASP Conference Series, Vol. 411, ed. D. A. Bohlender, D. Durand, & P. Dowler (San Francisco: ASP), 251
- Moneti et al. (1984) Moneti, A., Pipher, J. L., Helfer, H. L., McMillan, R. S., & Perry, M. L. 1984, ApJ, 282, 508
- Nishiyama et al. (2010) Nishiyama, S., Hatano, H., Tamura, M., et al. 2010, ApJ, 722, L23
- Packham et al. (2011) Packham, C., Young, S., & Axon, D. J. 2011, in Astronomical Polarimetry 2008: Science from Small to Large Telescopes, ed. P. Bastien, N. Manset, D. Clemens, & N. St-Louis, (ASP: San Francisco), ASP Conf. Ser. 449, 405
- Padgett et al. (2008) Padgett, D. L., Rebull, L. M. , McCabe, C.-E., et al. 2008, Taurus Spitzer Legacy Project Data Release 2: Catalog and Mosaics for the Entire Survey, available from http://irsa.ipac.caltech.edu/data/SPITZER/Taurus/docs/delivery_doc2.pdf
- Pavel (2011) Pavel, M. D. 2011, ApJ, 740, 21
- Pavel & Clemens (2012) Pavel, M. D., & Clemens, D. P. 2012, ApJL,761, 28
- Petrosian (1976) Petrosian, V. 1976, ApJ, 209, L1
- Ruiz et al. (2000) Ruiz, M., Alexander, D. M., Young, S., et al. 2000, MNRAS, 316, 49
- Ruiz et al. (2003) Ruiz, M., Young, S., Packham, C., et al. 2003, MNRAS, 340, 733
- Scarrott & Draper (1996) Scarrott, S. M., & Draper, P. W. 1996, MNRAS, 278, 519
- Scarrott et al. (1987) Scarrott, S. M., Ward-Thompson, D., & Warren-Smith, R. F. 1987, MNRAS, 224, 299
- Schlegel et al. (1998) Schlegel, D. J., Finkbeiner, D. P., & Davis, M. 1998, ApJ, 500, 525
- Sérsic (1963) Sérsic, J. L. 1963, Boletin de la Asociacion Argentina de Astronomia, 6, 41
- Sérsic (1968) Sérsic, J. L. 1968, Atlas de galaxias australes (Cordoba, Argentina: Observatorio Astronomico)
- Serkowski et al. (1975) Serkowski, K., Mathewson, D.S., & Ford, V.L. 1975, ApJ, 196, 261
- Schlafly & Finkbeiner (2011) Schlafly, E. F., & Finkbeiner, D. P. 2011, ApJ, 737, 103
- Skrutskie et al. (2006) Skrutskie, M.F., Cutri, R. M., Stiening, R., et al. 2006, AJ, 131, 1163.
- Soida et al. (2011) Soida, M., Krause, M., Dettman, R.-J., & Urbanik, M. 2011, A&A, 531, A127
- Sukumar & Allen (1991) Sukumar, S., & Allen, R. J. 1991, ApJ, 382, 100
- Swift & Welch (2008) Swift, J. J., & Welch, W. J. 2008, ApJS, 174, 202
- van der Kruit (1984) van der Kruit, P. C. 1984, A&A, 140, 470
- Wardle & Kronberg (1974) Wardle, J. F. C., & Kronberg, P. P. 1974, ApJ, 194, 249
- Werner et al. (2004) Werner, M. W., Roellig, T. L., Low, F. J., et al. 2004, ApJS, 154, 1
- Wood (1997) Wood, K. 1997, ApJ, 477, L25
- Wood & Jones (1997) Wood, K., & Jones, T. J. 1997, AJ, 114, 1405
- Wright et al. (2010) Wright, E. L., Eisenhardt, P. R. M., Mainzer, A. K., et al. 2010, AJ, 140, 1868
(A color version of this figure is available in the online journal.)

(A color version of this figure is available in the online journal.)
(A color version of this figure is available in the online journal.)
(A color version of this figure is available in the online journal.)

(A color version of this figure is available in the online journal.)

| Region | N | P | ||||
|---|---|---|---|---|---|---|
| (pixels) | (%) | (mag) | (mag) | (%) | (mag) | |
| Core | 4 | 0.12 | 0.02 | … | 0.83 (0.25) | 0.215 (0.017) |
| Bulge | 26 | 0.12 - 0.2 | 0.03 | … | 0.96 (0.21) | 0.192 (0.011) |
| Interarm | 82 | 0.2 - 0.7 | 0.10 | 0.17 | 1.26 (0.14) | 0.110 (0.011) |
| Arms | 61 | ” | ” | 0.17 | 1.10 (0.15) | 0.229 (0.011) |
| Outer | 123 | 0.7 - 1.2 | 0.20 | … | 1.08 (0.14) | 0.135 (0.015) |
| Method | Quantity | Value | Equiv. AV | Ref.aaSF11: Schlafly & Finkbeiner 2011 (from NED); SFD98: Schlegel, Finkbeiner & Davis 1998 (from NED); GHN08: Goldsmith et al. (2008) - our visual interpolation; LCA10: Lombardi, Lada, & Alves - our visual interpolation | |
|---|---|---|---|---|---|
| (mag) | (Mag) | ||||
| IRAS/COBE | AH | 0.676 mag | 4.127 | 0.260 | SF11 |
| IRAS/COBE | AH | 0.867 mag | 4.989 | 0.314 | SFD98 |
| CO/13CO | N | 2 - 2.5 cm-2 | 2 - 2.5 | 0.13 - 0.16 | GHN08 |
| NICE | 1.800.17 mag | 1.80 | 0.1130.011 | ||
| NICER | AK | 0.10 - 0.15 mag | 1.8 - 2.8 | 0.11 - 0.18 | LLA10 |
| NICER/3 | AV | 2.180.08 mag | 2.18 | 0.1370.005 | |
| NICER/5 | AV | 1.970.09 mag | 1.97 | 0.1240.006 | |
| RJCE | AV | 1.960.08 mag | 1.85 | 0.1230.005 | |
| Adopted | 2.000.10 | 0.1250.009 |