Present address: ]Nuclear Physics Division, Bhabha Atomic Research Centre (BARC), Mumbai 400085, India
Tidal Waves in 102Pd: A Rotating Condensate of Multiple bosons
Abstract
Low-lying collective excitations in even-even vibrational and transitional nuclei may be described semi-classically as quadrupole running waves on the surface of the nucleus (“tidal waves”), and the observed vibrational-rotational behavior can be thought of as resulting from a rotating condensate of interacting bosons. These concepts have been investigated by measuring lifetimes of the levels in the yrast band of the 102Pd nucleus with the Doppler Shift Attenuation Method. The extracted reduced transition probabilities for the yrast band display a monotonic increase with spin, in agreement with the interpretation based on rotation-induced condensation of aligned bosons.
pacs:
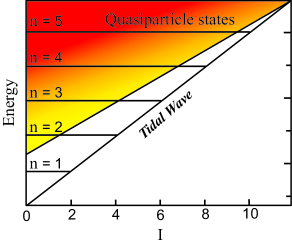
21.10.Tg, 27.60.+j, 21.10.Ky, 21.60.EvCollective quadrupole excitations of nuclei are classified as “rotational” and “vibrational” with the rigid rotor and the harmonic vibrator being the limiting ideal cases. The harmonic vibrations ( bosons) are five-fold degenerate with respect to the angular momentum projection; they couple to multiplets of different angular momentum. Rotational bands that extend over ten or more states are ubiquitous. Vibrational excitations of spherical nuclei, on the other hand, are much less distinct since the time scale of collective vibrations is not much larger than that of intrinsic quasiparticle excitations. The adiabatic separation of the time scales, which is a prerequisite for the appearance of collective quantum states, rapidly deteriorates with the number of excited quanta (phonons). While evidence for the two-phonon triplet is often observed, identification of all members of the three-phonon multiplet is already problematic (see, for example, Ref. Aprahamian et al. (1987)). Fig. 1 schematically shows the location of the vibrational states and of the quasiparticle excitations for a spherical nucleus. With increasing phonon number , the collective states are embedded into a progressively dense background of quasiparticle excitations. The coupling to this quasiparticle background fragments the collective levels and they cease to exist as individual quantum states. The density of quasiparticle excitations is lowest near the yrast line, which is the sequence of states with the lowest excitation energy for a given angular momentum . With increasing phonon number , the yrast members of the vibrational multiplets are expected to keep their identity as collective quantum states the longest.
In this Letter, we report on the first identification of a seven-phonon yrast state, which can be interpreted as a rotating condensate of seven bosons that align their spins. The yrast states of 102Pd are nearly equidistant in energy up to spin , which is characteristic of a vibrational sequence. Indeed, the existence of an exceptionally long vibrational band in 102Pd was already noted by Regan et al. Regan et al. (2003), making this nucleus an attractive case for this investigation. However, in order for these states to represent a sequence of stacked bosons, the reduced transition probabilities between adjacent states, , must increase linearly with the number of bosons. In this work, lifetime measurements are presented that confirm this expectation. The measurements are complemented by theory, which provides a connection with the underlying microscopic structure that has remained a challenge in the case of multi-phonon excitations.
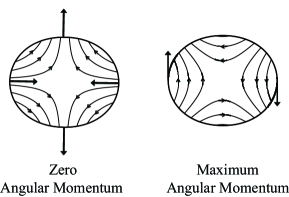
Fig. 2 illustrates the vibrational modes of minimal and maximal angular momentum of a classical ideal liquid. The oscillating standing wave on the left-hand side represents the zero-angular momentum members of the vibrational multiplets, which are most rapidly drowned in the sea of quasiparticle excitations. The vibrational yrast states correspond to a wave traveling over the nuclear surface, as illustrated on the right hand side. The surface rotates with the constant angular velocity as is the case for the rotation of a rigid body. However, the flow pattern is irrotational. As is characteristic of a surface wave, liquid moves from the wavefront under the crest to the back side. The energy and the angular momentum increase with the amplitude of the wave, but the frequency remains constant. In the case of rigid rotation, the energy and the angular momentum increase with the angular frequency while the shape remains unchanged. The name “tidal wave” has been suggested for the yrast mode Frauendorf et al. (2011) in analogy to the propagation of ocean tidal waves. The tidal wave then corresponds to a wave packet of aligned bosons, which rotates with constant angular velocity. The tidal wave concept has been applied previously to near-equidistant band structures of different spin-parity sequences. Specifically, Refs. Pattison et al. (2003); Cullen et al. (2005) interpreted the sequences of fixed parity in 182Os as a tidal wave running over a triaxial surface, and Ref. Reviol et al. (2006) interpreted the alternating-parity sequences in 220Th as a reflection-asymmetric tidal wave traveling over a spherical core.
In terms of a rotational interpretation, the difference between a rotor and a tidal wave lies in the way in which angular momentum is generated. A rotor generates angular momentum by increasing the angular frequency at nearly constant deformation (and, hence, constant moment of inertia). A tidal wave nucleus, on the other hand, generates angular momentum by increasing deformation (i.e., changing ) at nearly constant angular frequency . For most transitional nuclei, the situation is intermediate: Both mechanisms of generating angular momentum are present, one favored over the other as the angular momentum increases. The rotor-like scenario has been well studied, with the measured reduced transition probabilities, i.e., values, confirming that the deformation remains rather constant Kotliński et al. (1990). However, the strong increase of deformation with angular momentum, which characterizes a tidal wave, is demonstrated for the first time in the work reported here.
The mean lifetimes of yrast states in 102Pd were measured using the Doppler Shift Attenuation Method (DSAM). The experiment was performed at the Argonne Tandem Linear Accelerator System (ATLAS) facility using the 76Ge(30Si, 4n) reaction, at a beam energy of 110 MeV. The target consisted of 500 isotopically enriched 76Ge backed by a 26 mg/cm2-thick layer of Au; the backing thickness was sufficient to stop the recoiling nuclei. A thin layer of 11 Al was sandwiched between the target and backing to prevent the migration of Ge into Au. The emitted rays were detected with the Gammasphere array Lee (1990) which, at the time of the experiment, comprised ninety eight Compton-suppressed high-purity Ge detectors, arranged in 16 rings of constant angles relative to the beam direction; a total of 3.1109 three- and higher-fold coincidence events were accumulated. The low-spin structure of 102Pd is already well established Jerrestam et al. (1996); Gizon et al. (1997); Zamfir et al. (2002). The present investigation has focused primarily on the measurement of the lifetimes of members of the yrast band.
The accumulated data were sorted angle-by-angle into several unique-fold event databases, using the BLUE program (Cromaz et al., 2001). For each database, an angle-dependent background subtraction algorithm (Starosta et al., 2003) was applied, and the resulting, background-subtracted, databases were double gated in order to extract coincidence and error spectra for each ring of Gammasphere for further analysis.
Doppler-shifted and broadened lineshapes were observed for transitions in the yrast band up the , 7244-keV level and lifetime analyses were performed using a modified version of the LINESHAPE analysis package Wells and Johnson (1991). A total of 50000 Monte Carlo simulations of the velocity histories of the recoiling nuclei traversing the target and backing materials were generated in time steps of 0.0089 ps and were subsequently converted into time-dependent velocity profiles. The total number of time steps was set to 198 and the time step value was determined in accordance with the discussion in Ref. Wells and Johnson (1991). Electronic stopping powers were taken from Ziegler’s tabulation Ziegler (1980), with low-energy modifications. Energies of in-band transitions were determined from fits to the experimental data and the side-feeding intensities obtained directly from the measured -ray intensities within the yrast band. The side feeding into each level and to the top of the yrast band was modeled by a five-state rotational cascade with independently variable lifetimes. A minimization for the observed Doppler shifted lineshapes was then performed using the in-band and side-feeding lifetimes, background, and contaminant peak(s) as input parameters. Experimental uncertainties in the extracted lifetimes were determined based on the behavior of the fit in the vicinity of the minimum Chiara et al. (2000); Garg et al. (1986) by a statistical method using the MINOS James and Roos (1975) program. Although side-feeding effects were initially included in the analysis, the extracted lifetimes were found to be insensitive to changes in the side-feeding intensities. More details on the fitting procedure can be found in Refs. Chiara et al. (2000, 2001).
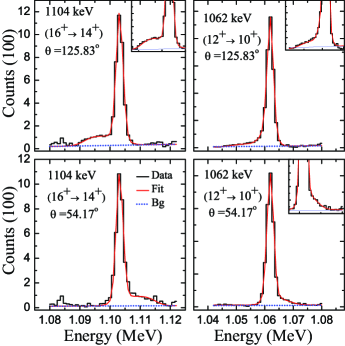
Experimental data and lineshape fits at both forward and backward angles for two representative transitions (1104 and 1062 keV) in the yrast band are displayed in Fig. 3. The inserts are expanded views of the corresponding lineshapes. The extracted lifetimes of states in the yrast band, the corresponding reduced transition probabilities, and the associated transition quadrupole moments are summarized in Table 1. The reduced transition probabilities were obtained from the measured lifetimes using the expression:
| (1) |
with the -ray energies, , in MeV, and the partial lifetimes of the transitions, , in ps.
| Eγ(MeV) | I I | (ps) | (e2b2) | (eb) |
|---|---|---|---|---|
| 0.836 | 6+ 4+ | 1.149(32) | 0.174(22) | 2.36(15) |
| 0.902 | 8+ 6+ | 0.720(42) | 0.190(11) | 2.41(07) |
| 0.980 | 10+ 8+ | 0.409(28) | 0.221(15) | 2.56(09) |
| 1.062 | 12+ 10+ | 0.252(18) | 0.240(14) | 2.65(08) |
| 1.083 | 14+ 12+ | 0.201(11) | 0.272(15) | 2.80(08) |
| 1.104 | 16+ 14+ | 0.180(21)111The lifetime of the 16+ level could not be separated from the side-feeding lifetime. The value given is, therefore, the lower limit. | 0.277(14) | 2.81(07) |
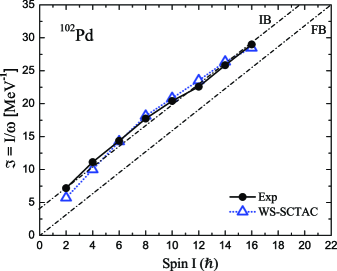
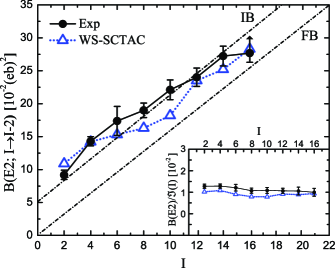
Fig. 4 provides the experimental moments of inertia as a function of spin . The harmonic limit for the free bosons is displayed by the dashed line marked FB and corresponds to a constant equal to one half of the vibrational frequency . The experimental moment is a nearly linear function of as indicated by the dashed line marked IB (for interacting bosons). It deviates from FB by the small offset at , which is a measure of the anharmonicity. The angular momentum increases due to the increase of while remains nearly constant.
The measured values (Fig. 5) increase linearly with , such that the ratio is constant within the experimental uncertainties (see the insert). This demonstrates that the angular momentum gain originates from the increase of the wave amplitude (deformation) while the rotational frequency does not increase significantly. This is in stark contrast to a typical rotor where the transition probabilities remain relatively constant over a given spin range, while the increase of the rotational frequency translates into a gain of angular momentum. This provides the first evidence that the yrast line of 102Pd corresponds to a slightly anharmonic tidal wave and the measurements reported here establish the characteristic increase of the tidal wave amplitude up to .
It is remarkable that the anharmonicity shows up in a simple way as a constant upshift of the functions and . This may be interpreted as follows: The yrast line of 102Pd is characterized by an anharmonic wave that starts out with a small deformation (i.e., non-aligned bosons are present with a small probability) and increases in amplitude along the sequence of states by adding aligned bosons.
The transition quadrupole moment measures the amplitude of the tidal wave. For Pd56, it is eb at , to be compared with eb for the state in the nucleus Pd64, which is located in the middle of the neutron shell Gürdal and Kondev (2012). In the case of 110Cd, the experimental amplitude of the tidal wave reaches eb for Gürdal and Kondev (2012). [All quoted values have been obtained from the lifetime information provided in the cited references.] In this case, the configuration with the rotational aligned pair of quasineutrons becomes yrast for Regan et al. (2003). Its nearly constant smaller deformation ( eb) thereafter signals the transition to the rotational regime (c.f. Frauendorf et al. (2011)). In the case of 102Pd, the rotational aligned configuration does not become yrast until after =16, which, as mentioned previously, is one reason why this nucleus was deemed very attractive from the point of view of studying the boson condensate. Unfortunately, it was not possible to determine the lifetimes of these “rotational” states from the present data.
The tidal wave concept allows for a semiclassical calculation of the energies and values of the yrast states in vibrational and transitional nuclei. The tidal wave has a static deformed shape in the co-rotating frame of reference. This has led to the microscopic description suggested in Ref. Frauendorf et al. (2011), which is based on the cranking model without resorting to the small amplitude approximation. Ref. Frauendorf et al. (2011) applies the shell-correction tilted-axis cranking (SCTAC) version Frauendorf (2000) of the cranking model to even-even nuclides with and . In this approach, the energy surface is calculated by the micro-macro method, subject to the constraint that the expectation value of the angular momentum operator equals . The energy is minimized with respect to the deformation parameters and . Deformed solutions are found in Ref. Frauendorf et al. (2011) for , even when the solution was spherical for . These calculations reproduce the collective yrast states rather well. They also describe the intrusion of the aligned two-quasineutron states into the yrast line, which causes the backbending phenomenon seen in most of the nuclei studied. The details of the present calculations are the same as those of Ref. Frauendorf et al. (2011), with the exception that the modified oscillator potential is replaced by a deformed Woods-Saxon potential with the so-called “universal” parameters Cwiok et al. (1987). The results are labeled by SCTAC in Figs. 4 and 5 (“TAC” refers only to the code; the self-consistent solution actually rotates about the intermediate principal axis of the slightly triaxial shape). It should be noted that there are no parameters adjusted to the experiment.
As seen in Fig. 4, the observed behavior of as a function of spin is reproduced well by these calculations. The calculated moment remains close to the IB line because the ground state configuration has been employed throughout. The calculated values (Fig. 5) also follow the experimental data overall, albeit with somewhat larger fluctuations than those exhibited by the experimental values. The reason for this apparent discrepancy lies in the fact that the deformation parameters are those associated with the minimum of the energy calculated by the micro-macro method. This method neglects zero point fluctuations of the shape which, when properly accounted for, are expected to result in washing out of these fluctuations. Thus, the semiclassical cranking+micro-macro calculations describe the yrast states of 102Pd up to the seven boson state rather well, once the anharmonicities are correctly accounted for.
In summary, by measuring the lifetimes of the yrast states in 102Pd up to a spin of , the first clear evidence has been provided for rotational-induced condensation of aligned bosons. The linear increase of the reduced transition probability with the boson number , which is expected for condensation, was observed up to =7. The mutual interaction of bosons causes anharmonicities which appear as a constant upshift of the reduced transition probability and the moment of inertia as function of spin . This upshift may be interpreted as caused by a small fraction of non-aligned bosons to which the aligned bosons are added. Semiclassically, the condensate represents a tidal wave traveling over the nuclear surface with constant angular velocity (equal to one half of the vibrational frequency), where the angular momentum gain arises from the increase of the wave amplitude. Since the wave motion is not quite harmonic, a slight increase of the rotational frequency with spin is seen. The tidal wave is described in the framework of the cranking model based on the micro-macro method, which describes the data well any adjustment of the model parameters.
We thank R.V. Ribas for providing the DSAM analysis code and C.J. Chiara for helpful discussions about the DSAM analysis procedures. This work has been supported in part by the National Science Foundation (Grant Nos. PHY07-58100 and PHY-1068192), and by the Department of Energy, Office of Nuclear Physics, under Grant Nos. DE-FG02-95ER40934 (UND) and DE-FG02-95ER40939 (MSU), and Contract No. DE-AC02-06CH11357 (ANL).
References
- Aprahamian et al. (1987) A. Aprahamian, D. S. Brenner, R. F. Casten, R. L. Gill, and A. Piotrowski, Phys. Rev. Lett. 59, 535 (1987), URL http://link.aps.org/doi/10.1103/PhysRevLett.59.535.
- Regan et al. (2003) P. H. Regan, C. W. Beausang, N. V. Zamfir, R. F. Casten, J. Zhang, A. D. Yamamoto, M. A. Caprio, G. Gürdal, A. A. Hecht, C. Hutter, et al., Phys. Rev. Lett. 90, 152502 (2003), URL http://link.aps.org/doi/10.1103/PhysRevLett.90.152502.
- Frauendorf et al. (2011) S. Frauendorf, Y. Gu, and J. Sun, Int. J. Mod. Phys E 20, 465 (2011), eprint Online arXiv: 1109.1842.
- Pattison et al. (2003) L. K. Pattison, D. M. Cullen, J. F. Smith, A. M. Fletcher, P. M. Walker, H. M. El-Masri, Z. Podolyák, R. J. Wood, C. Scholey, C. Wheldon, et al., Phys. Rev. Lett. 91, 182501 (2003), URL http://link.aps.org/doi/10.1103/PhysRevLett.91.182501.
- Cullen et al. (2005) D. M. Cullen, R. Glover, L. K. Pattison, P. M. Walker, S. Frauendorf, and D. Almehed, J. Phys. G: Nucl. Part. Phys. 31, S1709 (2005), URL http://stacks.iop.org/0954-3899/31/i=10/a=059.
- Reviol et al. (2006) W. Reviol, C. J. Chiara, M. Montero, D. G. Sarantites, O. L. Pechenaya, M. P. Carpenter, R. V. F. Janssens, T. L. Khoo, T. Lauritsen, C. J. Lister, et al., Phys. Rev. C 74, 044305 (2006), URL http://link.aps.org/doi/10.1103/PhysRevC.74.044305.
- Kotliński et al. (1990) B. Kotliński, D. Cline, A. Bäcklin, K. Helmer, A. Kavka, W. Kernan, E. Vogt, C. Wu, R. Diamond, A. Macchiavelli, et al., Nucl. Phys. A 517, 365 (1990), ISSN 0375-9474, URL http://www.sciencedirect.com/science/article/pii/037594749090040S.
- Lee (1990) I.-Y. Lee, Nucl. Phys. A 520, 641 (1990), ISSN 0375-9474, URL http://www.sciencedirect.com/science/article/pii/037594749091181P.
- Jerrestam et al. (1996) D. Jerrestam, W. Klamra, B. Fogelberg, R. Bark, A. Gizon, J. Gizon, E. Ideguchi, S. Mitarai, M. Piiparinen, and G. Sletten, Nucl. Phys. A 603, 203 (1996), ISSN 0375-9474, URL http://www.sciencedirect.com/science/article/pii/0375947496001200.
- Gizon et al. (1997) J. Gizon, B. Nyakó, J. Timár, A. Gizon, L. Zolnai, A. Boston, G. Csata-Danil, J. Genevey, D. Joss, N. O’Brien, et al., Phys. Lett. B 410, 95 (1997), ISSN 0370-2693, URL http://www.sciencedirect.com/science/article/pii/S037026939700957X.
- Zamfir et al. (2002) N. V. Zamfir, M. A. Caprio, R. F. Casten, C. J. Barton, C. W. Beausang, Z. Berant, D. S. Brenner, W. T. Chou, J. R. Cooper, A. A. Hecht, et al., Phys. Rev. C 65, 044325 (2002), URL http://link.aps.org/doi/10.1103/PhysRevC.65.044325.
- Cromaz et al. (2001) M. Cromaz, T. Symons, G. Lane, I. Lee, and R. MacLeod, Nucl. Instrum. Meth. Phys. Res. A 462, 519 (2001), URL http://www.sciencedirect.com/science/article/pii/S0168900200011268.
- Starosta et al. (2003) K. Starosta, D. Fossan, T. Koike, C. Vaman, D. Radford, and C. Chiara, Nucl. Instrum. Meth. Phys. Res. A 515, 771 (2003), URL http://www.sciencedirect.com/science/article/pii/S0168900203023131.
- Wells and Johnson (1991) J. C. Wells and N. Johnson, Oak Ridge National Laboratory Report No. ORNL-6689 p. 44 (1991).
- Ziegler (1980) J. Ziegler, Stopping and Ranges of Ions in Matter, Vols. 3 and 5 (Pergamon Press, 1980).
- Chiara et al. (2000) C. J. Chiara, S. J. Asztalos, B. Busse, R. M. Clark, M. Cromaz, M. A. Deleplanque, R. M. Diamond, P. Fallon, D. B. Fossan, D. G. Jenkins, et al., Phys. Rev. C 61, 034318 (2000), URL http://link.aps.org/doi/10.1103/PhysRevC.61.034318.
- Garg et al. (1986) U. Garg, A. Chaudhury, M. W. Drigert, E. G. Funk, J. W. Mihelich, D. Radford, H. Helppi, R. Holtzmann, R. V. F. Janssens, T. L. Khoo, et al., Phys. Lett. B 180, 319 (1986), URL http://www.sciencedirect.com/science/article/pii/0370269386911950.
- James and Roos (1975) F. James and M. Roos, Comput. Phys. Commun. 10, 343 (1975).
- Chiara et al. (2001) C. J. Chiara, D. B. Fossan, V. P. Janzen, T. Koike, D. R. LaFosse, G. J. Lane, S. M. Mullins, E. S. Paul, D. C. Radford, H. Schnare, et al., Phys. Rev. C 64, 054314 (2001), URL http://link.aps.org/doi/10.1103/PhysRevC.64.054314.
- Frenne (2009) D. D. Frenne, Nuclear Data Sheets 110, 1745 (2009), ISSN 0090-3752, URL http://www.sciencedirect.com/science/article/pii/S0090375209000581.
- Gürdal and Kondev (2012) G. Gürdal and F. G. Kondev, Nucl. Data Sheets 113, 1315 (2012), ISSN 0090-3752, URL http://www.sciencedirect.com/science/article/pii/S0090375212000415.
- Frauendorf (2000) S. Frauendorf, Nucl. Phys. A 677, 115 (2000), ISSN 0375-9474, URL http://www.sciencedirect.com/science/article/pii/S0375947400003080.
- Cwiok et al. (1987) S. Cwiok, J. Dudek, W. Nazarewicz, J. Skalski, and T. Werner, Comput. Phys. Commun. 46, 379 (1987), ISSN 0010-4655, URL http://www.sciencedirect.com/science/article/pii/0010465587900932.