A bright thermonuclear X-ray burst
simultaneously observed
with Chandra and RXTE
The prototypical accretion-powered millisecond pulsar SAX J1808.43658 was observed simultaneously with Chandra-LETGS and RXTE-PCA near the peak of a transient outburst in November 2011. A single thermonuclear (type-I) burst was detected, the brightest yet observed by Chandra from any source, and the second-brightest observed by RXTE. We found no evidence for discrete spectral features during the burst; absorption edges have been predicted to be present in such bursts, but may require a greater degree of photospheric expansion than the rather moderate expansion seen in this event (a factor of a few). These observations provide a unique data set to study an X-ray burst over a broad bandpass and at high spectral resolution (–400). We find a significant excess of photons at high and low energies compared to the standard black body spectrum. This excess is well described by a 20-fold increase of the persistent flux during the burst. We speculate that this results from burst photons being scattered in the accretion disk corona. These and other recent observations of X-ray bursts point out the need for detailed theoretical modeling of the radiative and hydrodynamical interaction between thermonuclear X-ray bursts and accretion disks.
Key Words.:
Accretion, accretion disks – X-rays: binaries – X-rays: bursts – stars: neutron – X-rays: individual (SAX J1808.43658)1 Introduction
The vast majority of thermonuclear X-ray bursts from neutron stars (the so-called type I X-ray bursts, see e.g. Lewin et al. 1993; Strohmayer & Bildsten 2006) have been measured with instruments that are sensitive at photon energies above 2 keV. The temperature of type-I X-ray bursts is, however, 2.5 keV or lower so that usually a substantial part of the spectrum is missed. Therefore, interesting physics may be missed, particularly during the cooler parts of X-ray bursts in the tail and during phases of photospheric expansion. Not only that: many of the discrete atomic spectral features from abundant elements in the cosmos (oxygen, neon and iron) occur below 2 keV. Sub-2 keV measurements of X-ray bursts at high spectral resolution and with photospheric expansion are, therefore, interesting to pursue.
Since the launch of Chandra and XMM-Newton in 1999 and Swift in 2004, sub 2 keV coverage is readily available. However, these are narrow field instruments where measurements are usually made through a dedicated program, in contrast to the wide-field instruments on board SAS-B, BeppoSAX, INTEGRAL, Swift and Fermi that lack sub 2 keV coverage. We estimate that about 250 X-ray bursts have been detected below 2 keV with these three missions, compared to about 104 with the wide field instruments (e.g., Cottam et al. 2002; Jonker et al. 2003; Thompson et al. 2005; Boirin et al. 2007; Kong et al. 2007; Paizis et al. 2012). Hardly any X-ray bursts with photospheric expansion and low were detected with sub 2 keV coverage so far, perhaps 6 with low flux (Galloway et al. 2010).
In this paper we report an observation of a bright thermonuclear burst with photospheric expansion from the low-mass X-ray binary (LMXB) SAX J1808.43658, with the AXAF CCD Imaging Spectrometer (ACIS) in combination with the Low-Energy Transmission Grating Spectrometer (LETGS) on board Chandra. The event was detected simultaneously with the RXTE Proportional Counter Array (PCA). Combined this presents a unique data set with, as far as we know, the largest number of photons ever detected from a single X-ray burst in the 0.5–2 keV band or with a grating spectrometer.
SAX J1808.43658 is the first discovered accretion-powered millisecond X-ray pulsar in a LMXB (in ’t Zand et al. 1998; Wijnands & van der Klis 1998; in ’t Zand et al. 2001; Chakrabarty et al. 2003), of 14 cases known thus far (e.g., Patruno & Watts 2012). It is also a relatively nearby representative, at kpc (Galloway & Cumming 2006), and with a relatively low column density of interstellar material ( cm-2; e.g. Wang et al. 2001; Papitto et al. 2009; Cackett et al. 2009). Almost all its X-ray bursts exhibit photospheric expansion (Galloway et al. 2008) and the bursts appear to be the result of a flash of a pure helium layer that is produced by stable hydrogen burning. These circumstances make SAX J1808.43658 a particularly suitable source to study X-ray bursts in great detail and in a large bandpass. Therefore, we observed SAX J1808.43658 with Chandra and RXTE during its November 2011 outburst.

The main goal of our measurement was to search for absorption edges. We were motivated by a prediction of Weinberg et al. (2006) that the radiative wind of radius expansion bursts eject ashes of nuclear burning whose spectral signature may be detectable with current high-resolution X-ray telescopes. This may be the best path to finding discrete spectral features from neutron star (NS) surfaces, whose detection could constrain thermonuclear reactions in the NS ocean and the NS compactness through general relativistic gravitational redshift determinations. Near-Eddington X-ray bursts reveal themselves as having black body like spectra with phases of expanded emission areas. There are two kinds: those with moderate expansion (factor increase in emission area), encompassing % of all bursts, and those with superexpansion (factor ), encompassing perhaps % of all bursts (e.g. van Paradijs et al. 1990; Galloway et al. 2008; in ’t Zand & Weinberg 2010). The difference in expansion is likely determined by whether an optically thick shell is being expelled which on its turn is determined by how much the radiative flux from the nuclear burning goes over the Eddington limit in the flash layer. Also, the larger this super-Eddington factor is, the larger the upward extent of the convection and the probability for absorption edges will be. The burst we discuss here is a bright burst from a relatively nearby NS and, ergo, of good statistical quality. However, it has only a moderate photospheric expansion.
We introduce the observations in Sect. 2, including monitoring observations with the Monitoring All-sky X-ray Imager (MAXI) on board the International Space Station (ISS) and the Burst Alert Telescope (BAT) on board Swift, and provide the details of the data reduction in Sect. 3. Sect. 4 discusses the spectral analysis and Sect. 5 briefly the timing behavior of the detected burst. Finally, in Sect. 6, we place the results in the context of the theory of burst spectra.
2 Observations

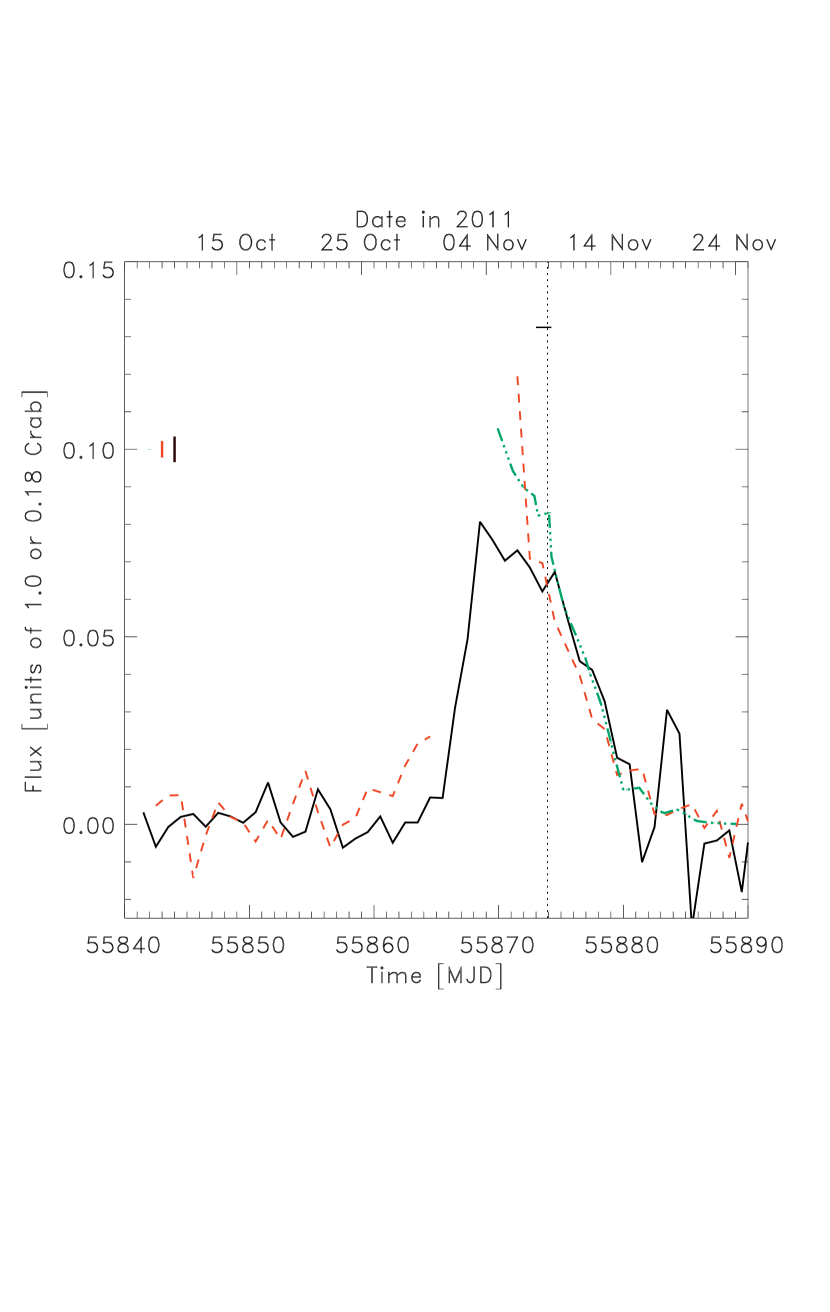
On November 4, 2011, a new outburst of SAX J1808.43658 was reported from Swift-BAT observations beginning October 31 (Markwardt et al. 2011). Fig. 1 shows the outburst light curves from MAXI, RXTE-PCA and Swift-BAT data. MAXI (Matsuoka et al. 2009) is deployed on the International Space Station (ISS) and, in combination with the Gas Scintillator Counter (GSC), is active between 2 and 30 keV. The measurements consist of 1 min exposures every 100-min ISS orbit and are made public within a few hours of being taken111http://maxi.riken.jp/top. BAT (Barthelmy et al. 2005) is a gamma-ray burst monitor camera active on Swift between 15 and 100 keV. The 15-50 keV flux of some 500 X-ray sources are monitored several times per day and made available publicly in near real time222http://swift.gsfc.nasa.gov/docs/swift/results/transients. The PCA data (see below) were obtained under ObsID 96027-01 for a total exposure time of 143.6 ks (see also Patruno et al. 2012, and below).
Following the alert, we requested and were granted a Chandra Target of Opportunity Observation (ObsID 13718). The exposure time is 100.13 ks between Nov. 8 00:46 UT and Nov. 9 04:35 UT (see Fig. 2) which is 8 days after the presumed outburst onset. The observatory was operated using the Low-Energy Transmission Grating Spectrometer (LETGS; Brinkman et al. 2000), with ACIS-S (Garmire et al. 2003) at the focal plane and the Low-Energy Transmission Grating in the beam. This combination provides a marginally higher effective area than the HETGS (see e.g. Proposers’ Observatory Guide Fig. 1.4) in most of the interesting bandpass of 0.5-6 keV at the expense of some spectral resolution. The resolution is, however, sufficient to search for absorption edges (–400). A disadvantage of using ACIS instead of HRC is the loss of effective area between 0.08 and 0.5 keV, but this bandpass is of no interest to this observation because the source is significantly absorbed there. To avoid pile up, ACIS was operated in the continuous clocking (CC) mode. In this mode, position information is lost in the cross dispersion direction while the time resolution is improved from 3.2 s to 2.85 ms. The disadvantage is that the background cannot accurately be measured independently (it is possible to discriminate with some sensitivity the background from source in pulse height versus dispersion space), but this is not detrimental because we are primarily interested in X-ray bursts which can easily be separated in the time domain, without the need for the spatial resolution. Four ACIS CCDs were employed: S1 through S4. The offset of the Science Instrument Module (the so called ’SIM offset’) was -8 mm to position the dispersed spectrum as close as possible to the CCD edges to optimize the CCD spectral resolution. The Y offset was +1.6 arcmin so that the zeroth order would be detected by S2.
Simultaneous measurements were requested and granted with RXTE under Proposal Number 96027. Twenty-four ks of simultaneous coverage was obtained (see Fig. 2). The Proportional Counter Array (PCA; Jahoda et al. 2006) comprises 5 non-imaging proportional counter units (PCUs) active between 2 and 60 keV with a combined effective area of 6000 cm2 at 6 keV. The spectral resolution is 18% full width at half maximum at 6 keV and the time resolution of the data products for SAX J1808.43658 is typically 125 s. It is seldom that all PCUs are active at the same time, particularly at late times in the mission. During our observations, PCA operated with 2 active proportional counter units (PCUs 1 and 2, counted from 0). All PCUs have collimators delimiting the field of view to 2°2° (full width to zero response). For our analysis, we used standard-1 and 2 data (time resolution 0.125 and 16 s, energy resolution 1 and 128 channels, respectively) and event mode data E_125us_64M_0_1s with 125 s time resolution and 64 energy channels between 2 and 60 keV. All data allow selection of PCUs.
Fig. 2 shows the Chandra and PCA-measured (only PCU2) light curves during the time of the Chandra observation. These curves show the detection of one burst in both instruments. This is the only X-ray burst detected from SAX J1808.43658 in the whole outburst (c.f., Patruno et al. 2012). RXTE and Chandra times were synchronized by matching the burst onset as seen in the overlapping bandpass 3-8 keV. We find that the burst starts at MJD 55873.91320 (barycentered), or at RXTE time333Mission Elapsed Time, defined as seconds since 1994.0 UTC 563407175.90 s and Chandra time444 Mission Elapsed Time, defined as seconds since 1998.0 TT 437176836.46 s (not barycentered). There is simultaneous Chandra/RXTE coverage between -2560 and +812 s with respect to the burst onset time (see Fig. 3). The total number of burst photons detected is 38,800180 with Chandra (measured over the complete ACIS-S detector and after subtraction of a pre-burst level) and 562,800400 with RXTE. The peak intensities, measured at 0.125 s time resolution, are 2,538 c s-1 for Chandra (all ACIS events, not corrected for non-burst events) and 33,669 c s-1 for RXTE. The Chandra net peak rate for orders -1/+1 is 1,930 c s-1. The Chandra event data buffer of 128,000 events (in the graded telemetry mode) was not overfilled. The RXTE data buffer was overfilled. Starting at 1.15 s after burst onset, 0.45 s chunks of data are missing in the event-mode data every 1.0 s until 10.6 s. After that 3 smaller chunks of 0.45 s are missing every 1.0 s until 13.6 s after which the data are completely recovered. The standard-1 and 2 data do not have gaps.
The non-burst emission varied significantly during the 100 ks of the Chandra observation. The intensity decreased from 128 to 110 c s-1, or 14% although this is not corrected for the background (which is expected to be a few c s-1). The decrease is not smooth. The Chandra color history, the color being defined as the intensity of all ACIS events above 1 keV divided by that below, also shows a gradual decrease by 5%.
3 Data reduction
There are 11.79 million events in the Chandra event file, equivalent to an average count rate of 117 c s-1, in 4 ACIS-S detectors. The 0th order contains 3.56 million events (30%), -1/+1 orders contain 2.43/3.29 million events, orders -2/+2 0.12/0.14 million events, orders -3/+3 0.27/0.28 million events. We investigated only orders -1 and +1 since these encompassed 7.1 times more photons than orders -2/+2 and -3/+3 combined.
We reduced the Chandra data with ciao version 4.4, ftools version 6.12 and CALDB version 4.5.0. tgextract was used to extract the grating order data from the event-2 file, after the eventfile was filtered for a particular time interval with dmcopy, including a workaround555http://cxc.harvard.edu for a bug in ciao versions 4.3 and 4.4 concerning incorrect GTIs when time-filtering grating data with dmcopy. The resulting pha2 file was divided into separate orders with dmtype2split. fullgarf was used to obtain ancillary files for each time interval separately, mkgrmf for the response files (only one file for all time intervals). We excluded data around three absorption edges because the effective area curve there is affected by uncertainties in the model of the detector contaminant. Data were excluded in the following photon energy intervals: 0.52–0.55 (oxygen K edge), 0.68–0.73 (iron L edge) and 0.84–0.89 keV (neon K edge). Orders were combined through add_grating_orders. Despite the high count rates during the burst, none of the Chandra data are significantly piled up, due to the small frame time and large dispersion. The burst spectra were also independently extracted and fit using idl and isis, confirming all spectral fit results.
| Parameter | Fitted value |
|---|---|
| cm-2 | |
| disk black body k | 0.5910.006 keV |
| black body norm. () | |
| power law photon index | 1.8920.013 |
| power law flux at 1 keV | 0.3990.014 ph s-1cm-2keV-1 |
| gauss centroid | 5.120.09 keV |
| gauss sigma | 1.660.06 keV |
| gauss normalization | 0.01560.0012 phot s-1cm-2 |
| 0.803/1530 | |
| 0.5-20 keV flux | erg cm-2s-1 |
| 0.5-60 keV abs. flux | erg cm-2s-1 |
| 0.5-60 keV unabs. flux | erg cm-2s-1 |
RXTE/PCA spectra were extracted from event mode data using ftool seextrct, filtering out artificial ’clock events’. The PCA spectral response was calculated with pcarsp version 11.7.1. We find that the background model for PCU1 underestimates the spectrum beyond 30 keV, where no source photons are expected, by about 25%. To optimize the statistical quality and employ as many photons as possible, we chose to exclude the bandpass beyond 20 keV rather than to exclude PCU1 data. Below 20 keV the source photon spectrum is at least four times brighter than the background spectrum, so that the error is at most 3% (at 20 keV) for the non-burst emission and less for the burst emission. We verified the results with those obtained after excluding PCU1 and do not find significantly different results. Thus, we employ data of both active PCUs. The dead time fraction was calculated from standard-1 data following the prescription at the RXTE web site666http://heasarc.gsfc.nasa.gov/docs/xte/recipes/pca_deadtime.html and was found to be up to 23.3% at burst peak. This fraction was taken into account when calculating energy fluxes. All spectral bins up to 20 keV contained enough photons for Gaussian statistics to apply.
4 Spectral analysis
XSpec version 12.7.1b was employed as analysis tool. Chandra and RXTE burst spectra were simultaneously modeled when investigating the continuum. RXTE data were fitted between 3 and 20 keV and Chandra data between 0.5 and 6 keV. All spectral bins were grouped so that each bin contains at least 15 photons. No background was subtracted from the Chandra spectra, while the particle-induced plus cosmic diffuse background was subtracted from the RXTE spectra (employing pcabackest). The Chandra background is expected to be a minor part (a few c s-1, see Chandra website777http://cxc.harvard.edu/contrib/maxim/bg/index.html) of the non-burst emission (117 c s-1 on average). We kept the normalization factor of the Chandra data with respect to the RXTE data to 1. When left free, the fit procedure finds a minimum at a different normalization for every spectrum by adjusting other spectral parameters. Furthermore, the improvement in is never more than about 1%. We conclude that the normalization is ill constrained. Thus, fluxes are calibrated against the PCA response.
4.1 Chandra/RXTE pre-burst spectrum
A good representative of the non-burst emission during the burst may be obtained from data during the 2.5 ks prior to the burst. The flux remains approximately constant during that time and is similar to the flux immediately after the burst (for a high-quality light curve from RXTE data, see Fig. 3). Furthermore, there is simultaneous Chandra and RXTE data for this interval. We derived a satisfactory empirical model for these data consisting of a disk black body (e.g., Mitsuda et al. 1984), a power law and a gaussian component, all absorbed by a single medium modeled according to the prescription in Wilms et al. (2000). The Gaussian component only applies to PCA data. It was also often needed in PCA spectra of other X-ray bursts (Galloway et al. 2008) and may be related to the collection of additional Galactic emission in the wide field of view of the PCA. Table 1 presents the best-fit model parameters. The value for is within the range of values found previously by, for instance, Cackett et al. (2009) and Papitto et al. (2009).
4.2 Burst spectrum
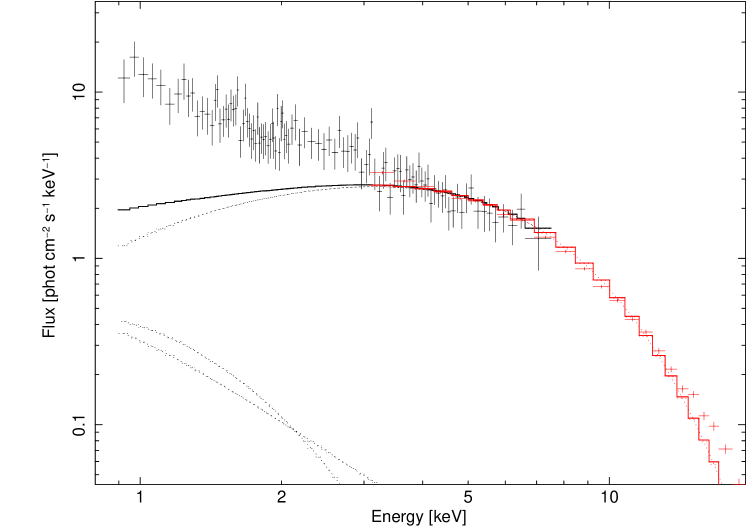

We first fitted the burst data with an absorbed black body model, keeping the non-burst model fixed. This is the most common model applied to X-ray burst spectra. This model does not provide a statistically acceptable fit to the data for the first 20 s of the burst, neither the combined data nor the Chandra and RXTE data alone. This is illustrated in Fig. 4 (top panel) which shows the data for 2 to 5 s after burst onset when the temperature is varying by no more than 10% (see below), along with the best-fit model; the goodness of fit is with degrees of freedom. There is a strong excess at low photon energies, particularly in the Chandra data. In fact, the Chandra data alone are best fitted with a power law instead of a Planck function, in contrast to the RXTE data.
In order to find an explanation for the soft excess, we tested four spectral models. We did this in two time intervals, because the model needs to be applicable over all times. We chose time intervals 2-5 and 12-16 s, since during these times the spectrum does not vary much while the statistical quality is good. The first two models take into account inelastic scattering of photons by electrons in either the NS atmosphere or the accretion disk. The former was first put forward by London et al. (1986), further developed by Madej et al. (2004) and most recently calculated by Suleimanov et al. (2011, 2012). Hot atmospheric electrons harden the photons coming from below and increase the observed temperature to a value that is one to two times larger than the effective temperature. A soft excess remains (see Fig. 7 in Suleimanov et al. 2011). The model’s free parameters are the luminosity in terms of the Eddington value and the NS radius. The fit of this model to the first data set (see Table 2) is insufficient, but that may be expected because model does not formally apply to radiation at the Eddington limit. The fit to the second data set, at sub Edddington flux levels, is not acceptable either. The data have a broader spectrum than the model.
| NS atmosphere model | Reflection model | Double black body | ’’ model |
| Time interval: 2-5 s ( with for black body fit) | |||
| () | () | () | () |
| log | |||
| km | 18% | =63% | |
| cm-3) | 82% | =37% | |
![[Uncaptioned image]](/html/1301.2232/assets/x6.png) |
![[Uncaptioned image]](/html/1301.2232/assets/x7.png) |
![[Uncaptioned image]](/html/1301.2232/assets/x8.png) |
![[Uncaptioned image]](/html/1301.2232/assets/x9.png) |
| Time interval: 12-16 s ( with for black body fit) | |||
| () | () | () | () |
| log | |||
| km | 73% | =80% | |
| cm-3) | 27% | =20% | |
![[Uncaptioned image]](/html/1301.2232/assets/x10.png) |
![[Uncaptioned image]](/html/1301.2232/assets/x11.png) |
![[Uncaptioned image]](/html/1301.2232/assets/x12.png) |
![[Uncaptioned image]](/html/1301.2232/assets/x13.png) |
Scattering by the accretion disk is calculated through the reflection model by Ballantyne (2004). In this model, black body radiation is assumed to hit the accretion disk and instantly photo-ionize it. The disk is modeled as a constant-density 1-dimensional slab. The radiation then is reprocessed by the disk and re-emitted into the line of sight. Above a few keV the reflected spectrum is very similar to the black body spectrum. Below a few keV it shows a soft excess whose detail depends on the level of ionization. The magnitude of the soft excess is a strong function of the density of the disk (see Fig. 4 in Ballantyne 2004). The total amount of reflection depends on the observer’s viewing angle of the accretion disk. The model’s free parameters are the black body temperature , the ionization parameter log ( in units of erg cm s-1) and the reflection fraction . We first tested the disk model with density H-atoms cm-3 on the 2-5 s data, but this turns out to be unacceptable. A model with H-atoms cm-3 performs better and is able to fit the soft excess reasonably. The results are provided in Table 2. The reflection fraction turns out to be very large (10) for the 2-5 s data. It cannot be forced to smaller values by leaving free other parameters such as . That may suggest that is even higher, although 1023 cm-3 is close to the maximum value in standard accretion disk theory (Shakura & Sunyaev 1973). The strong coupling between and makes it difficult to obtain a good constraint on both, though. Unfortunately, due to increasing importance of 3-body interactions, there is no model yet available for higher values.
The third model involves the addition of a second black body component with a different temperature. This is based on the possibility that there is exists a boundary layer between the accretion disk and the neutron star where radiation is released due to friction between both (Inogamov & Sunyaev 1999, 2010). Fits with this model are fairly good, see Table 2. We checked whether the small residual soft excess for the 2-5 s data is resolvable with a smaller value for but it is not completely ( with for cm-2).
The fourth model is a straightforward variation of the initial model, namely to leave free the normalization (with respect to the pre-burst value) of the persistent emission component listed in Table 1. This simple model was recently employed by Worpel et al. (2013) to model successfully 332 PCA-detected X-ray bursts with photospheric expansion in the 3-20 keV band. This model performs at least as well in terms of as the double black body and reflection model, see Table 2, but on top of that it shows the least amount of systematic trend in the residuals for both spectra. Therefore, we chose to perform the full time-resolved spectral analysis with this model and note that the results for the primary black body component are similar as in the double black body model. Henceforth, we will call this the ’’ model.
The ’’ model is illustrated in the bottom panel of Fig. 4 where the 2-5 s spectrum is shown after the fitted black body model is subtracted. The model of the pre-burst spectrum is also shown. Over the 0.5-30 keV range shown, the shape is the same to a fairly accurate degree. To obtain a sense of how similar the persistent spectrum during this interval is to that before the burst, we left free in addition the power law and disk black body parameters. The best-fit power law index becomes and the disk black body ( for ). Therefore, it is somewhat harder.
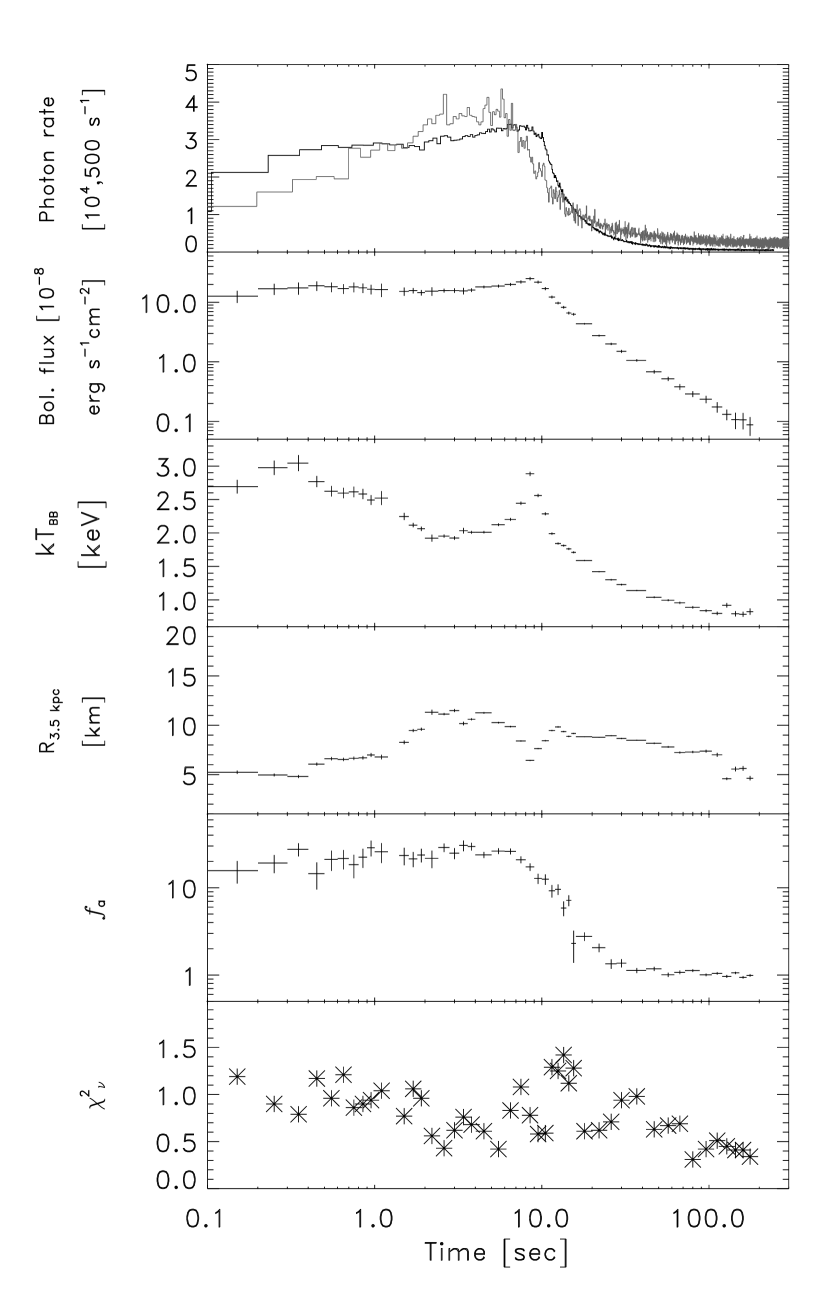
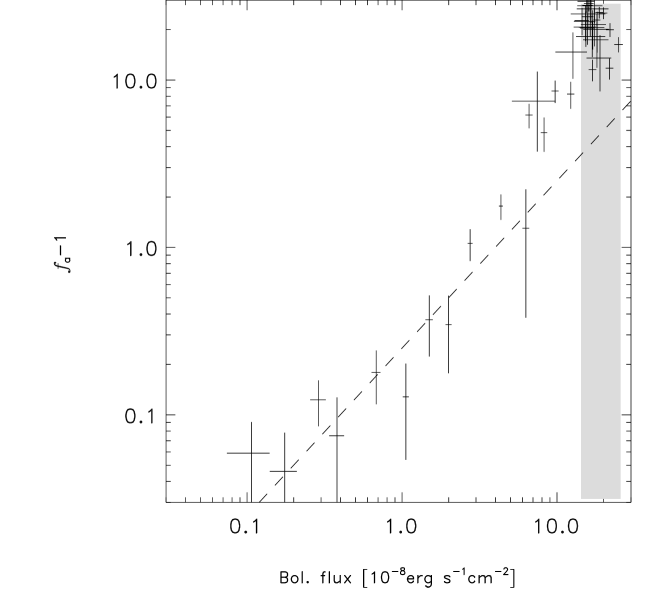
We defined time bins covering 200 s from the burst onset, that were sufficiently short to resolve the spectral variations, while maintaining adequate signal-to-noise for precise spectral parameters. The adopted binning, achieved via trial-and-error, totaled 47 approximately logarithmically-spaced bins between 0.1 s at burst onset and 16 s in the tail. All time bins except one bridge the RXTE data gaps due to the full data buffer (see Sect. 2). In Fig. 5 we show the results of fitting the ’ model. The fits are excellent, except perhaps between 10 and 20 s, see Sect. 4.3. The soft excess remains until 20-30 s after the burst onset. In Fig. 6 we plot against the burst bolometric flux. This shows that the increase of the persistent spectrum is present for burst fluxes above 10% of the peak flux and that its flux is not a simple constant fraction of the thermonuclear burst flux.
The peak radius reached during the expansion interval was 10 km, a factor of approximately 2 larger than the radius at touchdown. This degree of expansion is quite modest; in the strongest radius expansion bursts, the radius expands to at least times the NS radius. We note that, similar to other bursts from this source, the radius increases following touchdown up to a level comparable to the maximum reached during the expansion. However, this increase during the burst tail is usually attributed to a decrease in the spectral correction factor as the flux decreases (e.g. Suleimanov et al. 2011) so that the photospheric radius during the expansion is significantly in excess of the NS radius.
The burst reaches a peak flux of erg cm-2s-1 (after accounting for the increased persistent emission), and the bolometric burst fluence is erg cm-2 over 184 s. Table 3 presents the complete set of derived burst parameters. One can estimate the burst recurrence time according to , where (Galloway & Cumming 2006) and bolometric persistent flux erg cm-2s-1. This results in ks. This is similar to the maximum continuous data set available around the burst (see Fig. 2). An interesting number is the total number of bursts expected in the whole outburst. If we assume a Crab spectrum for the whole outburst, the total fluence under the estimated integral of the outburst light curve (Fig. 2) would be about erg cm-2. The total number of expected bursts would then be . The net coverage of the RXTE and Chandra observations is only 2.5 d compared to roughly 25 d for the whole outburst. Thus, it is not unexpected to have detected only one burst.
4.3 Search for absorption edges

We extracted full-resolution orders -1 and +1 of the LETGS data for
the first 20 s and fitted the spectrum after subtraction of the
pre-burst spectrum with a power law and show in Fig. 7 the
deviations of the data with respect to the continuum model. The
goodness of fit is (). There is no obvious
sought-after edge visible. We determined the 90% confidence upper
limits on the equivalent width888we define the equivalent width
as the integral over energy of
with the edge
energy and its optical depth of any absorption edge by
fixing a model for the edge at various photon energies, leaving free
the power law parameters and edge depth while fixing and
determining the edge depths for which is 2.7 above the
minimum value. We find the upper limit to range between 20 eV at
1.8–2.4 keV to 200 eV at 1.3 and 3.3 keV up to 400 eV at 5.0 keV,
see Fig. 8.
There is a broad dip at 1.8 keV which may arise from a broad absorption line or edge feature. Fitting it with an absorption line yields a centroid energy of keV, a line width of keV and an equivalent width of eV. The goodness of fit is (). Fitting it with an absorption edge yields an edge energy of 1.290.01 keV and an optical depth of 0.290.06 with (). Adding a second edge does not really improve the fit, with ().
We searched for edges in smaller time frames and found none. The upper limits are a factor of 4 to 5 worse at 1 s resolution than at 20 s.
In the RXTE data we analyzed the spectra with the highest values: between 6 and 8 s (this is near the touch-down point) and between 12 and 16 s. These spectra show spectral deviations which are reminiscent of the shape of an absorption edge with an energy between 7 and 8 keV and an optical depth of 0.2-0.3 (equivalent width 0.7-1.1 keV). Unfortunately, these edges are not covered by the Chandra data so we cannot get confirmation from there. We repeated the time-resolved spectroscopic analysis illustrated in Fig. 5, but adding an absorption edge and find that the data are consistent with the continuous presence of the above mentioned edge, but that it is detectable only when the statistical quality of the data are sufficient to allow detection which is between roughly 6 and 40 s after burst onset.
4.4 Search for spectral lines
We searched for absorption and emission lines in the LETGS data during five time intervals: 0-2 s during the burst rise, 2-5 s during the first part of the peak, 5-9 s during the second part of the peak, 9-12 s during the first part of the tail and 12-16 s during the second part of the tail. A 4.0 detection threshold was employed. This is equivalent to one chance detection in all 20,000 trials. The number of trials is determined as follows: 200 independent tests per 2-12 Å spectrum with a LETGS resolution and binning of 0.05 Å; a factor of 2 for five successive 2 times binned-up versions of the spectra; and a factor of 5 for the five time intervals mentioned above. In order to have a 10% chance of a false positive (in either absorption or emission), a one-tailed test would require a 1 in 20,000 chance for detection in random data, which is about 4.0 sigma. We also searched in 4 different time intervals (0-7, 2-4, 4-6, and 7-30.5 s) that overlap the above time intervals.
The strongest candidate line that we find is an emission feature that we find in the 0-7 s time interval at 11.9 Å (or 1.04 keV), see Fig. 9. This feature is 4.7 above the continuum in a binning of 0.11 Å. Given that we searched in additional time intervals, the significance should be diminished to 4.6. The equivalent width is about 4 Å.

5 Timing analysis
We performed a timing analysis of the RXTE data of the burst, by generating Fourier power spectra for 10-s data stretches every 1 s, employing the event mode data with 125 s resolution. We limited the analysis to channels 5–37 (2–10 keV), where the ratio of the burst photon rate to the background rate is highest. We detect burst oscillations with a burst fractional amplitude of 2–5% rms in the tail. This value is calculated without taking into account the contribution of the accretion powered pulsations that might still be present at the time of the burst. This correction is relatively small since the accretion powered pulsations have pulsed fractions of 3–4% rms prior and after the occurrence of the burst (see for example Patruno et al. 2012). Furthermore the photon count rate detected when burst oscillations are seen is between two and four times the count rate received prior to the occurrence of the burst, meaning that the oscillations seen are truly of nuclear origin (see e.g., Eq. 11 in Watts et al. 2005). Similar considerations apply to the burst oscillation phase, which are negligibly influenced by the presence of accretion powered pulses. Burst oscillations were marginally detected (between 2 and 3 sigma for 1 s long trains) at 400-401 Hz during the burst rise with fractional rms amplitudes of up to 5%. The formal 90%-confidence upper limit on the fractional rms amplitude is 8%. This is consistent with measurements of previous bursts from SAX J1808.43658 with RXTE (Chakrabarty et al. 2003; Bhattacharyya & Strohmayer 2006) where amplitudes were seen between 5 and 25% in 0.25 s long trains. Our data is less sensitive because of the smaller number of active PCUs (2 instead of 4).
The time resolution of the ACIS-S CC mode data is 2.85 ms (351 Hz). This implies that the burst oscillation signal (401 Hz) cannot be easily resolved in the Chandra data. Simulations show that to detect a sinusoidal pulsation at 401 Hz in a 1 s stretch of data with a resolution of 2.85 ms requires a relative rms amplitude of at least 25% to be significantly detected as an alias at 401-351=50 Hz which is an order magnitude larger than ever detected for SAX J1808.43658.

6 Discussion
The 2011 outburst of SAX J1808.43658 is the seventh since its discovery in 1996 (in ’t Zand et al. 1998), and comes 3 years after the previous outburst. Galloway (2008) found that the onset time of the earlier outbursts followed a quadratic relation with time, which predicted the time of the previous outburst to within 11 d. However, the 2011 outburst occurred 197 d earlier than predicted, suggesting that the long-term mass transfer rate may be increasing. We estimated the total fluence for the outburst as erg cm-2, which is significantly lower than for the first four outbursts (Galloway 2006). Thus, it seems likely that the long-term accretion rate remains substantially below that of the first decade of observations.
6.1 Peak flux and burst oscillations
The thermonuclear burst detected from SAX J1808.43658 on 2011 November 8 is the brightest ever detected with Chandra, and the second brightest with RXTE. Within the 1907 ks exposure time on SAX J1808.43658 during the complete RXTE mission, this is the ninth burst (e.g., Galloway et al. 2008). The second brightest burst has a peak flux of erg cm-2s-1 (this is burst no. 4 in Galloway et al. 2008, note that this publication lists peak fluxes before dead time correction) that is only slightly fainter than the brightest. Our burst is otherwise fairly ordinary for SAX J1808.43658, including its timing behavior. Galloway & Cumming (2006) find that bursts from SAX J1808.43658 are due to flashes in a hydrogen-depleted layer and burn primarily helium.
The Eddington limit of a solar-composition photosphere on the surface of a 10 km radius NS of mass 1.4 M⊙ at a distance of 3.5 kpc corresponds to a flux of 1.4 erg cm-2s-1, for a helium-rich photosphere 2.6 erg cm-2s-1. The peak flux for the burst from SAX J1808.43658 is within this range, clearly indicating that the energy production rate due to the thermonuclear flash is consistent with the Eddington rate. It is perhaps worth noting here that the distance estimate of 3.5 kpc for SAX J1808.43658 comes from a comparison of the measured burst energetics and recurrence times with the predictions of theoretical ignition models (Galloway & Cumming 2006), not merely from the peak flux of previous PRE bursts, as is the case for the majority of LMXB distances. While the time dependence of the black body temperature and normalization is also characteristic for an Eddington-limited burst, with the typical ’touch-down’ peak at 10 s (see Fig. 5), the radius expansion is limited to at most a factor of about 2. This is typical for moderate expansion (in ’t Zand & Weinberg 2010). There is no evidence for the expulsion of a shell, such as a (short) precursor. Ergo, this is not a superexpansion burst (see Sect. 1).
The accretion flux prior to the burst translates to a 0.5-20 keV luminosity of 4.5 erg s-1 for a distance of 3.5 kpc, or 64 times smaller than the burst peak in the same bandpass.
The burst oscillations detected in this burst are very similar to those detected in the RXTE data of previous bursts. The amplitude compares well with the fractional rms amplitude of 2-4% in previous bursts (Watts 2012; Patruno & Watts 2012).
| Parameter | Value |
|---|---|
| Onset time | MJD 55873.91320 (barycentered) |
| 2011 Nov 8 21:55:00.50 UTC | |
| 563407175.90 s RXTE MET | |
| 437176836.46 s Chandra MET | |
| Rise times | s (25 to 90% of peak) |
| s (0 to 100%) | |
| s (0 to 70%) | |
| e-folding decay time | 12.0 s |
| Time scale (fluence/peak flux) | 12.9 s |
| Duration | 500 s (down to 0.03% of peak flux) |
| Unabs. bol. peak flux | erg cm-2s-1 |
| Unabs. bol. fluence | erg cm-2 |
| 3-20 keV persistent flux | erg cm-2s-1 |
| 0.5-60 keV unabsorbed flux | erg cm-2s-1 |
6.2 Broad-band spectrum
The Chandra data are interesting for the peculiar behavior of the burst spectral continuum. As illustrated in Fig. 4, data below 3-4 keV draw a rather different picture of the burst spectrum than above. The sub-3 keV data reveal a strong soft excess above the black body. This is not the first time that a soft excess is observed in a burst spectrum, although it seems to be a rare phenomenon, possibly because many bursters have too much interstellar absorption to allow detection of a soft excess. We count about 250 X-ray bursts that have been detected with sub 3 keV coverage by XMM-Newton, Chandra and Swift-XRT (e.g., Kong et al. 2007; in ’t Zand et al. 2009; Galloway et al. 2010). Most of these do not show photospheric expansion. Only Asai & Dotani (2006) and Boirin et al. (2007) report on strong soft excesses found in some bursts from the eclipsing LMXB EXO 0748676. They propose that this is due to a decrease in absorption by the circumstellar medium arising from the photo-ionization of that medium by the burst photons, thereby allowing more accretion disk flux to reach the X-ray detector. This explanation may be plausible for a high-inclination system (–83∘ for EXO 0748676; Parmar et al. (1986)), but for SAX J1808.43658 the inclination angle is suggested to be low (; Deloye et al. 2008), so there is little local obscuring material affecting the spectrum. We note that the two published Chandra HETGS grating observations of 33 X-ray bursts (including 4 with photospheric expansion; Thompson et al. 2005; Galloway et al. 2010) could have found soft excesses of similar magnitude as in SAX J1808.43658, had they been present.
The net burst spectrum is not consistent with the NS atmosphere model of Suleimanov et al. (2011). There is better agreement with the model for reflection against the accretion disk and even better with the simple double black body model. Mildly better overall is the agreement with the ’’ model, because this models appears to have the smallest systematic trends in its residuals (see bottom panels of figures in Table 2). In a study of 332 radius-expansion bursts seen with RXTE, Worpel et al. (2013) modeled the 3-20 keV spectra in the same ’’ manner. They found as a general feature that is significantly in excess of 1, with the highest values arising from the bursts observed at the lowest pre-burst fluxes. Our combined Chandra-RXTE analysis of one burst from SAX J1808.43658 is consistent with those results and shows additionally that this behavior extends to lower energies, giving rise to a large flux excess below 3 keV for a system with low (see Fig. 4). However, we note that the difference in performance with other models is not much better. It is in the spirit of Occam’s Razor (with only 1 additional free parameter) that we provide the full time-resolved spectroscopic analysis in terms of the simple ’’ model, but other models are almost equally justified.
Worpel et al. (2013) suggest that the increase of the non-burst emission is caused by the Poynting-Robertson (PR) effect, which removes angular momentum from the inner accretion disk due to radiation drag, thereby increasing the accretion rate during the burst. If the accretion rate in SAX J1808.43658 increased by a factor of 20 during the burst, based on our maximum best-fit value of , it would come close to 50% of the Eddington limit. Significant changes in the persistent spectral state might be expected, analogous to the so-called spectral state changes of the persistent emission that are attributed to changes in the geometry of the accretion disk (e.g., Done et al. 2007, and references therein). Since the persistent spectrum of SAX J1808.43658 at the time of the burst is quite hard, a softening of the spectrum seems most likely. However, it is not obvious that a typical hard-to-soft spectral state change can take place in response to an increase in accretion rate sustained for s, or even if the effects of PR drag would produce the same observable effect. Our data suggests that, if there is a change, the persistent spectrum instead becomes harder during the burst.
We note also that if the accretion rate increases by a factor of 20 over 10 s, the additional matter must be that which would otherwise have been accreted over the next 200 s, and one would thus expect a suppression of the accretion rate following the burst. This would be the hallmark of the PR effect taking place. We found no evidence of values smaller than 1, out to 500 s after the burst. However, the recuperation time of the disk may be longer if the disk viscosity is relatively small (Walker 1992), so that the suppressed accretion rate would be spread out over a longer interval, and hence undetectable.
The pre-burst spectrum likely includes a component from inverse Compton scattering of undetectable soft photons (with energies keV for this burst) by an accretion disk corona (ADC; White & Holt 1982; Begelman et al. 1983; Begelman & McKee 1983). An increase in the persistent spectrum would therefore require either a larger ADC, or an increase of soft seed photons into the ADC. The burst cannot produce a larger ADC through photoionization, as the temperature of the plasma can only be raised to its Compton temperature which is for a blackbody spectrum. This temperature is much lower than the keV temperature required to explain the high-energy extent of the persistent emission. Likewise, since the local dissipation in the accretion disk scales as (where is the radius along the disk), expansion of the ADC outwards through a wind or outflow would not be able to explain the significant increase in the ADC emission. This constraint could be circumvented if the disk and ADC were expanded inwards by the burst, as through Poynting-Roberston drag (see discussion above).
Perhaps the simplest explanation for an increase in the persistent spectrum during the burst is a larger influx of seed photons produced by reprocessing in the accretion disk. As discussed in Sect. 4.2, high density reflection models were able to explain a large fraction of the strong soft excess seen early on in the burst. This emission, which extends below keV, is dominated by thermal bremsstrahlung produced by the X-ray heated outer layers of the disk (Ballantyne 2004; Ballantyne & Everett 2005), and is a natural source of additional seed photons to the corona. This explanation has several advantages: first, the absorption and re-emission of the burst will all occur on not much more than twice the light-crossing time of the system, and would explain why the enhanced persistent emission is seen even in the earliest phases of the burst. Similarly, Figs. 5 and 6 illustrate that the increase in the persistent flux falls rapidly as the illuminating blackbody fades, which would be a natural consequence of less reprocessing in the inner disk. Finally, if reprocessing accounts for most of the soft excess, then this reduces the values of required to fit the spectra. Nevertheless, this idea remains just informed speculation, and further study of the broadband spectra of Type 1 X-ray bursts, as well as a concentrated theoretical effort into understanding the interaction of a burst with the surrounding accretion flow, is needed to understand the physical processes at work in these environments.

6.3 Evidence for spectral features
The high spectral resolution data provided by the Chandra/LETGS show no evidence for the sought-after absorption edge with upper limits in the equivalent width of at best 20 eV. The residuals between 1 and 2 keV with respect to a continuum fit (Fig. 7) are not clearly identifiable with a single absorption edge or two. A single edge would have an energy of 1.29 keV. For a gravitational redshift anywhere between for far away from the NS and on the surface (for a NS with mass and radius km), the expected range of edge energies is 1.3–1.8 keV. This is not identifiable with a K or L-edge of any likely element. The redshifted K-edge of hydrogen-like Si comes closest at 2.0 keV. Only K-edge energies of Mg and Al and L-edge energies of Ga, Ge, As, Se and Br would fit. Also, the residuals in this energy range are likely to be affected by a sharp change in the effective area arising from the K-edge of the neutral silicon CCD material.
For a 20 s exposure, the upper limit on the equivalent width ranges between 42 eV at the Si K-edge (2.67 keV) and 124 eV at the Ca K-edge (3.48 keV). These are the two most abundant elements expected for pure helium ignition according to Weinberg et al. (2006) with the largest predicted absorption edges. These upper limits are compared with predicted values in Fig. 10. The predictions are for ignition in a pure helium layer like for SAX J1808.43658 (Galloway & Cumming 2006). The predictions are at (for Si) or below the measured upper limits. Thus, these measurements are consistent with predictions. We note that the tentative edge detected in the RXTE data at about 7.9 keV has an equivalent width of 0.7-1.1 keV and is, thus, much higher than the prediction for the Fe-K edge. On the other hand, the picture that this edge draws is not consistent with the expectation. The edge energy and optical depth are consistent with being constant while the temperature of the photo-ionizing radiation field changes between 3 and 1 keV. This is different from the features seen by in ’t Zand & Weinberg (2010) and suggests one should be careful in associating this feature with matter close to the NS.
We find marginal evidence for an emission line at 11.9 Å with an equivalent width of 4 Å. This wavelength resides in the range of rest wavelengths of a number of Ne lines and is slightly blue-shifted from the Fe L line complex. We believe the line is too marginal to draw any further physical conclusions. However, it is interesting to note that recently a strong emission line has been detected (Degenaar et al. 2012) at about the same energy in a long superexpansion burst, with an equivalent width that is about 3 times smaller than the feature we see, but for a much longer duration (10 min).
Although this burst is Eddington limited, it does not exhibit strong photospheric expansion. Such expansion will probe the predictions at lower black body temperatures in Fig. 10. Thus, the sensitivity would be better. We suggest to focus future searches for absorption edges on burst with those, ergo the ’superexpansion’ bursts, since these have not yet been detected at high spectral resolution. The most opportune sources to search in are 4U 1820-30 (in globular cluster NGC 6624) and 4U 1724-30 (in globular cluster Terzan 2), because they show bursts every few hours to days (4U 1820-30 in the low/hard state) with at least 25% of the time superexpansion (in ’t Zand & Weinberg 2010; in ’t Zand et al. 2012).
7 Conclusion
A simultaneous Chandra-LETGS/RXTE detection of a very bright thermonuclear X-ray burst with moderate photospheric expansion and low presents a unique opportunity to study the 0.5-30 keV spectrum of such an event, with large sensitivity and high spectral resolution below 6 keV. We find that
-
the spectrum show a strong deviation from black body radiation, particularly at low energies where it exhibits a soft excess that exceeds the black body by an order of magnitude. The non-Planckian component has a similar spectral shape as the pre-burst spectrum that is powered by accretion, suggesting that the accretion flow changes during the burst, probably due to the near-Eddington flux from the burst. Exactly how that happens is difficult to determine, mostly because there is no detailed model yet available for the dynamic and radiative interaction of a burst with the pre-existing accretion flow, but most likely it is related to an increase of seed photons in the ADC. Future work should include a hydrodynamic model of the interaction between X-ray bursts and accretion disks and a comprehensive of study of values over bursts with and without photospheric expansion;
-
no unambiguous spectral features are detected. The upper limits for absorption edges are, however, consistent with the theoretically predicted equivalent widths due to ejected ashes. It is expected that edges are deeper for bursts with photospheric superexpansion. Therefore, future searches with Chandra should preferably concentrate on those. This is also underlined by the recent finding by Degenaar et al. (2012). Regarding absorption edges in bursts with moderate photospheric expansion, investigating superbursts with current grating spectrometers would be interesting and, in the farther future, the proposed LOFT mission with a 10 m2 silicon drift detector (Feroci et al. 2012) has the right combination of sensitivity and spectral resolution to make progress.
Acknowledgements.
We thank Valery Suleimanov, Juri Poutanen, Tullio Bagnoli, Hauke Worpel, Daniel Haas, David Huenemoerder for useful discussions, and Suleimanov and Poutanen for making available their model in a form that is suitable for use in XSpec. We are grateful to Harvey Tananbaum, Nancy Wolk, Jeremy Drake and the Chandra team for their support of this quick (3.5 d turn around) TOO. JZ and DG acknowledge ISSI for the hospitality in Bern where part of this work was performed. This research has made use of data and software, in the application package ciao, provided by the Chandra X-ray Center (CXC), RXTE data provided by the RXTE Guest Observer Facility, MAXI data provided by RIKEN, JAXA and the MAXI team, and Swift/BAT data provided by the Swift/BAT team.References
- Asai & Dotani (2006) Asai, K. & Dotani, T. 2006, PASJ, 58, 587
- Ballantyne (2004) Ballantyne, D. R. 2004, MNRAS, 351, 57
- Ballantyne & Everett (2005) Ballantyne, D. R. & Everett, J. E. 2005, ApJ, 626, 364
- Barthelmy et al. (2005) Barthelmy, S. D., Barbier, L. M., Cummings, J. R., et al. 2005, Space Sci. Rev., 120, 143
- Begelman & McKee (1983) Begelman, M. C. & McKee, C. F. 1983, ApJ, 271, 89
- Begelman et al. (1983) Begelman, M. C., McKee, C. F., & Shields, G. A. 1983, ApJ, 271, 70
- Bhattacharyya & Strohmayer (2006) Bhattacharyya, S. & Strohmayer, T. E. 2006, ApJ, 642, L161
- Boirin et al. (2007) Boirin, L., Keek, L., Méndez, M., et al. 2007, A&A, 465, 559
- Brinkman et al. (2000) Brinkman, A. C., Gunsing, C. J. T., Kaastra, J. S., et al. 2000, ApJ, 530, L111
- Cackett et al. (2009) Cackett, E. M., Altamirano, D., Patruno, A., et al. 2009, ApJ, 694, L21
- Chakrabarty et al. (2003) Chakrabarty, D., Morgan, E. H., Muno, M. P., et al. 2003, Nature, 424, 42
- Cottam et al. (2002) Cottam, J., Paerels, F., & Mendez, M. 2002, Nature, 420, 51
- Degenaar et al. (2012) Degenaar, N., Miller, J. M., Wijnands, R., Altamirano, D., & Fabian, A. C. 2012, ArXiv e-prints
- Deloye et al. (2008) Deloye, C. J., Heinke, C. O., Taam, R. E., & Jonker, P. G. 2008, MNRAS, 391, 1619
- Done et al. (2007) Done, C., Gierliński, M., & Kubota, A. 2007, A&A Rev., 15, 1
- Feroci et al. (2012) Feroci, M., Stella, L., van der Klis, M., et al. 2012, Experimental Astronomy, 34, 415
- Galloway (2008) Galloway, D. 2008, in American Institute of Physics Conference Series, Vol. 983, 40 Years of Pulsars: Millisecond Pulsars, Magnetars and More, ed. C. Bassa, Z. Wang, A. Cumming, & V. M. Kaspi, 510–518
- Galloway (2006) Galloway, D. K. 2006, in American Institute of Physics Conference Series, Vol. 840, The Transient Milky Way: A Perspective for MIRAX, ed. F. D’Amico, J. Braga, & R. E. Rothschild, 50–54
- Galloway & Cumming (2006) Galloway, D. K. & Cumming, A. 2006, ApJ, 652, 559
- Galloway et al. (2008) Galloway, D. K., Muno, M. P., Hartman, J. M., Psaltis, D., & Chakrabarty, D. 2008, ApJS, 179, 360
- Galloway et al. (2010) Galloway, D. K., Yao, Y., Marshall, H., Misanovic, Z., & Weinberg, N. 2010, ApJ, 724, 417
- Garmire et al. (2003) Garmire, G. P., Bautz, M. W., Ford, P. G., Nousek, J. A., & Ricker, Jr., G. R. 2003, in Society of Photo-Optical Instrumentation Engineers (SPIE) Conference Series, Vol. 4851, Society of Photo-Optical Instrumentation Engineers (SPIE) Conference Series, ed. J. E. Truemper & H. D. Tananbaum, 28–44
- in ’t Zand et al. (2001) in ’t Zand, J. J. M., Cornelisse, R., Kuulkers, E., et al. 2001, A&A, 372, 916
- in ’t Zand et al. (1998) in ’t Zand, J. J. M., Heise, J., Muller, J. M., et al. 1998, A&A, 331, L25
- in ’t Zand et al. (2012) in ’t Zand, J. J. M., Homan, J., Keek, L., & Palmer, D. M. 2012, A&A, 547, A47
- in ’t Zand et al. (2009) in ’t Zand, J. J. M., Keek, L., Cumming, A., et al. 2009, A&A, 497, 469
- in ’t Zand & Weinberg (2010) in ’t Zand, J. J. M. & Weinberg, N. N. 2010, A&A, 520, A81
- Inogamov & Sunyaev (1999) Inogamov, N. A. & Sunyaev, R. A. 1999, Astronomy Letters, 25, 269
- Inogamov & Sunyaev (2010) Inogamov, N. A. & Sunyaev, R. A. 2010, Astronomy Letters, 36, 835
- Jahoda et al. (2006) Jahoda, K., Markwardt, C. B., Radeva, Y., et al. 2006, ApJS, 163, 401
- Jonker et al. (2003) Jonker, P. G., Méndez, M., Nelemans, G., Wijnands, R., & van der Klis, M. 2003, MNRAS, 341, 823
- Kong et al. (2007) Kong, A. K. H., Miller, J. M., Méndez, M., et al. 2007, ApJ, 670, L17
- Lewin et al. (1993) Lewin, W. H. G., van Paradijs, J., & Taam, R. E. 1993, Space Science Reviews, 62, 223
- London et al. (1986) London, R. A., Taam, R. E., & Howard, W. M. 1986, ApJ, 306, 170
- Madej et al. (2004) Madej, J., Joss, P. C., & Różańska, A. 2004, ApJ, 602, 904
- Markwardt et al. (2011) Markwardt, C. B., Palmer, D. M., Barthelmy, S. D., et al. 2011, The Astronomer’s Telegram, 3733, 1
- Matsuoka et al. (2009) Matsuoka, M., Kawasaki, K., Ueno, S., et al. 2009, PASJ, 61, 999
- Mitsuda et al. (1984) Mitsuda, K., Inoue, H., Koyama, K., et al. 1984, PASJ, 36, 741
- Paizis et al. (2012) Paizis, A., Nowak, M. A., Rodriguez, J., et al. 2012, ArXiv e-prints
- Papitto et al. (2009) Papitto, A., Di Salvo, T., D’Aì, A., et al. 2009, A&A, 493, L39
- Parmar et al. (1986) Parmar, A. N., White, N. E., Giommi, P., & Gottwald, M. 1986, ApJ, 308, 199
- Patruno et al. (2012) Patruno, A., Bult, P., Gopakumar, A., et al. 2012, ApJ, 746, L27
- Patruno & Watts (2012) Patruno, A. & Watts, A. L. 2012, ArXiv e-prints
- Shakura & Sunyaev (1973) Shakura, N. I. & Sunyaev, R. A. 1973, A&A, 24, 337
- Strohmayer & Bildsten (2006) Strohmayer, T. & Bildsten, L. 2006, New views of thermonuclear bursts (Compact stellar X-ray sources), 113–156
- Suleimanov et al. (2011) Suleimanov, V., Poutanen, J., & Werner, K. 2011, A&A, 527, A139
- Suleimanov et al. (2012) Suleimanov, V., Poutanen, J., & Werner, K. 2012, A&A, 545, A120
- Thompson et al. (2005) Thompson, T. W. J., Rothschild, R. E., Tomsick, J. A., & Marshall, H. L. 2005, ApJ, 634, 1261
- van Paradijs et al. (1990) van Paradijs, J., Dotani, T., Tanaka, Y., & Tsuru, T. 1990, PASJ, 42, 633
- Walker (1992) Walker, M. A. 1992, ApJ, 385, 642
- Wang et al. (2001) Wang, Z., Chakrabarty, D., Roche, P., et al. 2001, ApJ, 563, L61
- Watts (2012) Watts, A. L. 2012, ArXiv e-prints
- Weinberg et al. (2006) Weinberg, N. N., Bildsten, L., & Schatz, H. 2006, ApJ, 639, 1018
- White & Holt (1982) White, N. E. & Holt, S. S. 1982, ApJ, 257, 318
- Wijnands & van der Klis (1998) Wijnands, R. & van der Klis, M. 1998, Nature, 394, 344
- Wilms et al. (2000) Wilms, J., Allen, A., & McCray, R. 2000, ApJ, 542, 914
- Worpel et al. (2013) Worpel, H., Galloway, D. K., & Price, D. J. 2013, arXiv:1303.4824