2012 Vol. X No. XX, 000–000
22institutetext: Physics Department, M.L.S. University, Udaipur, India
\vs\noReceived …; accepted …
Near-Infrared Monitoring and Modeling of V1647 Ori in its On-going 2008-2012 Outburst Phase
Abstract
We present results of Mt Abu JHK photometric and HI Brackett line monitoring of the eruptive YSO V1647 Orionis (McNeil’s Object) during the on-going outburst phase in 2008-2012. We discuss JHK color patterns and extinction during the outburst and compare them with those in the previous outburst phase in 2004-2005 and in the intervening quiescent period of about 2 years. Commencing from early 2012, the object shows a slow fading out in all the bands. We report brightness variations in the nearby Herbig-Haro object HH22 possibly associated with those in V1647 Ori. We also present modeling of the spectral energy distributions of V1647 Ori during both its recent outburst and its quiescent phase. The physical parameters of the protostar and its circumstellar environment obtained from the modeling indicate marked differences between the two phases.
keywords:
stars: pre–main sequence – stars: formation – (stars:) circumstellar matter – stars: individual:V1647 Ori1 Introduction
It is believed that most of the low-mass pre-main-sequence (PMS) stars undergo a recurring active stage during which they show enhanced brightness or an ‘outburst’ lasting for a few years to a decade or longer (e.g., Stahler & Palla (2004) and references therein). Among the various mechanisms proposed (see Hartmann & Kenyon (1996)), by which the rate of accreted mass increases substantially over a period of time causing the outburst, are the thermal instability in accretion disks (Bell et al. (1995)), evolution from envelope accretion to disk magnetospheric accretion (Hartmann & Kenyon (1985)), and gravitational or tidal triggering by the passage of a putative binary companion (Bonnell & Bastein (1992)). Depending upon the duration of the outburst, PMS stars are sub-classified as FUors (prototype being FU Orionis) that last for over a decade or longer and EXors (prototype EX Lupis) that occur for shorter periods of about two years (Herbig (1977)). V1647 Ori (IRAS 05436-0007), first discovered by McNeil (2004) and since called McNeil’s object, showed an outburst akin to EXors, yet it seemed to be distinctive (e.g., Ojha et al. (2006); Aspin et al. (2008); Aspin & Reipurth (2009) and the references therein). While its outburst duration was similar to EXors, its spectral characteristics seemed to be so different from EXors that it may as well be a new class of object in itself (Kun (2008)). However, in recent times the star showed a second outburst (currently on-going) starting from mid-2008 (for a comprehensive study, see Aspin (2011) and references therein). Reporting post-2008 outburst behavior, Aspin (2011) concluded that the object remained “in an elevated photometric state” till early 2011. It was also concluded that McNeil’s nebular morphology remained unchanged in its two recent outbursts. Furthermore a large discrepancy in the accretion rates derived from H and Br emission line fluxes was reported. Using high resolution spectroscopy, Brittain et al. (2010) showed that the accretion rates derived from Br emission were similar during the two outbursts (though varying) and a factor of 16 higher than the smallest accretion rate during the quiescent phase. These studies showed that the current (on-going) outburst was basically different from the earlier one and this deserves further investigation. Clearly, therefore, continued monitoring of the object is necessary to detect possible changes in its behavior post-2011.
In this work, we present a substantial volume of JHK photometric and some K band spectroscopic observations made from Mt Abu during 2008-2012. We discuss their possible implications on the nature of V1647 Ori, in comparison with the previous outburst and quiescent phases. Further, we attempt to model the Spectral Energy Distributions (SED) using an on-line modeling tool developed by Robitaille et al. (2007) and compare the physical parameters including accretion rates of both disk and envelope of V1647 Ori during the two epochs (viz. quiescence and outburst). Section 2 gives the details of our observations and Section 3 presents the results and discussion, including SED modeling results. Section 4 gives important conclusions.
2 Near-Infrared Photometric and Spectroscopic Observations
JHK photometric observations were made using the Near Infrared Camera & Multi-object Spectrograph (NICMOS) (256x256 HgCdTe array) and the Near Infrared Camera & Spectrograph (NICS) (HAWAII-1 1kx1k HgCdTe array) at the Cassegrain focus of the 1.2m infrared telescope situated at PRL’s Mt Abu Observatory. The data consists of more than 40 sets of JHK observations during the period 2004-2012, a majority of which were during the period 2008-2012. A part of the photometric data obtained between 2004-2005 had appeared in Ojha et al. (2006). Single frame integration times were 40-60s/20-30s for J, 20-40s/10-20s for H and 2s/10-15s for K band for the NICMOS/NICS cameras. Several such frames were taken amounting to total integration times of 120-720s for NICMOS and 120-400s for NICS. A sufficient number of dithered frames were obtained for effective background subtraction and flat fielding. The seeing during the observations was typically 1.7-2.5 arcsec. Photometric flux calibration was done by observing a standard star in the AS 13 region (Hunt et al. (1998)). Data reduction was done using the Image reduction and Analysis Facility (IRAF) software. The dark-subtracted and background-subtracted images were co-added to obtain the final image in each band. The photometric magnitudes of V1647 Ori were then found using the task APPHOT in IRAF. The magnitude of extended sources such as HH22 was also estimated using a larger sampling aperture (usually 4 times the FWHM of a star image). The integrated magnitude of the nebula surrounding V1647 Ori was estimated from the star-subtracted images using a 40 arcsec aperture. K band spectroscopic observations were made using the NICMOS array at a spectral solution of 1000. The integration time for the spectra was 60s per frame. Spectral reduction was done using standard spectroscopic tasks in IRAF. For sky background subtraction, a set of at least two spectra were taken with the object dithered to two different positions along the slit. The sky-subtracted spectra were then co-added resulting in a total exposure time of 480s. The atmospheric OH vibration-rotation lines were used for wavelength calibration. The spectra of V1647 Ori was then ratioed with that of a spectroscopic standard star of AOV type, observed at a similar airmass, to remove the telluric absorption features. Prior to ratioing, the HI absorption lines from the standard star spectra were removed by interpolation. The ratioed spectra were then multiplied by a blackbody curve at the effective temperature of the standard star to yield the final spectra. The observed K band photometric flux of V1647 Ori was used for flux calibration of the spectra.
3 Results and Discussion
3.1 Photometry
Table 1 gives the JHK magnitudes and colors for all the dates of our observations. The photometric errors are typically 0.02 to 0.05 magnitudes. For the on-going 2008 outburst period (observations from Nov 2008 till Nov 2012), the average magnitudes with standard deviation () for 29 data sets are: 10.85 (0.17); 9.02 (0.18); 7.60 (0.24) for the J, H, and K bands respectively. Occasional deviations of more than 3 due to variability of object were noticed in all the three bands. For the 2004 outburst period (observations from Mar 2004 till Dec 2004) the averages for 7 data sets are: 11.01 (0.16); 9.06 (0.17); 7.73 (0.15) for the J, H, and K bands respectively; the deviations were within 2. For the quiescent phase during 2006-2007 (observations from Dec 2005 till Dec 2006): the averages for 8 data sets are : 14.2 (0.18); 11.61 (0.14); 9.89 (0.18) for the J, H, and K bands respectively; the occasional deviations seen were within 2. Thus the on-going outburst shows higher amplitude fluctuations in brightness especially in K band (more than 0.5 mag) than the 2004-2005 outburst. The light curves in the J, H and K bands are shown in Fig 1 covering the period between 2004-2012. For comparison, a few data points from other published work are also shown (from Peregrine et al. (2004), Ojha et al. (2006), Acosta-Pulido et al. (2007), and Aspin (2011)). It may be mentioned here that Acosta-Pulido et al. (2007) reported a 56 day periodic component in their optical light curves in the visible bands. Our JHK data do not clearly show this component.
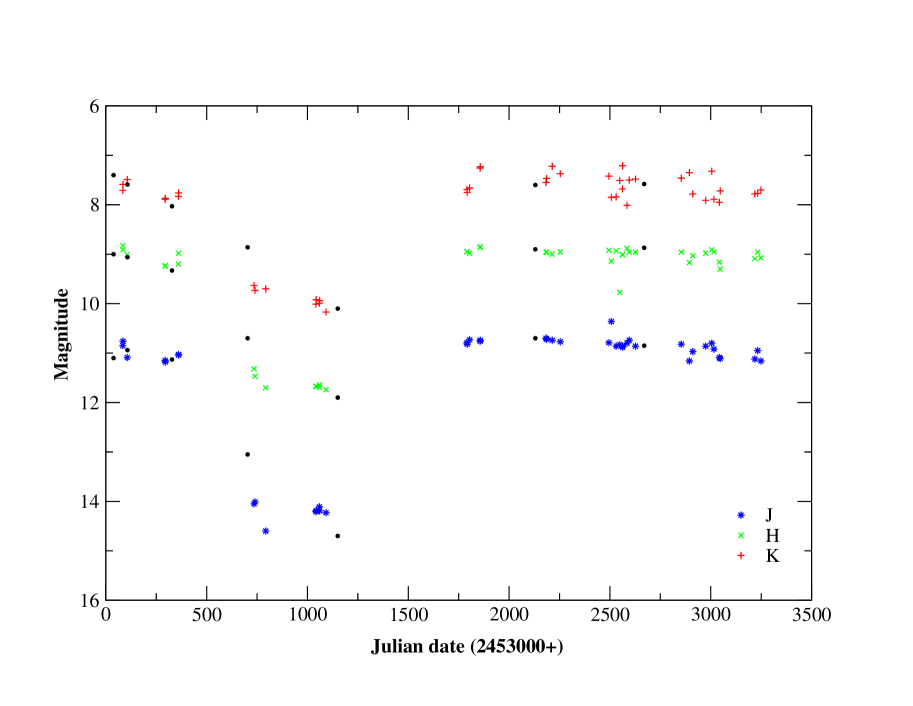
Trend of decline of Outburst phase since early 2012: In comparison with its behavior till 2011 (e.g., Venkat & Anandarao (2011)), the object seems to show a steady decline in the brightness beginning from Feb-Mar 2012 (cf. Semkov & Peneva (2012), & Ninan et al. (2012)) with an approximate rate of 0.16, 0.06, 0.18 mag per year in the JHK bands respectively (see Fig 1). It is necessary to confirm this declining trend by continued monitoring. The slow decline compared to the one noticed in the 2004 outburst is reminiscent of a typical FUors light curve. But it is premature to conclude that it is a FUor; as there have been spectroscopic indications to the contrary. In fact it could be a class in itself which shows both FUors and EXors characteristic features (see Kun (2008)).
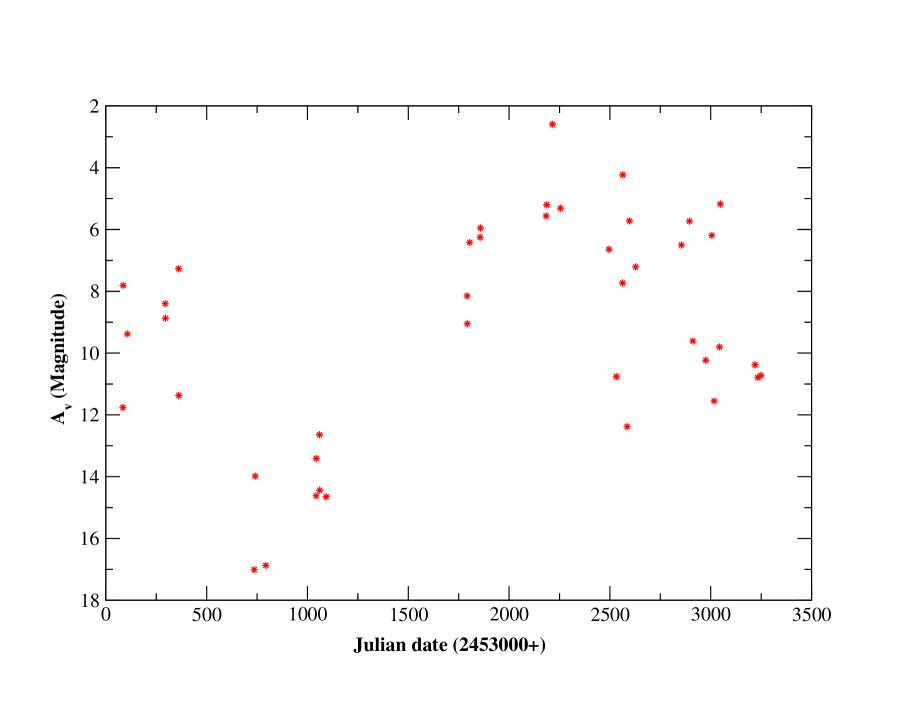
We have computed the visual extinction AV from the colors [J-H] and [H-K] for both the epochs, using the formula for T Tauri stars derived from Meyer et al. (1997) and the extiction model of Bessell & Brett (1988),
| (1) |
The computed AV values are listed in Table 1. For comparison, the AV corresponding to 2MASS epoch (quiescent on 1998 October 7) is 13.3. The time evolution of AV is shown in Fig 2. We find that there is 6 mag difference in AV between the two phases - the outburst phase having lower extinction. This can be attributed to the excess mass accreted by the envelope (from the environment) during the quiescent phase in comparison with the outburst phase during which the disk accretion (from the envelope) is expected to dominate (e.g., Aspin et al. (2008) and Aspin (2011)).
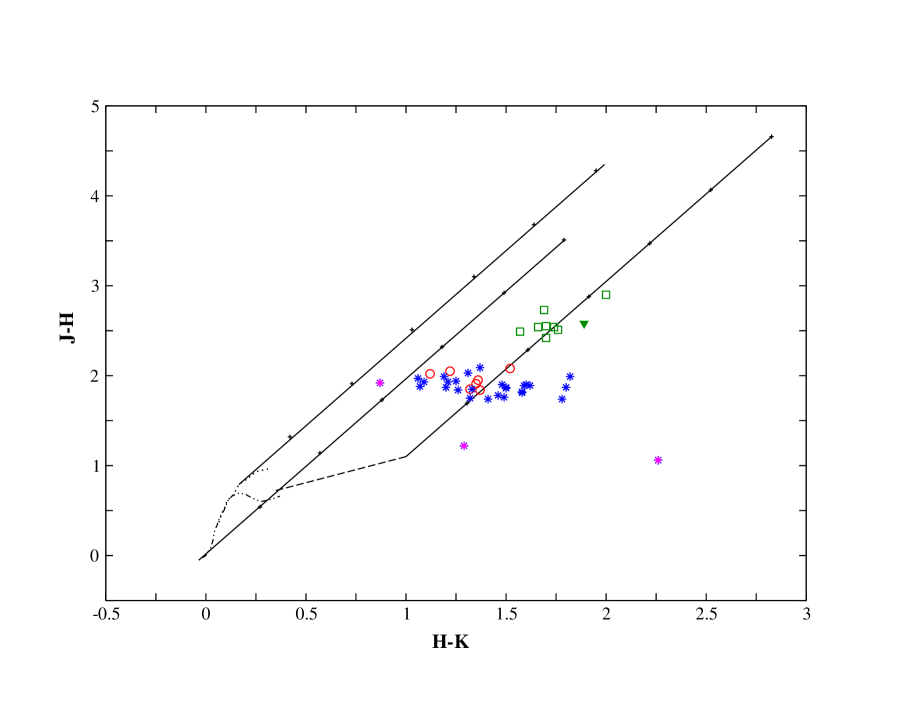
A JHK color-color diagram constructed from Mt Abu data during 2004-2012 is shown in Fig 3. The AV values computed using Eqn.(1) are in reasonable agreement (within 1 - 2 mag) with those obtained by de-reddening the JHK colors to the T Tauri locus in the color-color diagram. The color-color diagram demonstrates the variable nature of the source in the on-going 2008 outburst phase in comparison with the 2004 outburst. The region occupied by the latest outburst (asterisks in Fig 3) extends horizontally (i.e., with [J-H] 1.7-2.0) beyond the T Tauri region; quite in contrast with the 2004 outburst phase (open circles). This tendency during the on-going outburst indicates the presence of cold dust in the envelope/disk of the star compared to the 2004 outburst. Also, we found at least two occasions (in 2010 November 7 & 2010 December 19) on which the colors showed extreme values - as indicated by the magenta asterisks in Fig 3 at around [J-H] 1.0-1.2, with [H-K] at 1.3 and 2.3. On another occasion (2011 January 24) the colors indicate a position to the left of the T Tauri region. The AV could not be calculated for these cases falling well beyond the T Tauri regime (shown as dashes in Table 1). We suspect that such extreme fluctuations may be of short duration (a few days) and attributable to circumstellar dust temperature variation.
| Date | JD | J | H | K | J-H | H-K | AV |
|---|---|---|---|---|---|---|---|
| 2004Mar20 | 2453084.5 | 10.85 | 8.83 | 7.71 | 2.02 | 1.12 | 11.76 |
| 2004Mar21 | 2453085.5 | 10.76 | 8.91 | 7.59 | 1.85 | 1.32 | 7.81 |
| 2004Apr11 | 2453106.5 | 11.09 | 9.01 | 7.49 | 2.08 | 1.52 | 9.38 |
| 2004Oct16 | 2453294.5 | 11.15 | 9.24 | 7.89 | 1.91 | 1.35 | 8.40 |
| 2004Oct17 | 2453295.5 | 11.18 | 9.23 | 7.87 | 1.95 | 1.36 | 8.87 |
| 2004Dec21 | 2453360.5 | 11.04 | 9.20 | 7.83 | 1.84 | 1.37 | 7.27 |
| 2004Dec22 | 2453361.5 | 11.03 | 8.98 | 7.76 | 2.05 | 1.22 | 11.37 |
| 2005Dec31 | 2453735.5 | 14.05 | 11.32 | 9.63 | 2.73 | 1.69 | 17.01 |
| 2006Jan05 | 2453740.5 | 14.01 | 11.47 | 9.73 | 2.54 | 1.74 | 13.98 |
| 2006Feb27 | 2453793.5 | 14.60 | 11.70 | 9.70 | 2.90 | 2.00 | 16.87 |
| 2006Nov03 | 2454042.5 | 14.21 | 11.67 | 10.01 | 2.54 | 1.66 | 14.62 |
| 2006Nov04 | 2454043.5 | 14.19 | 11.68 | 9.92 | 2.51 | 1.76 | 13.41 |
| 2006Nov20 | 2454059.5 | 14.11 | 11.69 | 9.99 | 2.42 | 1.70 | 12.64 |
| 2006Nov21 | 2454060.5 | 14.19 | 11.64 | 9.94 | 2.55 | 1.70 | 14.44 |
| 2006Dec23 | 2454092.5 | 14.23 | 11.74 | 10.17 | 2.49 | 1.57 | 14.65 |
| 2008Nov21 | 2454791.5 | 10.79 | 8.95 | 7.69 | 1.84 | 1.26 | 8.15 |
| 2008Nov22 | 2454792.5 | 10.82 | 8.95 | 7.75 | 1.87 | 1.20 | 9.05 |
| 2008Dec04 | 2454804.5 | 10.73 | 8.98 | 7.66 | 1.75 | 1.32 | 6.42 |
| 2009Jan25 | 2454856.5 | 10.76 | 8.86 | 7.26 | 1.90 | 1.60 | 6.25 |
| 2009Jan26 | 2454857.5 | 10.74 | 8.85 | 7.23 | 1.89 | 1.62 | 5.95 |
| 2009Dec18 | 2455183.5 | 10.70 | 8.96 | 7.55 | 1.74 | 1.41 | 5.56 |
| 2009Dec21 | 2455186.5 | 10.72 | 8.96 | 7.47 | 1.76 | 1.49 | 5.20 |
| 2010Jan18 | 2455214.5 | 10.74 | 9.00 | 7.22 | 1.74 | 1.78 | — |
| 2010Feb27 | 2455254.5 | 10.77 | 8.95 | 7.37 | 1.82 | 1.58 | 5.31 |
| 2010Oct26 | 2455495.5 | 10.79 | 8.92 | 7.42 | 1.87 | 1.50 | 6.64 |
| 2010Nov07 | 2455507.5 | 10.36 | 9.14 | 7.85 | 1.22 | 1.29 | — |
| 2010Dec01 | 2455531.5 | 10.86 | 8.93 | 7.84 | 1.93 | 1.09 | 10.76 |
| 2010Dec19 | 2455549.5 | 10.83 | 9.77 | 7.51 | 1.06 | 2.26 | — |
| 2011Jan01 | 2455562.5 | 10.86 | 9.01 | 7.68 | 1.85 | 1.33 | 7.73 |
| 2011Jan02 | 2455563.5 | 10.88 | 9.01 | 7.21 | 1.87 | 1.80 | — |
| 2011Jan24 | 2455585.5 | 10.80 | 8.88 | 8.01 | 1.92 | 0.87 | — |
| 2011Feb04 | 2455596.5 | 10.74 | 8.96 | 7.50 | 1.78 | 1.46 | 5.72 |
| 2011Mar07 | 2455627.5 | 10.86 | 8.96 | 7.48 | 1.90 | 1.48 | 7.21 |
| 2011Oct20 | 2455854.5 | 10.82 | 8.96 | 7.46 | 1.86 | 1.50 | 6.50 |
| 2011Nov29 | 2455894.5 | 11.16 | 9.17 | 7.35 | 1.99 | 1.82 | — |
| 2011Dec16 | 2455911.5 | 10.97 | 9.03 | 7.78 | 1.94 | 1.25 | 9.61 |
| 2012Feb18 | 2455975.5 | 10.86 | 8.98 | 7.91 | 1.88 | 1.07 | 10.23 |
| 2012Mar19 | 2456005.5 | 10.80 | 8.91 | 7.32 | 1.89 | 1.59 | 6.19 |
| 2012Mar30 | 2456016.5 | 10.92 | 8.95 | 7.89 | 1.97 | 1.06 | 11.55 |
| 2012Apr26 | 2456043.5 | 11.09 | 9.16 | 7.95 | 1.93 | 1.21 | 9.80 |
| 2012Apr30 | 2456047.5 | 11.11 | 9.30 | 7.72 | 1.81 | 1.58 | 5.17 |
| 2012Oct19 | 2456219.5 | 11.12 | 9.09 | 7.78 | 2.03 | 1.31 | 10.38 |
| 2012Nov02 | 2456233.5 | 10.95 | 8.96 | 7.77 | 1.99 | 1.19 | 10.79 |
| 2012Nov18 | 2456249.5 | 11.16 | 9.07 | 7.70 | 2.09 | 1.37 | 10.72 |
3.2 Spectroscopic Variations
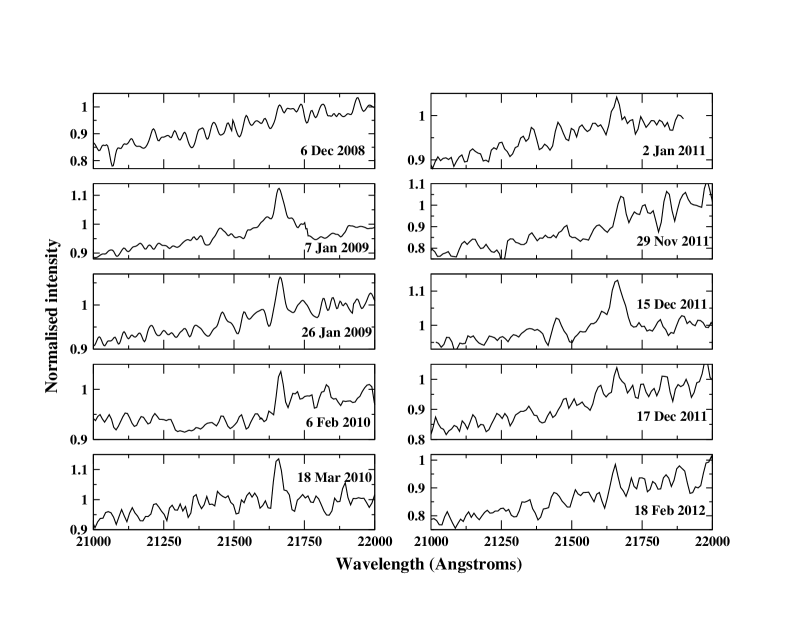
As may be seen in Fig 4, K band spectra taken at different times during the outburst phase show variability in Hydrogen Br indicating variable disk accretion rates. Br line shows fluctuating trend that does not seem to be associated with photometric fluctuations (cf. H line reported by Walter et al. (2004) and Aspin & Reipurth (2009)). Quanz et al. (2007) reported molecular line variability in the mid-IR region during the 2004 outburst. It may be noted that the width at zero-intensity and the ratio of peak to continuum intensity in Mt. Abu profiles are in reasonable agreement with those of Brittain et al. (2010) for the year 2009, in spite of the large differences in the resolving power employed and S/N values between the two observations. The accretion luminosities and disk accretion rates derived from the dereddened Br line fluxes from our spectra (following the procedure described by Muzerolle et al. (1998)) range from 20 - 60 L⊙ and 1.0 to 3.0M respectively which are comparable with those reported by Brittain et al. (2010).
3.3 Variations in HH22 and the nebula around V1647 Ori
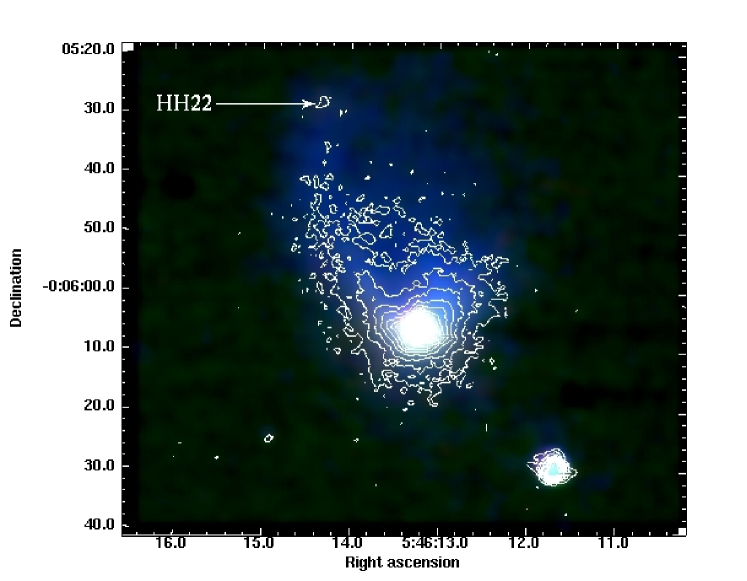
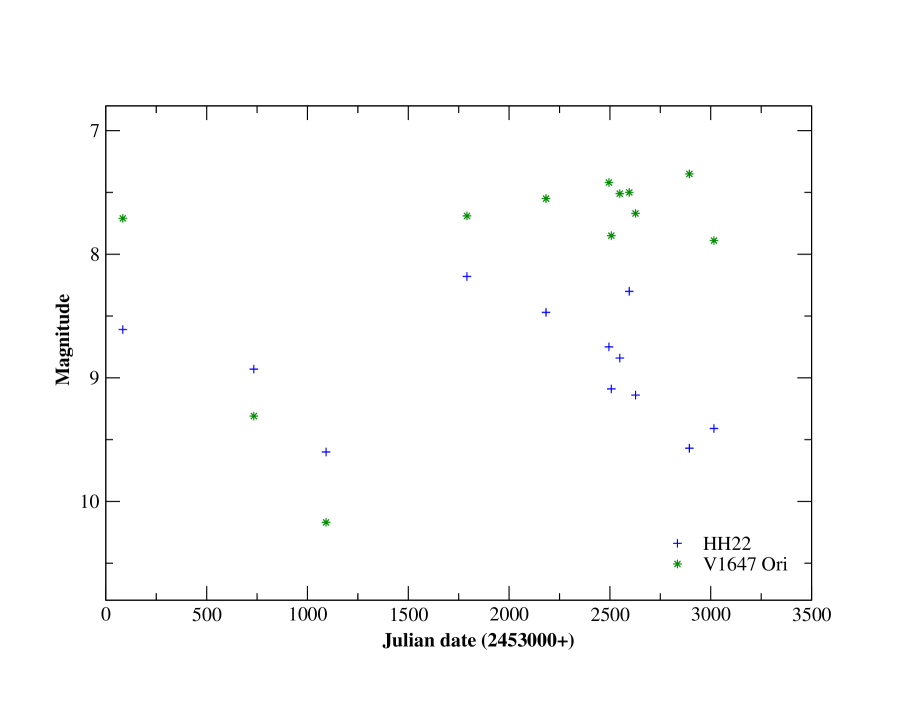
Fig 5 shows a JHK color composite image of V1647 Ori and its associated nebula taken from Mt Abu on 2011 February 04 using the NICS. Superposed on the image are the contours of iso-magnitudes in H band. The curved tail at the top left part of the nebular object is usually attributed to the on-going accretion (cf. Reipurth & Aspin (2004)). HH22 (knot A in Eisloffel & Mundt (1997)), seen nearly to the north of V1647 Ori (see Fig 5), is a Herbig-Haro type object (for mid-IR counterpart, see Muzerolle et al. (2005)). It happens to be present very close to V1647 Ori (30 arcsec of separation at an assumed distance of 0.40 kpc) and its originating source is not yet identified. It could possibly be a reflection nebulosity powered by V1647 Ori (see, Briceno et al. (2004) and Aspin et al. (2008)). It may be expected therefore that the outburst from V1647 Ori could cause the nebulosity to show a corresponding brightening. The light travel time from the YSO to HH22 is 70 days. We analyzed the images in JHK bands obtained from Mt Abu to see if HH22 shows any variability in its brightness. Fig 6 shows integrated K magnitude of HH22 with time along with V1647 Ori magnitudes. The plot indicates a possible correspondence of HH22 (knot A) with the outburst activity; as well as indication of trigger from even short term fluctuations from V1647 Ori. We also noticed fluctuations in the brightness of the nebula around V1647 Ori which typically follow those of V1647 Ori itself. Similar fluctuations were also noticed in the J and H bands.
| Physical Parameter | Quiescent Phase | Outburst Phase |
|---|---|---|
| Stellar Age (yr) | 4.82.5 | 6.33.1 |
| Star Mass (M⊙) | 0.340.15 | 4.440.34 |
| Star Temperature (T (K)) | 3360170 | 75601590 |
| Star Radius (R⊙) | 4.010.12 | 7.082.28 |
| Total Luminosity (L⊙) | 1.850.24 | 156.528.0 |
| Envelope Mass (M⊙) | 1.510.02 | 1.403.79 |
| Envelope Accretion Rate (M) | 5.30.1 | 3.70.0 |
| Disk Mass (M⊙) | 6.88.00 | 6.91.8 |
| Disk Accretion Rate (M) | 5.53.3 | 2.21.6 |
3.4 Modeling of Spectral Energy Distribution
Modeling the SED of V1647 Ori was done for three sets of data taken during : (i) the outburst phase 2004-2005; (ii) the quiescent phase 2006-2007 and (iii) the second (on-going) outburst phase 2008-2012. For each of these three phases the mean values of Mt Abu JHK magnitudes were considered. To the JHK data we added the visible, mid-infrared, far infrared and mm-wave data on quiescent and outburst epochs taken from Andrews et al. (2004) and Aspin et al. (2008). The SEDs given in Aspin et al. (2008) for the outburst and quiescent phases show that the fluxes of the PMS star in sub-mm and mm regions did not change more than 10% between the two phases. It is in the visible and infrared that a substantial change had taken place. The near-infrared region occurs right at the position of turn-over in the SED and hence is quite important. It was assumed that the small photometric variations, if present in the mid-infrared and far-infrared, are not significant in each phase. We used an on-line tool developed by Robitaille et al. (2007) for SED modeling. Using this tool, several authors have successfully modeled T Tauri stars and massive protostars with masses up to 25 M⊙ (e.g., Dewangan & Anandarao (2010)). The on-line tool selects the best-fit solutions from 20,000 models (each with 10 different angles of inclination for the accretion disk, making a total of 200,000 models). The input parameters include, apart from a minimum of three data points in SED and their corresponding errors, range of distances to the object and the visual extinction. The output parameters include stellar mass, temperature, radius, age and the total luminosity; as well as disk inclination angle, the disk and envelope masses and rates of accretion. In order to minimize the degeneracy of solutions, only those solutions that satisfy the criterion
| (2) |
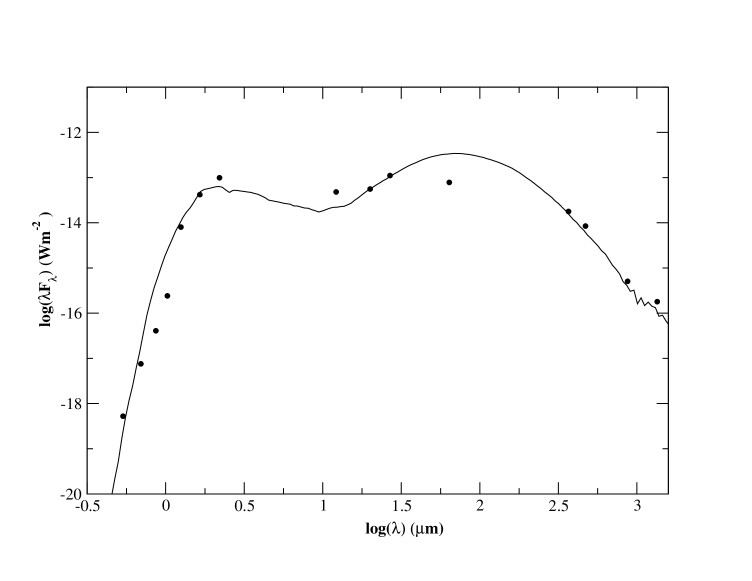
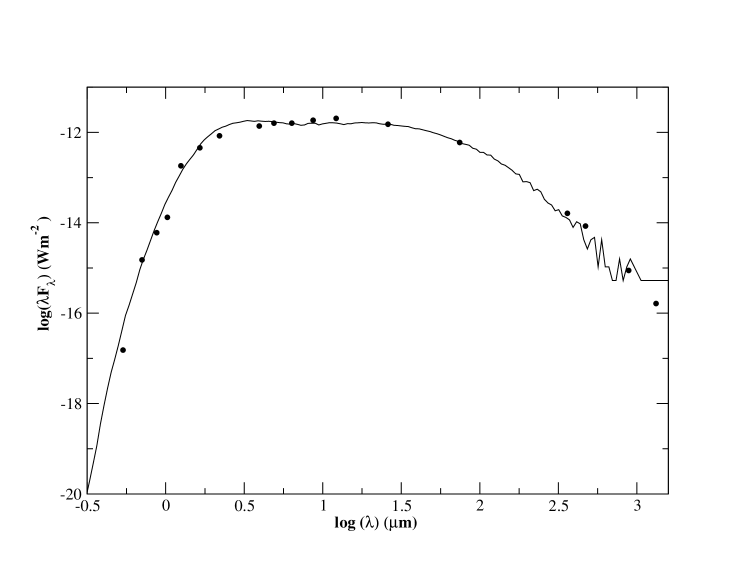
are chosen with considered per data point (see Robitaille et al. (2006)). Further, in order to avoid ‘over-interpretation’ of SEDs, we provided a small range of visual extinction values (from the JHK photometry) for each phase, to account for the inherent uncertainties in their determination. In the present case, a distance of 0.40 kpc is adopted (from Anthony-Twarog (1982)). The best fit models are displayed in Fig 7 along with the observed data (shown in filled circles) for the quiescent phase of 2006-2007 and the on-going outburst phase of 2008-2012.
Table 2 lists the mean values and standard deviations of physical parameters derived from the models for the two epochs. The model parameters for the outburst phase 2004-2005 match quite well with those of the on-going outburst phase of 2008-2012. In the quiescent phase one can notice the stellar parameters similar to those of a T Tauri star. But the outburst parameters mimic more of an intermediate mass star rather than a low mass PMS star. In the outburst phase the disk mass and accretion rate are enhanced substantially when compared to the quiescent phase. The envelope accretion rate decreases by more than an order of magnitude in the outburst phase compared to the quiescence while envelope mass decreases by several orders of magnitude. This may be due to the enhanced luminosity in the outburst phase which could prevent mass accretion from the envelope. In the quiescent phase, the envelope emission dominates in the mid-infrared and longer wavelength region; while in the outburst phase the disk emission contributes substantially in the region beyond 1 m.
It may be noted that the disk accretion rate for the outburst phase given in Table 2 matches well with those reported by Briceno et al. (2004), Aspin et al. (2008), Brittain et al. (2010) and Aspin (2011). However, the disk accretion rates in the quiescent phase derived from Br/Pa emission lines by Aspin et al. (2008) are much higher than the model-derived value reported here. While this could be due to uncertainties in the SED model or emission line method, the important point to be noted is that the disk accretion rate during the outburst phase is much larger than that in the quiescent period. The total luminosity obtained here (which includes the contributions from the star and its disk and envelope) matches well with those derived by Abraham et al. (2004) and Aspin et al. (2008) from the SEDs of the pre-outburst phase. The total outburst luminosity during the 2003 outburst as derived by Briceno et al. (2004) from the SED is 219 L⊙ which agrees well with that obtained from our model for the current on-going outburst. Earlier, using a simpler model, Muzerolle et al. (2005) interpreted the SPITZER IRAC/MIPS (photometric bands between 3.5-70 m) data for the pre- and post-outburst phases. Their results are qualitatively similar to ours.
4 Conclusions
The important conclusions of this work are:
-
1.
Monitoring of V1647 Ori in the JHK bands has shown that the object has been undergoing episodes of mass accretion variation as indicated by small but significant variations in its JHK fluxes. This conclusion is also supported by its near-infrared spectral variations;
-
2.
Starting from early 2012, the object seems to show a slow fading out with a rate of 0.06-0.18 mag per year. This may indicate that V1647 Ori is an intermediate type object falling between FUors and EXors, having characteristic features of both the proto-types;
-
3.
JHK color-color diagram indicates several occasions in the current, on-going outburst in which the star displays positions beyond the T Tauri region indicating the presence of colder dust compared to its 2004 outburst phase;
-
4.
The Herbig-Haro object HH22, whose as yet unidentified energizing YSO is situated at about 30 arcsec from V1647 Ori seems to show light fluctuations corresponding to those of the latter, thereby confirming that it is a reflection nebulosity triggered by the YSO;
-
5.
The spectral energy distributions of V1647 Ori modeled for the epochs of quiescence and outburst, show that the disk mass and accretion rate in the outburst phase are significantly greater than that in the quiescent stage, while the envelope mass and accretion rates are much lower.
acknowledgments
The research work at PRL is supported by the Department of Space, Government of India. It is a pleasure to thank the Mt Abu Observatory staff for their cooperation in making observations. We gratefully acknowledge using the SEDFIT online software developed by Robitaille et al (2007). We thank the anonymous reviewer for useful comments.
References
- Abraham et al. (2004) Abraham, P., Kospal, A., Csizmadia, Sz., et al. 2004, A&A, 419, L39
- Acosta-Pulido et al. (2007) Acosta-Pulido, J. A., Kun, M., Abraham, P., et al. 2007, AJ, 133, 2020
- Andrews et al. (2004) Andrews, S. M., Rothberg, B., & Simon, T. 2004, ApJ, 610, L45
- Anthony-Twarog (1982) Anthony-Twarog, B. J. 1982, AJ, 87, 1213
- Aspin (2011) Aspin, C. 2011, AJ, 142, 135
- Aspin et al. (2008) Aspin, C., Beck, T. L., & Reipurth, B. 2008, AJ, 135, 423
- Aspin & Reipurth (2009) Aspin C., & Reipurth, B. 2009, AJ, 138, 1137
- Bell et al. (1995) Bell, K. R., Lin, D. .N. C., Hartmann, L. W., & Kenyon, S. J. 1995, ApJ, 444, 376
- Bessell & Brett (1988) Bessell M. S., & Brett J. M. 1988, PASP, 100, 1134
- Bonnell & Bastein (1992) Bonnell I., & Bastien P. 1992, ApJ, 401, L31
- Briceno et al. (2004) Briceno, C., Vivas, A. K., Hernandez, J., et al. 2004, ApJ, 606, L123
- Brittain et al. (2010) Brittain, S. D., Rettig T. W., Simon, T., et al. 2010, ApJ, 708, 109
- Dewangan & Anandarao (2010) Dewangan, L. K., & Anandarao B. G., 2010, MNRAS, 402, 2583
- Eisloffel & Mundt (1997) Eisloffel, J., & Mundt R. 1997, AJ, 114, 280
- Hartmann & Kenyon (1985) Hartmann, L. W., & Kenyon S. J. 1985, ApJ, 299, 462
- Hartmann & Kenyon (1996) Hartmann, L. W., & Kenyon S. J. 1996, ARA&A, 34, 207
- Herbig (1977) Herbig, G. H. 1977, ApJ, 217, 693
- Hunt et al. (1998) Hunt, L. K., Mannucci, F., Testi, L., et al. 1998, AJ, 115, 2594
- Kun (2008) Kun, M. 2008, IBVS, 5850, 1
- McNeil (2004) McNeil J. W. 2004, IAUC, 8284
- Meyer et al. (1997) Meyer M. R., Calvet N. and Hillenbrand L. A. 1997, AJ, 114, 288
- Muzerolle et al. (1998) Muzerolle, J., Hartmann, L., Calvet, N., 1998, AJ, 116, 2965
- Muzerolle et al. (2005) Muzerolle, J., Megeath, S. T., Flaherty, K. M., et al. 2005, ApJ, 620, L107
- Ninan et al. (2012) Ninan, J. P.,Ojha, D. K., Mallick, K. K., et al. 2012, CBET, 3164, 1
- Ojha et al. (2006) Ojha, D. K., Ghosh, S. K., Tej, A., et al. 2006, MNRAS, 368, 825
- Peregrine et al. (2004) Peregrine, M. M., Allyn, J. S., Arne, A. A., et al. 2004, ApJ, 616, 1058
- Quanz et al. (2007) Quanz, S. P., Henning, Th., Bouwman, J., et al. 2007, ApJ, 668, 359
- Reipurth & Aspin (2004) Reipurth, B., & Aspin, C. 2004, ApJ, 606, L119
- Robitaille et al. (2006) Robitaille T. P., Whitney B. A., Indebetouw R., et al. 2006, ApJS, 167, 256
- Robitaille et al. (2007) Robitaille, T. P., Whitney B. A., Indebetouw R., & Wood K. 2007, ApJS, 169, 328
- Semkov & Peneva (2012) Semkov, E. H., Peneva, S. P. 2012, IBVS, 6025, 1
- Stahler & Palla (2004) Stahler, S. W., & Palla, F. 2004, The Formation of Stars, (1st ed.; Weinheim: Wiley-VCH Verlag)
- Venkat & Anandarao (2011) Venkat, V., & Anandarao, B. G. 2011, CBET, 2647, 1
- Walter et al. (2004) Walter, F. M., Stringfellow,, G. S., Sherry, W. H., & Field-Pollatou, A. 2004, AJ, 128, 1872