Rotation in NGC 2264: a study based on CoRoT††thanks: The CoRoT space mission, launched on 2006 December 27, was developed and is operated by the CNES, with participation of the Science Programs of ESA, ESA’s RSSD, Austria, Belgium, Brazil, Germany and Spain photometric observations
Abstract
Rotation is one of the key stellar parameters which undergo substantial evolution during the stellar lifetime, in particular during the early stages.
Stellar rotational periods can be determined on the basis of the periodic modulation of starlight produced by non-uniformities on the surface of the stars, due to manifestation of stellar activity. We present the results of an extensive search for rotational periods among NGC 2264 cluster members, based on photometric monitoring using the CoRoT satellite, with a particular
attention to the distribution of classical and weak-line T-Tauri stars. NGC 2264 is one of the nearest and best studied star forming region in the solar neighbourhood, with an estimated age of 3 Myr, and is the object of a recent simultaneous multiband campaign
including a new CoRoT observation with the aim to assess the physical origin of the observed variability. We find that the rotational distributions of classical and weak-line T-Tauri star are different, suggesting a difference in the rotational properties of accreting and non-accreting stars.
keywords:
clusters: NGC 2264 – stars: rotation – stars: pre-main sequence.1 Introduction
In the last years, the determination of stellar rotation rates for large samples of stars with different masses and ages in young open clusters, has made substantial progress, providing a large observational sampling of the angular momentum evolution of pre-main sequence
stars (Bouvier 2008, 2009). The precise mechanisms governing angular momentum evolution of pre-main sequence low-mass stars are still not well understood, but basically they can be schematized with two main competing processes: star contraction and star-disk interaction.
Stars in the pre-main sequence phase are still contracting, thus increasing their angular velocity to conserve the angular momentum.
On the other hand, the observed existence of slow rotators and of a wide dispersion in rotation rates of cluster stars on the zero-age main sequence (ZAMS), can be explained only with the presence of a competing mechanism of angular momentum loss (i.e. spin down of the star),
different from star to star, during the pre-main sequence phase. It is generally believed that this mechanism can be explained by the magnetic interaction between stellar magnetospheres
and circumstellar disks, in a scenario known as disk-locking, first proposed by Camenzind (1990) and Koenigl (1991) and explained in detail by
Shu et al. (1994), which assumes that the angular momentum deposited on an accreting star (due to mass accretion from disk to star,
Edwards et al. 1993) is exactly removed by torques carried along magnetic field lines connecting the star to the disk.
The wide dispersion of rotational velocities observed on the ZAMS is the result of different disk lifetimes (Bouvier et al. 1993; Collier Cameron et al. 1995).
Several observational results indicate a relation between the presence of disks and rotational evolution, in particular population of stars with
disks, on average, rotate more slowly than those without disks and does exist a statistically significant anti-correlation between angular velocity and disk indicators such as
near-infrared excess and equivalent width (Edwards et al. 1993; Bouvier et al. 1993; Herbst et al. 2000; Herbst et al. 2002; Lamm et al. 2005; Rebull et al. 2006). Moreover,
the disk-locking scenario predicts that the torques arising from the magnetic connection between the star and the disk remove substantial angular
momentum enforcing an equilibrium angular spin rate (Choi & Herbst 1996) which is in agreement with the constant rotation period in the 2-8 days range,
characteristic of the majority of young stars. However, there have been several conflicting theoretical and observational evidences concerning the role of
disk-locking scenario in the evolution of low mass pre-main sequence stars.
Dahm & Simon (2005) pointed out that the Prot distribution histograms for weak T-Tauri stars (WTTSs, whose periodic variability is believed to be induced by large starspots)
and classical T-Tauri stars (CTTSs, whose variability may be also due to accretion spots and shadowing of the photosphere from dusty disk structures) in NGC 2264 are very similar and do not
indicate that CTTSs are rotating more slowly than their WTTS counterparts. Furthermore, Dahm & Simon (2005) did not find a correlation between Prot and
theoretical age, as might be expected if stars were spinning up after decoupling from their disks. Stassun et al. (1999) and Cieza & Baliber (2006) did not find a
correlation between accretion and rotation in ONC and IC 348 low mass stars, respectively (though they do not conclude that their results are inconsistent
with disk-locking). We have to note
that most of the samples for which there is no clear evidence of a connection between the existence of disks and slow rotation, suffer from several
biases, such as small sample size, sample biased toward small-mass or high-mass stars, the use of NIR photometry as disk indicator or the use of values instead of rotation periods, which make them unsuited to perform this kind of test, on star-disk interaction outcomes. In particular, the presence of a near-infrared
excess does not garantee that the star is actually accreting mass from a disk.
The studies of Cieza & Baliber (2007) and Rebull et al. (2005), based on Spitzer mid-infrared observations, however, as well as demonstrating that objects which currently show mid-infrared excesses
are more likely accreting than not, also found differences in the rotational properties of accreting and non accreting stars for NGC
2264 and the Orion Nebula Cluster (ONC), respectively, and represent the best test case to date, providing the strongest evidence that star-disk interaction regulates the angular
momentum evolution of pre-main sequence stars.
The idea and the basic assumptions of disk-locking, sketched above,
are a simplification of a much more complex phenomenon, and indeed several discussions on the shortcomings of the theory and its confrontation with
observations have been put forward. In particular, Matt et al. (2010, 2012) critically examined the theory of disk locking, noting that the
differential rotation between the star and disk naturally leads to an opening (i.e., disconnecting) of the magnetic field between the two.
They find that this significantly reduces the spin-down torque on the star by the disk, thus, disk-locking cannot account (at least, alone) for the slow rotation
observed in several systems and for which the model was originally developed. Matt et al. (2010, 2012) supported the idea that stellar winds may be
important during the accretion phase, they may be powered by the accretion process itself and be the key driver of angular momentum loss (Hartmann & MacGregor 1982;
Paatz & Camenzind 1996; Matt & Pudritz 2005). A strong magnetically driven wind, as proposed by Matt & Pudritz (2005), is an idea which deserves further study, as well as
the development of a more realistic theorical model able to explain the full range of observed rotation periods and magnetic phenomena and the achievement of a sufficient amount of accurate data to empirically constrain
them.
NGC 2264 is one of the best known studied star forming regions in the solar vicinity (d 760 pc, age 3 Myr) and is considered a benchmark for the study of star formation processes in our Galaxy.
NGC 2264 luckily falls in the small portion of the sky accessible by CoRoT (COnvection ROtation and planetary Transits, 2006), and thus
represents a unique chance for the mission and the study of young stars still in a formation phase.
Its distance and age make it an ideal CoRoT target, its size is well suited to the CoRoT field of view, with a large fraction of cluster members falling in the appropriate magnitude range for accurate photometric monitoring in the CoRoT observations.
NGC 2264 has been extensively observed at all wavelengths from radio to X-rays (see Dahm 2008, for a review on the region), for studies of the star formation process through the observation of its outcomes: the Initial Mass Function (e.g. Sung et al. 2008),
the star formation history, and the spatial structure (e.g. Teixeira et al. 2006; Sung et al. 2009). NGC 2264 is also a primary target for the study of the evolution of the stellar angular momentum and its relation to circumstellar accretion (e.g. Lamm et al. 2005), of the evolution (and dispersal)
of circumstellar disks (e.g. Alencar et al. 2010) and of the correlation between optical and X-ray variability of young stars (Flaccomio et al. 2010).
Among several optical, IR, and X-ray surveys, both photometric and spectroscopic, on NGC 2264, the most recent are: Sung et al. (2008), who has provided the widest area and deepest publicy available optical photometry; Sung et al. (2009), who has published Spitzer (IRAC + MIPS) photometry; Rebull et al. (2002)
and Dahm & Simon (2005), who have published spectral types, H, and Li equivalent widths, from low-dispersion spectra, for a total of 500 members; Fűrész et al. (2006), who has published radial velocities for 436 stars.
Lamm et al. (2004) performed a photometric monitoring of about 10600 stars to search for
periodic and irregular variable pre-main sequence stars and found 543 periodic variables with periods between 0.2 days and 15 days, and 484 irregular variables. Lamm et al. (2005) used this extensive study to conclude that the period distribution in NGC 2264 is similar to that of
the Orion Nebula Cluster, though shifted toward shorter periods (confirming the conclusion of Soderblom et al. 1999, based on the analysis of the rotation rates of 35 candidate members, that the stars in NGC 2264 are spun up with respect to members of the Orion Nebula Cluster).
The period distribution found by Lamm et al. (2005) is unimodal for masses lower than 0.25 M⊙ while it is bimodal for more massive stars. Lamm et al. (2005) also found evidence for disk locking with a constant period, among 30% of the higher mass stars (with a locking period of 8 days),
while disk-locking is less important among lower mass stars, whose peak in the period distribution at 2-3 days, suggests that these stars have undergone a low rate of angular momentum loss from star-disk interaction, while not completely locked (an evolution scenario defined by Lamm et al. (2005) as “moderate” angular momentum loss).
The bimodality is interpreted as an effect of disk-star interactions in pre-main sequence stars, slow rotators being interpreted as stars that are magnetically locked to their disks, preventing them from spinning up with time and accounting for the broad period distribution
of ZAMS stars. This assumption is supported by some observational results showing that WTTSs are rotating faster than CTTSs with inner disks (Edwards et al. 1993; Bouvier et al. 1993). Nevertheless, the hypothesis that accreting stars rotate more slowly than non accreting
ones is still a matter of debate, since conflicting evidence exists (see e.g. Lamm et al. 2005; Dahm & Simon 2005; Rebull et al. 2005, 2006;
Stassun et al. 1999; Cieza & Baliber 2006, 2007), as explained above.
The CoRoT satellite has allowed us to conduct a large scale survey of photometric variability of NGC 2264. Thanks to the accurate high-cadence photometry and large field of view of CoRoT, we could study rotation and activity of about 8000 stars in a 3.4 sq.degree region. The entire star-forming region fits into a single CoRoT field of view,
and the campaign resulted in continuous 23-day light curves for 301 known cluster members brighter than V 16 (M=0.3-0.4 M⊙). The resulting optical broad-band light curves are the first accurate, highest cadence (32 or 512 seconds), longest duration, data set available for 3 Myr old stars.
So far, the CoRoT NGC 2264
data have been used to study the correlation between optical and X-ray variability in young stars (Flaccomio et al. 2010); asteroseismological properties of two high mass cluster members (Zwintz et al. 2011); and to identify and study the behaviour of NGC 2264 members that are AA Tau-like (Alencar et al. 2010).
Alencar et al. (2010) demonstrated that the peculiar
photometric behaviour of AA Tau, which consist in a flat maximum in the light curve interrupted by deep quasi-periodical minima (due to obscuring material with a variable structure which is located in the inner disk region, near the corotation radius), that vary in depth and width from one rotational cycle to the other, is quite common among CTTSs (Bouvier et al. 1999, 2003;
Ménard et al. 2003; Bouvier et al. 2007; Grosso et al. 2007). The interpretation for AA Tau can now be considered quite solid, and it’s extension to an high fraction of CTTSs simply requires that the size of the obscuring clump of material (e.g. the height of the inner disk warp) is larger than previously thought.
In a rather similar scenario of circumstellar material orbiting the star and consequent time-variable shading, Flaccomio et al. (2010) found
evidence of a correlation between soft X-ray and optical variability of CTTSs (no correlation is apparent in the hard band), while no
correlation in either band (soft and hard) is present in WTTSs. Flaccomio et al. (2010) suggested that this observation is consistent with a
scenario in which a significant fraction of the X-ray and optical emission from CTTSs is affected by temporally variable shading and
obscuration.
The conclusions of both Alencar et al. (2010) and Flaccomio et al. (2010) point toward a different origin of the observed periods, suggesting a difference both in the physical and morphological properties of CTTSs and WTTSs.
In this paper we derive accurate rotational periods of known NGC 2264 members, testing
whether a relationship between accretion and rotation exists in pre-main sequence stars.
In the following we describe the observational and data reduction strategy (Sect. 2 and 3). In Section 4 we discuss the results obtained, and our major conclusions are summarized in Sect. 5.

2 CoRoT observations
The first short run CoRoT observations (SRa01, P.I. F.Favata) lasted from March 7 to March 31, 2008 (23 days) and was devoted to the observation of the very young ( 3 Myr) stellar open cluster NGC 2264, which covers most of the mass sequence from 3 to
0.1 M⊙.
A total of 8150 stars were observed, with right ascension (RA) between 99.4∘ and 100.9∘ and
declination (DEC) between 7.6∘ and 10.3∘ and R magnitudes from 9.2
to 16.0. The sample includes 301 cluster members (see Sec. 3 for details regarding membership criteria). We used the so called N2 data delivered by the CoRoT pipeline (Samadi et al. 2007) after correction of the electronic offset, gain, electromagnetic interference, and outliers. The pipeline includes background subtraction and partial jitter
correction. Low quality data points, e.g. taken during the South Atlantic Anomaly crossing or due to hot pixels events, are flagged. Some of the stars have light curves in three separate but ill-defined bands (red, green, and blue). In these cases our analysis was conducted on the white-light data obtained by summing the three bands. The light curves are sampled at a rate of 512 s or oversampled at 32 s. All the light curves presented here were rebinned to 512 sec.
Using CoRoT photometry we are able to reveal luminosity
variation, with a precision down to 0.1 mmag per hour (magnitude between 11 and 16), during continuous observations, allowing to measure photometric periods also in relatively quiet stars (for comparison, the luminosity
variations of the Sun range between 0.3 mmag and 0.07 mmag at maximum and minimum activity, respectively, 2004).

3 Sample extraction and light curve analysis
We selected 301 cluster stars (whose spatial distribution is shown in Fig. 1 as big dots) satisfying one or more of the following membership criteria (the number of objects which fulfill the various criteria is indicated near each criterium):
- •
- •
-
•
H with spectroscopic equivalent width greater than 10 Å and/or indicated to be in strong emission by Fűrész et al. (2006) (86);
-
•
Classified as Class I or Class II according to Sung et al. (2009), based on Spitzer mIR photometry (76);
-
•
Strong optical variability + high H emission, indicative of high chromospheric activity, according to Lamm et al. (2004) (87);
-
•
Radial velocity members according to Fűrész et al. (2006) (192).
After selecting the cluster members, we classified them as CTTSs if their H equivalent width was greater than 10 Å, and WTTSs
if smaller than 5 Å. The threshold between these two classes is a function of spectral type, as suggested by Martín (1998) and deeply analyzed by
(2003). The information regarding the H equivalent width are available from the work of Dahm & Simon (2005) for 164
members, 86 with EWHα 5 Å, 19 with EWHα between 5 and 10 Å and 59 with EWHα 10 Å.
We decided to exclude intermediate EWs (5 EWHα 10 Å), though not a usual procedure when dealing with H, to keep the two sample of CTTSs and WTTSs well separate and thus avoid possible ambiguity in the classification.
In Fig. 2 we show the V vs. (V-I) colour-magnitude diagram for the 8150 stars in the SRa01 observations with isochrones from Siess et al. (1997) (transformed to the observational plane using the Kenyon & Hartmann 1995 compilation), together with the NGC 2264 members.
We have analyzed the CoRoT light curves (LCs) as in Affer et al. (2012), we refer the reader to this work for a full
description of data reduction and analysis. In brief, we prepared the light curves by correcting the following systematic effects: spurious data points (mainly due
to cosmic rays and/or to the satellite crossing of the South Atlantic anomaly), as flagged by the reduction pipeline were removed; we rebinned the data to two
hours to smooth out the orbital period of the satellite (1.7 h); spurious long period trends (due to pointing and instrumental drift) were removed by fitting a third degree polynomial to the data and then dividing the original data points by this function.


The presence of periodic signals was detected using the Lomb Normalized Periodogram (LNP) technique
(Scargle 1982, Horne & Baliunas 1986). With this algorithm we calculated the normalized power as function of
angular frequency and identified the location of the highest peak in the
periodogram. In order to decide the significance of the peak we have followed (1995),
randomizing the temporal bins from the original light curve. By calculating the maximum power on a large number of randomized data sets, the conversion
from power to False Alarm Probability (FAP) can be determined. In detail,
we constructed 1000 light curves resampled from the original ones randomizing the position of blocks of adjacent
temporal bins (block length, 12 h) (e.g. 2005). By shuffling the data we break any possible time correlation and periodicity of the light curve on time scales longer
than the block duration. We calculated the Scargle periodogram for all the randomized light curves and
we compared the maximum from the real periodogram to the distribution obtained from the
randomized light curves, at the same frequency, in order to establish the probability that values as high as the observed
one are due to random fluctuations. Given some threshold FAP∗ we state that the detected candidate
periodicity is statistically not significant if FAP FAP∗. The calculation we performed on CoRoT light curves led often to small FAPs,
indicating that LNPs of our light curves present peaks that in most cases cannot be explained by pure stochastic noise, or non-periodic variability on time scales shorter than 12 h.
In fact, if light curves present variations on time scale smaller than the size of the temporal block we used in the simulations, these variations will be
still present in the simulated curves and will be not recognized as significant (more details in Affer et al. 2012). We
have chosen a bin size of 12 h as a reasonable compromise between the expected time scale of stochastic variations and the shortest expected
periodic signal.
Once significant peaks (at FAP 1%; since we simulated 1000 light curves, the 1% FAP power is the power that was exceeded by the highest peak
in 10 simulations) were determined from the LNPs, we also used an autocorrelation analysis (Box & Jenkins, 1976) to validate the periodicity of the LCs and to eliminate or correct spurious periods due to aliasing effects (in 5% of the cases, with a 95% confidence interval) or residual effects due to the choice of temporal blocks used in the LCs’ simulations (block lenght, 12 h).
Autocorrelation takes each point of the light curve measured at time and compares the value of that point
to another at time . Points separated by will have very similar values if the data contained some variability with period
, thus the autocorrelation function will have peaks corresponding to periods of variability in the data. The
autocorrelation of a sample population X as a
function of the lag is:
where is the mean of the sample population X and N is the sample size, the
quantity is called the autocorrelation coefficient at lag . The correlogram for a time series
is a plot of the autocorrelation coefficients as a function of L. A time series
is random if it consists of a series of independent observations with the same distribution. In this case we would expect the
to be statistically not significant for all values of .
We have chosen to adopt a 95% confidence level to select significant autocorrelation coefficient.


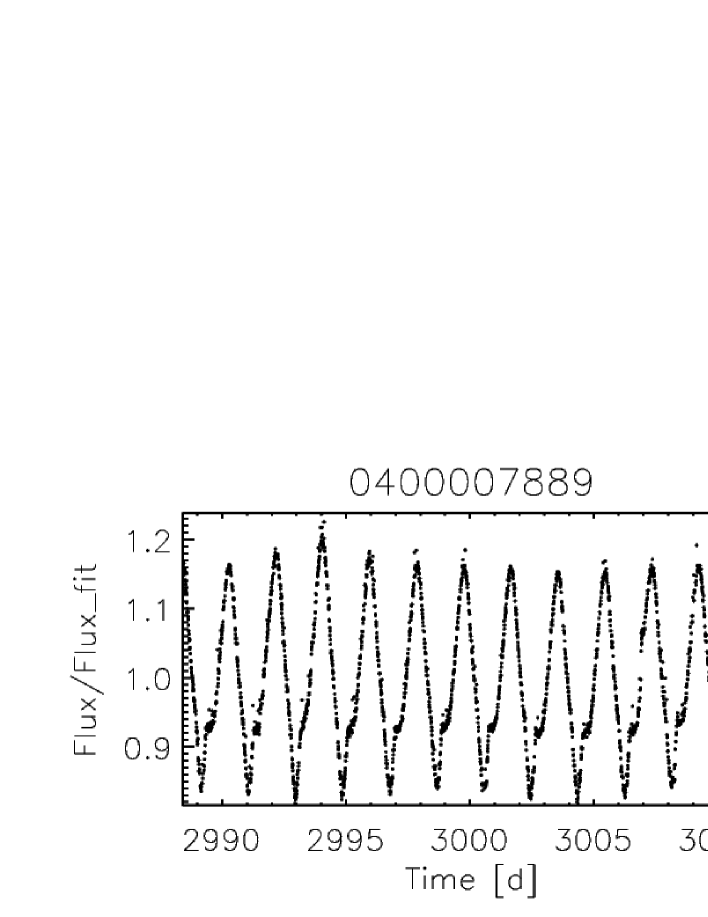
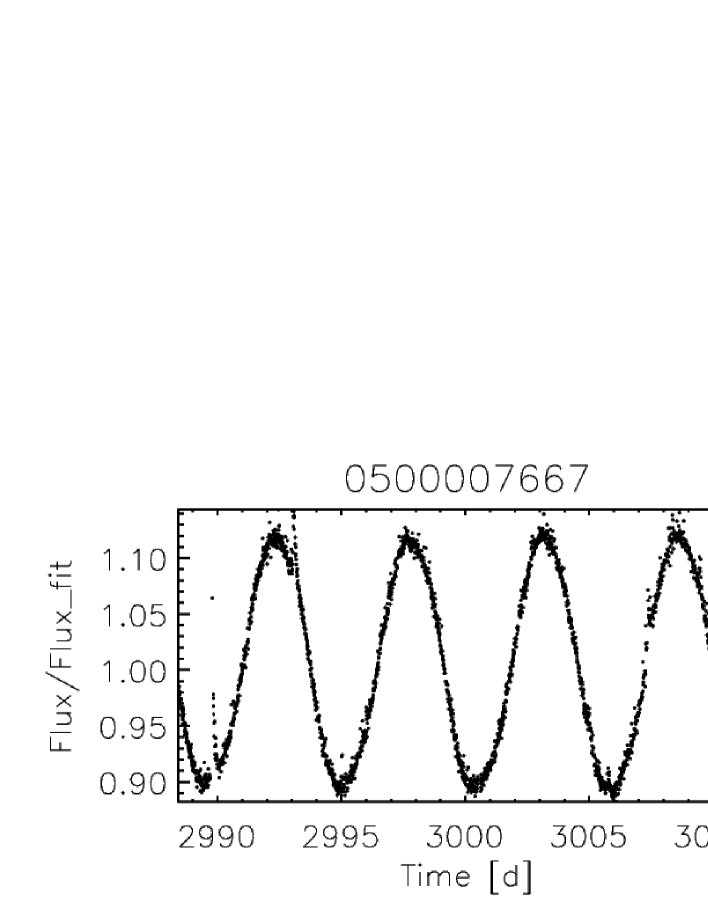
Following Alencar et al. (2010), morphologically we can divide the LCs in four groups: 1) spot-like periodic LCs, whose periodicity can be interpreted as rotational modulation of surface features such as cool and/or hot spots (Fig. 3, top left panel); 2) AA Tau-like systems, whose quasi-periodicity is likely caused by the obscuration of the stellar photosphere by circumstellar disk material (Fig. 3, top right panel), the stability of the spot-like LCs on the timescale of the observations, makes them easily distinguishable from the AA Tau-like ones; 3) irregular LCs, whose non-periodic brightness modulations (some of them with peak-to-peak variations up to 1 mag) are probably due to a complex mixing of non-steady accretion phenomena, and obscuration by non-uniformly distributed circumstellar material, as suggested by Alencar et al. (2010) (Fig. 3, bottom left panel); 4) non-variable LCs which do not display an obvious periodicity, most of
which looks like noisy LCs with small variability amplitude 1% (Fig. 3, bottom right panel).
To evaluate a short term variability amplitude of the LC, we
calculated the running median flux, obtained using a temporal bin set up by 15 time points (thus, a time scale of 15512 s), we calculated for each time
value the difference between the instantaneous flux and the running median flux derived at the corrisponding time, obtaining an array. We measured the amplitude variation of the LC as the
difference between the maximum and the minimum values of this array. We found that the variability amplitude range
is 2% to 171% for CTTSs and 1.0% to 38% for WTTSs in our sample. In Fig. 4 we show the results of the complete analysis for two LCs, one belonging to a CTTS and the other to a WTTS.
| Samples | Spot-like | AA-Tau like | Irregular | Non-periodic | CII | CIII |
|---|---|---|---|---|---|---|
| 301 members | 189 | 20 | 45 | 47 | 42 | 114 |
| 164/301 | ||||||
| (with ) | ||||||
| 59 CTTS | 23 | 12 | 23 | 1 | 22 | 6 |
| (EW 10 Å) | ||||||
| 19 intermediate | 12 | 1 | 5 | 1 | 7 | 2 |
| (5 EW 10 Å) | ||||||
| 86 WTTS | 77 | 2 | 6 | 1 | 4 | 59 |
| (EW 5 Å) |
4 Results: Rotational Periods
Of the 301 monitored cluster members, we found that 189 are periodic variables, with regular light curves, possibly resulting from the rotational
modulation of the light by stellar spots, 20 are AA Tau-like systems, 45 are irregular LCs, and 47 display no significant variability
(noise dominated LCs). Among the 86 WTTSs, we measured periods for 76 stars (74 regular and 2 AA Tau-like), 6 were found to be irregular and 1 non-variable. For
3 stars we did measure a period, the
variability is clearly due to spot, nonetheless we discarded these periods as they are not significant according both the LNP and autocorrelation
methods. Among the 59 CTTSs, we measured
periods for 33 stars (21 regular and 12 AA Tau-like), 23 were found to be irregular and 1 non-variable, for two stars the periods found
were discarded as not significant. In Table 1 we list the samples used in this work, indicating the morphological division performed
(spot-like, AA-Tau like, etc.) and the membership-IR classification (Class II and Class III) following Sung et al. (2009).
All the rotational periods derived for NGC 2264 members are reported in Table 2. For each star we list: the CoRoT ID; the derived period; the
variability amplitude ; the R magnitude; the B-V magnitude; the right
ascension and declination; the membership-IR classification (Class II and Class III) following Sung et al. (2009) and other membership criteria listed in Sung et al. (2008); the equivalent widths from Dahm & Simon (2005) and the mass from the Siess et al. (2000) tracks.
In the left panel of Fig. 5 we show the rotational period distribution for NGC 2264 members, while the distribution of rotational periods for
CTTSs and WTTSs is shown in the right panel. Although the statistics are limited, it is evident that the period distribution of the CTTSs looks quite different from that of the WTTSs, with CTTSs being
slower rotators on average (median PRot = 7.0 days) with respect to WTTSs (median PRot = 4.2 days), in the cluster NGC
2264. According to a Kolmogorov-Smirnov (K-S)
test (Press et al. 2002), there is only a probability of 2% that the two distribution are equivalent.


The peaks of the distribution for CTTSs are located at about days and days. WTTSs distribution suggests two peaks at days and
days. The difference is even more evident if we compare the period distributions of Class II and Class III stars, as is shown in
Fig. 6. We selected Class II and Class III members following
the membership-IR classification of Sung et al. (2009), using the four IRAC bands and other memberbership criteria listed in Sung et al. (2008).
For Class II-Class III members the K-S test yields a probability of 0.2% that the two distributions are drawn from the same parent population.
The observed rotational period distribution are in agreement with the conclusion
derived by the ground-based study of Lamm et al. (2005), on the accretion-rotation relationship, that is, differences do exist in the rotational behaviour of
accreting and non accreting stars.
Fig. 7 shows rotation period plotted
as a function of stellar mass, derived from the Siess et al. (2000) tracks. The diagram shows no clear trend of rotation period with stellar
mass. We calculated the period distributions in three mass intervals: M 0.75 (“low”); 0.75 M
1.55 (“mid”); 1.55 M 3.0 M⊙ (“high”). Using a K-S test, we have verified that the probabilities that the “low” and
“mid”, the “low” and “high”, and the “mid” and “high” distributions are equivalent are 91%, 58% and 54%, respectively, neither of which
can lead us to infer that they are significantly different. The median periods are 4.8, 4.5 and 3.5 days for the “low”, “mid” and “high” samples, respectively.

We now compare the periods derived from the CoRoT data with those of Lamm et al. (2004, 2005), who identified 405 periodic variables and 184 irregular variable members.
We analyzed the 103 NGC 2264 members in common with the Lamm et al. (2004) ones. The CoRoT periods derived in the present study and ground derived ones (Lamm et al. 2004), apart from the presence of few aliases, are
comparable with the exception of the 1-day periods derived from ground, likely affected by the day-night alternance (CoRoT LCs have both a better sampling and time
coverage than Lamm et al. 2004 ones).
A scatter plot of the CoRoT vs. ground periods is shown in Fig. 8. We followed the indications of Lamm et al. (2004) to estimate the
error in the measured periods, which is related to the finite frequency resolution of the power spectrum. In our study we take advantage of the
uniformity of CoRoT sampling, thus the frequency resolution is related to the total time span T of the observations (23 d) with
(Roberts et al. 1987). Thus we assume as typical error in the period, that given by . We found that for period shorter than 10 d,
the estimated error is 20%, while it grows with period. With these indications, we find that 83% (85/103) of the sample stars have consistent periods in the two
survey, most of the inconsistent values lie along either harmonics (9/103) or the 1-day aliases curve (5/103).
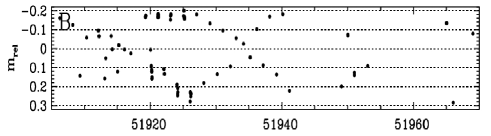
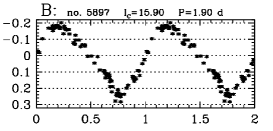
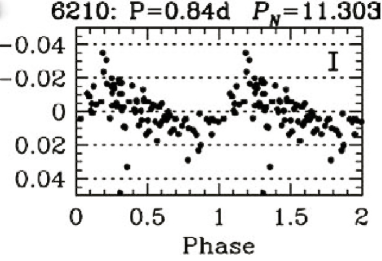
We compare ground and CoRoT data for few intriguing cases, in Fig. 9 we reported a LC of a star with short period illustating the quality of the CoRoT LC with respect to the ground one. In Fig. 10 we show the folded LC from Lamm et al. (2004) together with the CoRoT one, for a case in which the ground determination of 0.84 d is clearly wrong, in comparison with the CoRoT determination of 5.5 d. This comparison highlights the usefulness of a continuous temporal coverage, as can
only be achieved from space.
5 Summary and conclusions
We performed an accurate study of rotation periods in the young open cluster NGC 2264, based on the very accurate CoRoT photometry, also to search for a correlation between accretion and stellar rotation.
We derived rotational period for 209 cluster members, out of 301, which are found to be periodic variables, with a
spot-like modulation of their light or AA Tau like.
This work enabled us to study the distribution of rotational periods of CTTSs and WTTSs. In order to
overcome the bias introduced by the use of NIR excess to classify CTTSs, we used equivalent widths. Furthermore the clean and continuous light
curves of CoRoT allowed us to avoid problems due to discontinuous time sampling. Thanks to the high quality of the CoRoT lightcurves, our results provide the most complete
set of rotational periods of NGC 2264 members, to date, compared to ground-based data.
As discussed in Sect. 1, several models assume that accreting stars may be locked to their disks by strong magnetic fields that channel streams accretion (Shu et al. 1994; Hartmann 2002).
This would result in slower rotation velocities for CTTS, compared to WTTS which have no inner disks, and some observations suggested differences up to
a factor of two in rotational velocities of CTTS versus WTTS in Taurus (Edwards et al. 1993). However, several other studies have found no significant
variations between rotational velocities of CTTS and WTTS in ONC and IC 348 (Stassun et al. 1999, Rhode et al. 2001, Cieza & Baliber 2006). These results seem to
suffer from several biases affecting the selected samples and even the disk and accretion indicators adopted. These differences may also be due to a classification problem, on what one defines classical and weak line T-Tauri stars.
We found that the rotational distributions of CTTSs and WTTSs are different, with WTTSs rotating faster, with a median PRot = 4.2 d, with respect to CTTSs,
with a median PRot = 7.0 d. Our results are even more significant using a Class II - Class III comparison, probably because of the better
statistics. This could suggest that the presence of accretion, or any other properties related to star-disk interaction, affects the rotational period. It is
consistent with the disk locking scenario (Shu et al. 1994; Hartmann 2002) and agrees with previous results in ONC (Choi & Herbst 1996;
Herbst et al. 2002; Rebull et al. 2005), also confirming the previous conclusions of Lamm et al. (2005) and Cieza & Baliber (2007) for NGC 2264.
A new extensive multiband campaign has been executed on NGC 2264 in December 2011 (CoRoT+Spitzer+Chandra complemented with MOST observations).
The new data will enable us to tackle some open questions, on the subject of this paper, such as the stability of the disk structure responsible for the AA Tau-like variability or differential rotation and the possibility of detecting period changes, when spots evolve and appear at different latitudes.
| Corot ID | Period (d)a | AmpVar(%)b | R | B-V | RA(J2000.0) | DEC(J2000.0) | Memb-IRc | EW(H)d | Masse |
|---|---|---|---|---|---|---|---|---|---|
| 0223948127 | I | 20.7 | 15.000 | -0.200 | 99.76562 | 9.67337 | |||
| 0223951807 | - | 0.9 | 14.700 | 1.500 | 99.81503 | 9.65377 | |||
| 0223951822 | - | 0.5 | 13.800 | 0.690 | 99.81532 | 9.49160 | |||
| 0223952236 | - | 4.6 | 14.100 | -1.020 | 99.82101 | 9.97097 | |||
| 0223953966 | 3.987 | 3.7 | 12.600 | -0.590 | 99.84448 | 9.28458 | |||
| 0223954040 | 9.684 | 2.7 | 14.000 | 0.030 | 99.84557 | 9.60481 | 1.30 | ||
| 0223954556 | - | 0.7 | 13.800 | 0.400 | 99.85257 | 9.37606 | |||
| 0223955032 | 5.436 | 5.3 | 14.300 | 0.460 | 99.85937 | 9.68647 | -1.100 | 0.60 | |
| 0223955438 | - | 0.7 | 13.400 | 2.200 | 99.86499 | 9.38587 | |||
| 0223955517 | - | 0.2 | 12.900 | 0.520 | 99.86609 | 9.47768 | |||
| 0223955994 | - | 0.7 | 13.300 | 0.040 | 99.87251 | 9.34971 | |||
| 0223956264 | 2.229 | 6.5 | 14.800 | 0.470 | 99.87656 | 9.56053 | 0.80 | ||
| 0223956963 | 9.786 AA | 15.6 | 14.700 | -0.200 | 99.88675 | 9.07066 | |||
| 0223957004 | - | 2.8 | 14.200 | 0.700 | 99.88737 | 9.94127 | |||
| 0223957142 | 2.568 | 16.9 | 15.200 | 0.600 | 99.88912 | 9.86726 | 0.40 | ||
| 0223957322 | 18.05 | 8.1 | 15.300 | 0.850 | 99.89156 | 9.82254 | 0.80 | ||
| 0223957455 | 10.16 AA | 28.0 | 15.200 | 0.500 | 99.89333 | 9.91437 | |||
| 0223957734 | - | 8.1 | 15.300 | 0.690 | 99.89726 | 9.54231 | |||
| 0223957908 | - | 0.7 | 13.600 | 0.810 | 99.89991 | 9.40729 | |||
| 0223958794 | - | 2.7 | 14.200 | 0.730 | 99.91180 | 9.86451 | 1.60 | ||
| 0223958963 | 0.859 | 9.0 | 15.200 | 0.720 | 99.91379 | 9.93336 | 0.60 | ||
| 0223959618 | 3.922 AA | 55.9 | 14.200 | 0.860 | 99.92274 | 9.77229 | |||
| 0223959652 | 3.732 | 5.7 | 12.700 | -0.170 | 99.92316 | 9.57808 | -3.300 | 1.40 | |
| 0223959949 | - | 0.6 | 14.800 | 0.770 | 99.92764 | 9.53115 | |||
| 0223960995 | - | 0.6 | 14.500 | 1.310 | 99.94267 | 9.80571 | |||
| 0223961132 | 3.839 | 9.3 | 12.500 | 0.210 | 99.94466 | 9.68178 | III | 1.40 | |
| 0223961409 | 1.104 | 0.7 | 11.900 | -0.030 | 99.94879 | 9.43535 | III | ||
| 0223961560 | - | 1.4 | 12.700 | 1.570 | 99.95090 | 9.98496 | |||
| 0223961941 | 6.52 | 4.3 | 14.700 | 0.400 | 99.95667 | 9.55630 | III | 1.10 | |
| 0223962024 | - | 0.7 | 14.500 | 2.900 | 99.95769 | 9.93945 | |||
| 0223962712 | - | 1.6 | 14.500 | 0.970 | 99.96801 | 9.31938 | |||
| 0223963678 | 0.676 | 5.0 | 14.700 | 0.600 | 99.98199 | 9.79233 | III | ||
| 0223963815 | - | 1.5 | 13.200 | 0.100 | 99.98402 | 9.51299 | |||
| 0223963881 | 12.92 | 0.7 | 13.700 | -0.400 | 99.98499 | 9.72557 | III | ||
| 0223963994 | - | 0.2 | 15.200 | -1.200 | 99.98674 | 9.74040 | |||
| 0223964667 | 6.456 | 79.3 | 15.300 | -0.200 | 99.99690 | 9.45691 | |||
| 0223964830 | 2.575 | 9.1 | 15.900 | 0.530 | 99.99934 | 9.56164 | III | 0.80 | |
| 0223965280 | - | 0.7 | 14.500 | 0.970 | 100.00603 | 9.51846 | |||
| 0223965459 | 1.351 | 15.4 | 15.600 | 0.700 | 100.00892 | 9.75401 | III | ||
| 0223965593 | 9.830 | 0.8 | 13.400 | -0.100 | 100.01107 | 9.30565 | III | ||
| 0223965989 | 0.819 | 7.3 | 15.300 | 0.760 | 100.01676 | 9.45211 | III | 0.60 | |
| 0223967301 | 0.957 | 12.6 | 15.800 | 1.360 | 100.03550 | 9.73719 | III | 3.500 | 0.50 |
| 0223967602 | 1.236 | 7.0 | 13.300 | 0.470 | 100.04005 | 9.69555 | III | -1.700 | 1.50 |
| 0223967803 | 3.841 | 7.7 | 14.300 | 0.600 | 100.04288 | 9.64872 | III | 2.000 | 0.70 |
| 0223968039 | I | 56.9 | 15.900 | 0.400 | 100.04640 | 9.63503 | 52.90 | 0.90 | |
| 0223968398 | 2.702 | 11.0 | 15.800 | 1.130 | 100.05183 | 9.73986 | III | 3.600 | 0.50 |
| 0223968439 | 8.688 | 31.6 | 15.400 | -0.200 | 100.05240 | 10.09474 | II | ||
| 0223968646 | - | 2.0 | 15.400 | 0.500 | 100.05598 | 9.32465 | |||
| 0223968688 | 1.117 | 3.9 | 11.500 | 0.080 | 100.05666 | 9.41396 | III | 2.20 | |
| 0223968804 | 1.295 | 3.9 | 13.600 | 0.660 | 100.05841 | 9.34141 | III | 1.40 | |
| 0223969098 | I | 158.2 | 15.800 | 1.300 | 100.06316 | 10.03289 | |||
| 0223969672 | - | 7.2 | 16.000 | 1.000 | 100.07179 | 10.22651 | |||
| 0223970440 | - | 3.7 | 14.700 | 0.260 | 100.08372 | 9.47472 | 3.200 | ||
| 0223970694 | 1.467 | 5.2 | 13.000 | 0.010 | 100.08755 | 9.60907 | III | 0.300 | 1.50 |
| 0223971008 | 7.38 | 9.9 | 15.900 | 1.800 | 100.09258 | 9.90811 | III | 2.100 | 0.60 |
| 0223971231 | I | 170.8 | 14.500 | -0.340 | 100.09618 | 9.46190 | 49.50 | 1.10 | |
| 0223971383 | 4.648 | 11.9 | 15.800 | 0.550 | 100.09904 | 9.92345 | II | 80.60 | |
| 0223971866 | 7.015 | 2.7 | 12.600 | 0.360 | 100.10703 | 9.97667 | III | ||
| 0223971984 | 6.281 | 14.0 | 15.500 | 1.480 | 100.10938 | 9.63385 | III | 3.500 | 0.60 |
| 0223972652 | I | 21.4 | 13.000 | -0.900 | 100.11988 | 9.51704 | 39.10 | ||
| 0223972652 | - | 21.4 | 13.000 | -0.900 | 100.11988 | 9.51704 | 1.800 | 1.60 |
| Corot ID | Period (d)a | AmpVar(%)b | R | B-V | RA(J2000.0) | DEC(J2000.0) | Memb-IRc | EW(H)d | Masse |
|---|---|---|---|---|---|---|---|---|---|
| 0223972691 | 7.206 | 12.0 | 15.300 | 1.310 | 100.12061 | 9.70490 | III | 1.700 | 0.90 |
| 0223972918 | - | 0.9 | 14.100 | 0.930 | 100.12383 | 9.99277 | |||
| 0223972960 | - | 2.5 | 15.300 | 2.370 | 100.12453 | 9.83637 | 1.60 | ||
| 0223973200 | I | 113.2 | 15.600 | 0.070 | 100.12858 | 9.57811 | 22.20 | 1.30 | |
| 0223973292 | 1.974 | 17.7 | 14.700 | 0.170 | 100.13010 | 9.51878 | III | 1.700 | 0.90 |
| 0223973318 | I | 1.0 | 15.600 | 2.600 | 100.13048 | 9.69152 | |||
| 0223973692 | 3.456 | 14.6 | 15.700 | 1.760 | 100.13673 | 9.85833 | 2.700 | 0.90 | |
| 0223974593 | 1.156 | 18.1 | 14.600 | 0.580 | 100.15134 | 9.31610 | III | 0.50 | |
| 0223974689 | - | 1.8 | 14.800 | 1.100 | 100.15278 | 9.36818 | |||
| 0223974891 | 1.212 | 2.9 | 12.900 | 1.740 | 100.15620 | 9.91617 | III | 2.10 | |
| 0223975203 | 9.786 | 1.6 | 15.200 | 0.200 | 100.16160 | 9.36077 | III | 0.90 | |
| 0223975253 | - | 10.5 | 12.600 | 1.440 | 100.16248 | 9.60013 | 3.500 | 0.60 | |
| 0223975844 | 3.332 | 8.9 | 15.200 | 3.130 | 100.17236 | 9.90389 | II | 12.20 | 1.50 |
| 0223976028 | I | 4.1 | 13.400 | 0.710 | 100.17587 | 9.56050 | 7.300 | 1.70 | |
| 0223976099 | 14.17 | 5.6 | 15.800 | 0.540 | 100.17683 | 9.53921 | III | 0.500 | 1.20 |
| 0223976494 | 2.267 | 12.7 | 14.300 | 0.800 | 100.18377 | 9.39887 | III | 1.10 | |
| 0223976672 | 15.00 | 5.2 | 14.100 | 1.540 | 100.18687 | 9.96244 | III | 1.600 | 0.90 |
| 0223976747 | 3.173 AA | 96.6 | 14.700 | 0.750 | 100.18816 | 9.47915 | 7.200 | 1.50 | |
| 0223977051 | 4.53 | 5.5 | 15.200 | 1.410 | 100.19336 | 9.99640 | |||
| 0223977092 | - | 0.5 | 14.000 | 2.000 | 100.19403 | 9.36149 | |||
| 0223977232 | 0.712 | 0.8 | 14.300 | 0.340 | 100.19633 | 9.30929 | III | ||
| 0223977953 | 4.919 AA | 26.6 | 15.700 | 0.730 | 100.20782 | 9.61389 | II | 66.30 | 1.40 |
| 0223978227 | 3.779 | 20.7 | 16.000 | 2.890 | 100.21194 | 9.93148 | III | 2.300 | 0.80 |
| 0223978308 | 5.374 AA | 5.6 | 15.400 | 3.650 | 100.21328 | 9.74633 | II | 3.500 | 1.80 |
| 0223978921 | I | 5.4 | 15.800 | 1.400 | 100.22346 | 9.55701 | 18.20 | 1.40 | |
| 0223978947 | 8.5 | 0.2 | 13.600 | 1.340 | 100.22403 | 9.51095 | III | 1.80 | |
| 0223979728 | I | 8.3 | 15.800 | 1.410 | 100.23665 | 9.63043 | 113.2 | 1.10 | |
| 0223979759 | 3.84 | 0.6 | 15.400 | 3.770 | 100.23719 | 9.81144 | III | 3.900 | 1.60 |
| 0223979980 | 0.577 | 6.9 | 14.800 | 2.200 | 100.24097 | 9.94176 | III | ||
| 0223980019 | I | 0.7 | 14.500 | -0.500 | 100.24154 | 9.30101 | |||
| 0223980048 | 12.5 AA | 24.4 | 14.100 | 1.840 | 100.24200 | 9.61504 | II | 34.00 | |
| 0223980233 | - | 14.0 | 13.800 | 1.800 | 100.24457 | 9.60384 | 22.20 | 0.30 | |
| 0223980258 | 6.990 | 8.9 | 14.900 | 0.980 | 100.24509 | 9.65531 | II | 27.90 | 0.60 |
| 0223980264 | 3.482 AA | 54.0 | 14.600 | 0.960 | 100.24516 | 9.51607 | II | 14.30 | 1.90 |
| 0223980412 | 6.39 | 12.1 | 14.800 | 0.760 | 100.24764 | 9.99601 | II | 7.400 | 1.10 |
| 0223980447 | 1.675 | 9.2 | 16.000 | 1.220 | 100.24816 | 9.58649 | II | 6.400 | 0.90 |
| 0223980621 | 3.049 | 8.9 | 13.400 | 1.770 | 100.25099 | 9.98056 | III | -1.200 | 1.80 |
| 0223980688 | I | 72.6 | 16.000 | 1.310 | 100.25205 | 9.75101 | 15.00 | 1.30 | |
| 0223980693 | 5.282 AA | 112.0 | 14.900 | 1.240 | 100.25214 | 9.48791 | II | 16.60 | 1.50 |
| 0223980807 | I | 8.1 | 14.600 | 1.790 | 100.25407 | 9.54585 | 6.400 | ||
| 0223980941 | 3.794 | 85.9 | 15.300 | 1.800 | 100.25637 | 10.24905 | |||
| 0223980988 | 8.58 | 1.6 | 15.400 | 0.000 | 100.25703 | 9.35170 | III | ||
| 0223981023 | 7.320 AA | 38.2 | 15.800 | 1.300 | 100.25770 | 9.64490 | 1.500 | 1.50 | |
| 0223981174 | 1.974 | 19.7 | 15.600 | 1.000 | 100.26061 | 9.58235 | III | 0.600 | 1.50 |
| 0223981250 | 7.437 | 32.8 | 14.800 | -0.200 | 100.26187 | 10.12015 | |||
| 0223981285 | 1.152 | 1.0 | 15.300 | 2.300 | 100.26239 | 9.79856 | III | ||
| 0223981349 | 8.014 | 13.4 | 15.000 | 2.300 | 100.26363 | 9.96535 | III | 1.500 | 0.80 |
| 0223981406 | 2.157 | 9.0 | 13.800 | 1.190 | 100.26449 | 9.52188 | III | -2.500 | 1.60 |
| 0223981535 | 4.557 | 15.1 | 15.400 | 2.100 | 100.26640 | 9.96940 | III | 4.100 | |
| 0223981550 | 14.58 | 0.5 | 14.900 | -2.200 | 100.26661 | 9.39267 | 1.20 | ||
| 0223981753 | 2.971 | 1.1 | 13.000 | 1.070 | 100.26965 | 9.60751 | III | 2.50 | |
| 0223981811 | I | 86.4 | 15.900 | 4.140 | 100.27067 | 9.84631 | 36.50 | 1.60 | |
| 0223982076 | 2.468 | 3.3 | 13.000 | 2.440 | 100.27471 | 9.45502 | III | 2.600 | 0.30 |
| 0223982136 | 3.018 | 10.7 | 14.700 | 1.280 | 100.27571 | 9.60653 | 10.00 | 1.40 | |
| 0223982169 | 3.162 | 10.3 | 14.900 | 1.590 | 100.27621 | 9.49197 | III | 3.100 | 0.30 |
| 0223982299 | 4.671 AA | 15.1 | 14.700 | 0.400 | 100.27850 | 9.03797 | |||
| 0223982375 | 3.320 | 13.6 | 15.400 | -0.200 | 100.27966 | 9.21076 | II | ||
| 0223982407 | 2.582 | 23.6 | 14.600 | 1.310 | 100.28017 | 9.97540 | III | 1.400 | 1.10 |
| 0223982423 | 9.026 | 3.8 | 15.800 | 2.400 | 100.28040 | 10.22570 | |||
| 0223982535 | 5.052 | 4.7 | 14.700 | 1.310 | 100.28240 | 9.73427 | III | ||
| 0223982779 | 1.882 | 26.8 | 15.600 | -2.000 | 100.28673 | 9.39554 | III | 2.400 | 0.60 |
| Corot ID | Period (d)a | AmpVar(%)b | R | B-V | RA(J2000.0) | DEC(J2000.0) | Memb-IRc | EW(H)d | Masse |
|---|---|---|---|---|---|---|---|---|---|
| 0223982807 | - | 2.3 | 13.400 | 5.000 | 100.28716 | 10.23981 | III | ||
| 0223983310 | 3.589 | 0.9 | 13.800 | 0.510 | 100.29544 | 10.01147 | III | ||
| 0223983509 | 2.390 | 7.89 | 14.100 | 0.300 | 100.29829 | 10.04005 | |||
| 0223983925 | 3.704 | 11.29 | 15.500 | 2.000 | 100.30511 | 9.91922 | 3.000 | ||
| 0223984075 | 3.793 | 3.6 | 12.700 | 1.800 | 100.30750 | 9.92897 | III | -2.600 | |
| 0223984253 | 10.42 | 9.6 | 16.000 | 1.530 | 100.31026 | 9.55614 | III | 1.900 | 1.10 |
| 0223984520 | 1.469 | 7.2 | 15.200 | 1.590 | 100.31425 | 9.77779 | III | 0.200 | 1.70 |
| 0223984572 | I | 14.5 | 12.300 | 2.400 | 100.31499 | 9.44282 | III | 5.500 | 0.30 |
| 0223984572 | - | 14.5 | 12.300 | 2.400 | 100.31499 | 9.44282 | III | ||
| 0223984600 | 5.343 | 1.0 | 13.600 | -0.300 | 100.31541 | 9.63857 | |||
| 0223984608 | 6.098 | 7.7 | 10.200 | 3.180 | 100.31551 | 9.43795 | 1.900 | 1.20 | |
| 0223985009 | I | 83.4 | 15.600 | 2.360 | 100.32182 | 9.90918 | III | 58.30 | 0.80 |
| 0223985176 | 6.547 | 8.3 | 15.700 | 1.240 | 100.32470 | 9.56046 | III | 2.900 | 0.60 |
| 0223985261 | 18.08 AA | 20.3 | 15.400 | 1.280 | 100.32613 | 9.56501 | 28.90 | 1.40 | |
| 0223985611 | 4.94 | 21.5 | 14.900 | 1.270 | 100.33174 | 9.52915 | III | 1.500 | 1.10 |
| 0223985845 | 2.604 | 9.4 | 15.900 | 1.220 | 100.33559 | 9.75999 | |||
| 0223985987 | 3.308 AA | 44.3 | 15.300 | 1.300 | 100.33751 | 9.56029 | III | 10.60 | 0.90 |
| 0223986498 | 3.206 | 6.5 | 14.800 | 1.680 | 100.34600 | 9.45753 | III | ||
| 0223986686 | - | 0.6 | 11.900 | 0.090 | 100.34904 | 9.56587 | II | ||
| 0223986811 | 7.92 | 2.7 | 15.700 | 1.020 | 100.35109 | 9.53181 | III | ||
| 0223986923 | 8.300 | 0.8 | 15.200 | 1.160 | 100.35297 | 9.43999 | |||
| 0223987178 | 9.84 AA | 36.8 | 15.600 | 0.850 | 100.35670 | 9.57878 | III | 15.90 | 0.60 |
| 0223987553 | 1.544 | 22.3 | 14.300 | 0.480 | 100.36308 | 9.58516 | III | 1.100 | 1.50 |
| 0223987997 | 6.456 | 22.9 | 13.800 | 0.020 | 100.36986 | 9.64432 | II | ||
| 0223988020 | - | 1.0 | 14.200 | -0.200 | 100.37021 | 10.15428 | III | ||
| 0223988099 | - | 2.5 | 13.700 | 0.660 | 100.37155 | 9.66014 | II | -1.400 | 1.60 |
| 0223988099 | 3.273 | 2.5 | 13.700 | 0.660 | 100.37155 | 9.66014 | -1.400 | 1.60 | |
| 0223988742 | 5.025 | 16.7 | 15.300 | 1.270 | 100.38172 | 9.80926 | 5.200 | 1.60 | |
| 0223988827 | 4.767 | 9.3 | 15.800 | 0.810 | 100.38329 | 10.00690 | III | 13.10 | 1.10 |
| 0223988965 | 9.5 | 4.5 | 14.200 | 0.640 | 100.38538 | 9.63550 | III | 1.300 | 0.90 |
| 0223989567 | I | 8.4 | 15.200 | 1.700 | 100.39403 | 9.60913 | III | 4.500 | 0.50 |
| 0223989989 | 6.547 | 7.2 | 15.900 | 0.800 | 100.40102 | 9.65579 | III | 1.600 | 0.80 |
| 0223990299 | 4.469 | 9.3 | 14.500 | 0.660 | 100.40536 | 9.75196 | 35.00 | 1.20 | |
| 0223990764 | - | 0.6 | 15.800 | 3.200 | 100.41270 | 9.49399 | III | ||
| 0223990964 | 10.17 AA | 11.5 | 13.600 | 0.340 | 100.41553 | 9.67456 | II | 52.50 | 1.60 |
| 0223991355 | - | 0.9 | 12.700 | 0.000 | 100.42163 | 9.54543 | |||
| 0223991789 | 3.956 | 11.7 | 14.600 | 0.560 | 100.42803 | 9.71584 | II | 0.900 | 0.60 |
| 0223991832 | 8.608 | 18.2 | 16.000 | -0.100 | 100.42868 | 9.41913 | |||
| 0223991967 | - | 0.1 | 12.500 | 0.650 | 100.43058 | 9.45033 | III | ||
| 0223992383 | 3.380 | 5.1 | 15.200 | 0.310 | 100.43725 | 9.74473 | II | 0.80 | |
| 0223992685 | 18.5 | 0.7 | 12.300 | 0.300 | 100.44153 | 9.39736 | |||
| 0223993084 | 6.456 | 5.3 | 15.400 | -0.140 | 100.44751 | 9.70001 | III | 2.600 | 0.50 |
| 0223993180 | 2.411 | 1.4 | 12.900 | 0.430 | 100.44890 | 9.86750 | III | 1.80 | |
| 0223993199 | I | 40.3 | 14.200 | 0.740 | 100.44914 | 9.56957 | III | ||
| 0223993277 | 1.184 | 3.9 | 13.200 | 0.110 | 100.45027 | 9.71222 | III | 1.50 | |
| 0223993499 | I | 0.9 | 14.500 | 3.200 | 100.45351 | 9.72045 | 1.70 | ||
| 0223993840 | 3.250 | 35.8 | 14.500 | 1.050 | 100.45837 | 9.49241 | III | 0.90 | |
| 0223994268 | 3.762 | 4.9 | 13.200 | 0.240 | 100.46436 | 9.89531 | 1.50 | ||
| 0223994721 | I | 37.9 | 14.200 | 0.110 | 100.47102 | 9.96762 | III | 0.80 | |
| 0223994760 | 5.634 | 8.9 | 14.800 | 0.580 | 100.47147 | 9.84660 | III | 1.800 | 1.10 |
| 0223995167 | - | 0.4 | 13.300 | 2.000 | 100.47691 | 9.48783 | |||
| 0223995308 | 10.5 AA | 53.6 | 15.800 | -0.130 | 100.47881 | 9.71481 | II | 0.30 | |
| 0223995327 | - | 0.8 | 13.200 | 0.230 | 100.47910 | 9.89077 | |||
| 0223997570 | 3.660 | 6.5 | 14.500 | 0.670 | 100.51064 | 9.61480 | |||
| 0223997608 | - | 2.7 | 14.700 | 0.260 | 100.51109 | 9.97452 | |||
| 0223998980 | - | 2.2 | 15.500 | 0.600 | 100.52973 | 9.89573 | III | ||
| 0223999063 | - | 0.3 | 11.700 | 0.410 | 100.53070 | 9.82991 | |||
| 0223999581 | - | 0.5 | 14.200 | 1.220 | 100.53790 | 9.98422 | |||
| 0223999591 | - | 1.2 | 15.700 | 0.500 | 100.53800 | 9.80151 | |||
| 0224000646 | - | 0.5 | 13.700 | 0.900 | 100.55241 | 9.98546 | |||
| 0224000835 | - | 1.3 | 15.700 | -0.400 | 100.55477 | 9.76773 | |||
| 0224001158 | I | 5.8 | 15.700 | -0.300 | 100.55867 | 9.59576 |
| Corot ID | Period (d)a | AmpVar(%)b | R | B-V | RA(J2000.0) | DEC(J2000.0) | Memb-IRc | EW(H)d | Masse |
|---|---|---|---|---|---|---|---|---|---|
| 0224001312 | - | 1.0 | 14.200 | -0.150 | 100.56084 | 9.84115 | |||
| 0224003566 | - | 0.5 | 14.700 | -0.200 | 100.59132 | 9.80927 | |||
| 0224006123 | 10.25 AA | 53.2 | 13.000 | 0.400 | 100.62704 | 9.15735 | |||
| 0400007328 | 2.434 | 23.0 | 13.530 | 2.450 | 100.32380 | 9.49061 | III | 2.400 | 0.30 |
| 0400007394 | 3.443 | 4.6 | 14.020 | 3.020 | 100.21672 | 9.75134 | 2.800 | 0.50 | |
| 0400007528 | 9.42 | 14.0 | 14.450 | 1.860 | 100.15780 | 9.58167 | II | 23.40 | 0.30 |
| 0400007529 | 4.842 | 9.3 | 14.560 | 2.250 | 100.21948 | 9.73917 | III | 2.200 | 0.40 |
| 0400007538 | I | 23.1 | 14.450 | 0.230 | 100.15217 | 9.84601 | 21.10 | 0.40 | |
| 0400007614 | I | 13.6 | 14.640 | 1.580 | 100.05709 | 9.94183 | 130.2 | 0.40 | |
| 0400007686 | I | 5.1 | 15.150 | -8.100 | 100.27679 | 9.47745 | 56.10 | 0.40 | |
| 0400007687 | 11.5 | 5.6 | 15.220 | 1.700 | 100.30544 | 9.86512 | III | 2.000 | 0.50 |
| 0400007702 | 5.884 | 20.2 | 15.230 | 1.550 | 100.15916 | 9.49792 | II | 2.600 | 0.50 |
| 0400007709 | - | 10.3 | 14.950 | 1.720 | 100.35226 | 9.62654 | 8.900 | 0.30 | |
| 0400007734 | 9.996 | 5.6 | 15.200 | 1.830 | 100.36250 | 9.50365 | 25.80 | 0.50 | |
| 0400007743 | - | 0.9 | 15.230 | 1.910 | 100.37020 | 9.58169 | |||
| 0400007765 | I | 2.7 | 15.300 | 1.840 | 100.23683 | 9.86573 | 1.100 | 0.30 | |
| 0400007784 | 9.114 | 6.1 | 15.350 | 1.480 | 100.00467 | 9.59265 | III | ||
| 0400007786 | 8.608 | 6.7 | 15.460 | 1.180 | 100.21748 | 9.94537 | 3.100 | 0.50 | |
| 0400007803 | 9.73 | 12.3 | 14.680 | 1.130 | 100.26503 | 9.50806 | II | 20.40 | |
| 0400007809 | 3.990 | 14.7 | 15.510 | 1.510 | 100.12186 | 9.73542 | 31.30 | 0.40 | |
| 0400007860 | 2.172 | 1.8 | 15.280 | 0.810 | 100.23959 | 9.82246 | III | ||
| 0400007889 | 1.897 | 46.3 | 15.190 | 1.810 | 100.27310 | 9.52793 | 3.000 | 0.30 | |
| 0400007919 | 4.625 | 15.0 | 15.620 | 1.600 | 100.26164 | 9.38756 | |||
| 0400007955 | I | 17.1 | 15.900 | 1.380 | 100.21982 | 9.71679 | 19.40 | 0.30 | |
| 0400007956 | 1.260 | 3.6 | 15.330 | 1.580 | 100.27903 | 9.68180 | III | 2.800 | |
| 0400007957 | I | 16.9 | 15.820 | 1.680 | 100.32107 | 9.54786 | 2.100 | 0.30 | |
| 0400007959 | 5.738 | 15.5 | 15.600 | 0.970 | 100.27805 | 9.79100 | II | 6.200 | |
| 0400008031 | - | 29.3 | 15.840 | 1.110 | 100.26287 | 9.48460 | 14.60 | ||
| 0400008086 | 5.34 | 3.4 | 15.890 | 1.000 | 100.23363 | 9.71502 | 8.000 | ||
| 0400008126 | 0.546 | 1.7 | 15.540 | 0.970 | 100.29521 | 9.88840 | III | 13.20 | |
| 0500007008 | - | 5.3 | 10.350 | 1.180 | 100.15522 | 9.79159 | |||
| 0500007018 | 1.487 | 1.0 | 10.950 | 1.360 | 100.02357 | 9.59702 | III | ||
| 0500007021 | - | 0.3 | 10.720 | 1.010 | 100.48482 | 9.83499 | |||
| 0500007022 | 3.332 | 5.6 | 11.050 | 1.310 | 100.30433 | 9.45886 | III | ||
| 0500007025 | 0.747 | 7.9 | 11.360 | 1.230 | 100.19200 | 9.82149 | III | 3.00 | |
| 0500007031 | - | 0.8 | 11.450 | 0.820 | 100.19658 | 9.48052 | |||
| 0500007038 | 4.132 | 0.8 | 11.880 | 1.060 | 100.15281 | 9.78959 | III | ||
| 0500007039 | 11.92 | 0.6 | 11.980 | 1.140 | 100.27870 | 9.38927 | III | -1.500 | 2.20 |
| 0500007046 | I | 3.6 | 12.550 | 1.470 | 100.18600 | 9.80059 | 48.90 | ||
| 0500007051 | 10.0 | 1.1 | 11.890 | 0.700 | 100.25919 | 9.86443 | III | -1.600 | 2.10 |
| 0500007087 | 14.0 | 2.0 | 12.340 | 0.360 | 100.09639 | 9.93886 | III | ||
| 0500007089 | I | 21.4 | 12.320 | 0.260 | 100.30362 | 9.43746 | 85.60 | 1.70 | |
| 0500007115 | 1.995 | 35.5 | 13.420 | 1.050 | 100.30241 | 9.87533 | II | 35.30 | |
| 0500007120 | 8.53 | 14.2 | 13.450 | 1.010 | 100.19793 | 9.82471 | II | 12.80 | 1.80 |
| 0500007122 | I | 57.2 | 12.780 | 0.290 | 100.37966 | 9.44951 | 25.90 | ||
| 0500007126 | - | 0.6 | 12.550 | -0.040 | 100.23119 | 9.52272 | |||
| 0500007137 | 2.914 | 7.6 | 12.780 | 0.020 | 100.29095 | 9.45339 | III | 3.100 | 1.20 |
| 0500007157 | 4.344 | 7.2 | 13.190 | 0.260 | 100.25324 | 9.85620 | III | 1.600 | 1.30 |
| 0500007176 | 4.024 | 6.9 | 13.400 | 0.330 | 100.26849 | 9.85725 | III | ||
| 0500007197 | 9.114 | 5.0 | 13.570 | 0.220 | 100.18063 | 9.84988 | III | 1.700 | 0.80 |
| 0500007202 | - | 0.3 | 13.650 | 0.260 | 100.20934 | 9.33399 | |||
| 0500007209 | I | 45.2 | 13.600 | 0.170 | 100.21081 | 9.91593 | 11.20 | 1.60 | |
| 0500007217 | 2.582 | 10.4 | 13.520 | 0.000 | 100.27172 | 9.88772 | III | 1.500 | |
| 0500007221 | I | 9.3 | 13.430 | -0.130 | 100.29939 | 9.44207 | 5.400 | 0.70 | |
| 0500007227 | 7.151 | 6.9 | 13.880 | 0.280 | 100.12758 | 9.76962 | III | 1.500 | 1.30 |
| 0500007248 | 7.50 | 2.5 | 13.860 | 0.170 | 100.27125 | 9.86238 | III | 1.700 | 1.10 |
| 0500007249 | I | 5.9 | 14.680 | 0.980 | 100.41155 | 9.53661 | 58.60 | 1.20 | |
| 0500007252 | 13.88 | 39.8 | 13.730 | 0.000 | 100.16299 | 9.84962 | II | 46.50 | 1.50 |
| 0500007269 | 3.674 | 92.7 | 14.530 | 0.740 | 100.17435 | 9.86237 | II | 22.90 | 1.10 |
| 0500007272 | 3.748 | 14.9 | 13.380 | -0.420 | 100.16840 | 9.84735 | III | 58.30 | 0.70 |
| 0500007276 | 4.743 | 7.2 | 13.970 | 0.150 | 100.17261 | 9.80267 | 2.400 | 1.10 | |
| 0500007283 | 3.217 | 9.6 | 13.940 | 0.100 | 100.23215 | 9.85385 | II | 8.000 | 1.00 |
| Corot ID | Period (d)a | AmpVar(%)b | R | B-V | RA(J2000.0) | DEC(J2000.0) | Memb-IRc | EW(H)d | Masse |
|---|---|---|---|---|---|---|---|---|---|
| 0500007298 | 15.25 | 4.3 | 14.070 | 0.150 | 100.15262 | 9.80638 | III | 4.900 | 1.10 |
| 0500007300 | I | 0.7 | 13.480 | -0.450 | 100.15151 | 9.37904 | |||
| 0500007308 | 3.141 | 9.3 | 14.200 | 0.230 | 100.10616 | 9.80721 | III | 0.800 | 1.10 |
| 0500007315 | 7.812 AA | 32.9 | 13.920 | -0.080 | 100.17216 | 9.85066 | II | 24.50 | 0.80 |
| 0500007330 | 4.304 | 3.5 | 14.030 | -0.030 | 100.27422 | 9.87996 | III | 0.900 | 0.80 |
| 0500007335 | 14.99 AA | 8.8 | 14.020 | -0.070 | 100.26789 | 9.41449 | II | 101.8 | 0.60 |
| 0500007347 | 4.206 | 15.3 | 14.210 | 0.060 | 100.25000 | 9.48057 | III | 1.700 | 0.80 |
| 0500007354 | 1.165 | 11.6 | 14.240 | 0.050 | 100.22991 | 9.84718 | 2.800 | 1.00 | |
| 0500007366 | 3.617 | 8.2 | 14.060 | -0.190 | 100.19733 | 9.81373 | III | 1.800 | 0.50 |
| 0500007369 | I | 15.2 | 13.590 | -0.680 | 100.27808 | 9.57943 | 49.40 | ||
| 0500007379 | 14.17 | 2.7 | 14.300 | -0.010 | 100.17095 | 9.79936 | 7.500 | 0.80 | |
| 0500007383 | 1.289 | 4.8 | 13.970 | -0.360 | 100.27368 | 9.90520 | III | 3.800 | 0.50 |
| 0500007410 | - | 2.8 | 14.050 | -0.390 | 100.21897 | 9.86833 | 6.900 | 0.70 | |
| 0500007416 | 3.748 | 3.5 | 14.170 | -0.300 | 100.27124 | 9.81332 | III | ||
| 0500007457 | 1.049 | 3.0 | 14.480 | -0.130 | 100.17415 | 9.83120 | III | 4.200 | 0.60 |
| 0500007458 | 4.625 | 5.8 | 14.490 | -0.130 | 100.18768 | 9.76162 | 2.400 | 0.80 | |
| 0500007460 | 8.49 AA | 42.0 | 14.600 | -0.030 | 100.18006 | 9.78535 | II | 27.10 | 0.90 |
| 0500007473 | I | 24.9 | 14.430 | -0.260 | 100.22610 | 9.82232 | 161.1 | 0.50 | |
| 0500007505 | I | 8.3 | 14.900 | 0.070 | 100.17086 | 9.46509 | 13.20 | ||
| 0500007550 | - | 0.4 | 14.590 | -0.440 | 100.40549 | 9.53271 | |||
| 0500007556 | 3.405 | 4.5 | 14.250 | -0.810 | 100.34229 | 9.35863 | III | 3.800 | |
| 0500007572 | 8.08 | 3.2 | 14.440 | -0.670 | 100.29298 | 9.36376 | III | 2.700 | |
| 0500007580 | 1.805 | 17.5 | 14.700 | -0.450 | 100.24931 | 9.86359 | III | 4.900 | 0.40 |
| 0500007585 | 9.786 | 14.3 | 14.780 | -0.410 | 100.19170 | 9.29951 | |||
| 0500007610 | 9.34 | 17.4 | 14.690 | -0.610 | 100.24792 | 9.49770 | II | 26.20 | 0.30 |
| 0500007634 | 11.25 | 6.7 | 14.970 | -0.410 | 100.26488 | 10.00983 | 6.900 | 0.50 | |
| 0500007667 | 5.405 | 22.6 | 15.190 | -0.340 | 100.31035 | 9.62065 | III | 4.100 | |
| 0500007682 | I | 7.9 | 14.580 | -1.010 | 100.31008 | 9.44952 | 2.700 | 0.30 | |
| 0500007708 | 9.584 | 11.4 | 15.220 | -0.450 | 100.22546 | 9.49752 | III | 3.600 | |
| 0500007727 | I | 20.7 | 15.150 | -0.590 | 100.29583 | 9.59881 | 61.50 | 0.80 | |
| 0500007730 | 12.5 | 3.2 | 14.850 | -0.910 | 100.20505 | 9.96077 | 50.80 | 0.50 | |
| 0500007752 | 4.042 | 5.4 | 14.720 | -1.110 | 100.28734 | 9.56278 | II | 51.00 | 0.30 |
| 0500007766 | I | 7.2 | 15.070 | -0.800 | 100.29283 | 9.55696 | 2.700 | 0.30 | |
| 0500007770 | 10.0 | 4.4 | 15.300 | -0.580 | 100.01115 | 9.69690 | III | ||
| 0500007794 | 8.854 | 7.1 | 15.410 | -0.530 | 100.23939 | 9.48984 | III | 4.000 | |
| 0500007808 | 5.025 | 2.9 | 15.060 | -0.920 | 100.29496 | 9.77811 | III | 3.900 | 0.30 |
| 0500007816 | 7.378 | 1.1 | 15.060 | -0.980 | 100.22344 | 9.78455 | II | 8.100 | 0.30 |
| 0500007837 | I | 19.5 | 15.380 | -0.740 | 100.28690 | 9.88365 | |||
| 0500007857 | I | 8.0 | 15.360 | -0.820 | 100.26905 | 9.64190 | 108.0 | 0.30 | |
| 0500007874 | I | 3.3 | 15.740 | -0.500 | 100.18720 | 9.81921 | 2.600 | ||
| 0500007896 | 9.296 | 14.0 | 14.950 | -1.360 | 100.27596 | 9.41769 | II | 34.70 | 0.20 |
| 0500007918 | I | 2.7 | 15.330 | -1.070 | 100.14539 | 9.90200 | 5.200 | 0.30 | |
| 0500007930 | 6.30 | 19.8 | 15.620 | -0.810 | 100.18580 | 9.54061 | 60.00 | 0.30 | |
| 0500007939 | 1.029 | 5.3 | 15.430 | 1.200 | 100.24333 | 9.45696 | III | 6.700 | |
| 0500007963 | 2.568 | 28.6 | 15.880 | -0.660 | 100.19968 | 9.55087 | |||
| 0500007992 | 2.318 | 2.4 | 15.170 | -1.480 | 100.19115 | 9.64566 | III | 4.100 | |
| 0500008003 | 3.19 | 5.0 | 15.630 | -1.070 | 100.35450 | 9.60005 | III | ||
| 0500008007 | 1.805 | 4.4 | 15.900 | -0.820 | 100.17437 | 9.69406 | 3.100 | ||
| 0500008038 | 3.469 | 6.7 | 15.660 | -1.150 | 100.10687 | 9.99993 | II | 0.30 | |
| 0500008049 | 10.44 | 26.4 | 15.430 | -1.420 | 100.32468 | 9.48364 | II | 231.4 | 0.40 |
| 0500008061 | - | 6.8 | 15.650 | -1.230 | 100.32534 | 9.64038 | 32.50 | 0.30 | |
| 0500008064 | I | 0.8 | 15.930 | -0.970 | 100.22479 | 9.84946 | |||
| 0500008145 | 4.448 | 5.2 | 15.620 | -1.590 | 100.16884 | 9.58365 | II | ||
| 0500008156 | - | 20.7 | 15.880 | -1.360 | 100.30215 | 9.58578 | |||
| 0500008183 | 7.67 | 3.5 | 15.740 | -1.610 | 100.27488 | 9.65395 | II | 7.400 | 0.20 |
| 0500008192 | 2.408 | 12.1 | 15.760 | -1.620 | 100.30569 | 9.63716 | II | ||
| 0500008211 | 2.324 | 3.6 | 15.770 | -1.700 | 100.26266 | 9.62660 | II | 34.10 | 0.50 |
| 0500008213 | 4.364 | 3.9 | 15.880 | -1.600 | 100.27111 | 9.82302 | II | 8.300 |
a: I=indicates irregular variables, AA=indicates AA Tau-type stars; b: Short term variability amplitude of the light curves;
c: Membership-IR classification (Class II and Class III) of Sung et al. (2009), considering also other memberbership criteria listed in Sung et al. (2008); d: H equivalent width from Lamm et al. (2004); e: Masses are from the Siess et al. (2000) tracks. Stars were placed in the Teff, Lbol diagram converting spectral types to Teff and I-band and (in absence of the I magnitude) V-band bolometric corrections, using Kenyon & Hartmann (1996).
Acknowledgments
LA and GM acknowledge support from the ASI-INAF agreement I/044/10/0.
References
- Affer et al. (2012) Affer, L., Micela, G., Favata, F., & Flaccomio, E. 2012, MNRAS, 424, 11
- (2) Aigrain, S., & Irwin, M. 2004, MNRAS, 350, 331
- Alencar et al. (2010) Alencar, S. H. P., Teixeira, P. S., Guimarães, M. M., et al. 2010, A&A, 519, A88
- (4) Baglin, A., et al. 2006, 36th COSPAR Scientific Assembly, 36, 3749
- (5) Barrado y Navascués, D., & Martín, E. L. 2003, AJ, 126, 2997
- Bouvier et al. (1993) Bouvier, J., Cabrit, S., Fernandez, M., Martin, E. L., & Matthews, J. M. 1993, A&A, 272, 176
- Bouvier et al. (1999) Bouvier, J., Chelli, A., Allain, S., et al. 1999, A&A, 349, 619
- Bouvier et al. (2003) Bouvier, J., Grankin, K. N., Alencar, S. H. P., et al. 2003, A&A, 409, 169
- Bouvier et al. (2007) Bouvier, J., Alencar, S. H. P., Boutelier, T., et al. 2007, A&A, 463, 1017
- Bouvier (2008) Bouvier, J. 2008, A&A, 489, L53
- Bouvier (2009) Bouvier, J. 2009, EAS Publications Series, 39, 199
- Box & Jenkins (1976) Box, G. E. P., & Jenkins, G. M. 1976, Holden-Day Series in Time Series Analysis, Revised ed., San Francisco: Holden-Day
- Camenzind (1990) Camenzind, M. 1990, Reviews in Modern Astronomy, 3, 234
- Choi & Herbst (1996) Choi, P. I., & Herbst, W. 1996, AJ, 111, 283
- Cieza & Baliber (2006) Cieza, L., & Baliber, N. 2006, ApJ, 649, 862
- Cieza & Baliber (2007) Cieza, L., & Baliber, N. 2007, ApJ, 671, 605
- Collier Cameron et al. (1995) Collier Cameron, A., Campbell, C. G., & Quaintrell, H. 1995, A&A, 298, 133
- Dahm & Simon (2005) Dahm, S. E., & Simon, T. 2005, AJ, 129, 829
- Dahm (2008) Dahm, S. E. 2008, Handbook of Star Forming Regions, Volume I, 966
- Dahm et al. (2007) Dahm, S. E., Simon, T., Proszkow, E. M., & Patten, B. M. 2007, AJ, 134, 999
- (21) Eaton, N. L., Herbst, W., & Hillenbrand, L. A. 1995, AJ, 110, 1735
- Edwards et al. (1993) Edwards, S., Strom, S. E., Hartigan, P., et al. 1993, AJ, 106, 372
- (23) Flaccomio, E., Micela, G., Sciortino, S., Feigelson, E. D., Herbst, W., Favata, F., Harnden, F. R., Jr., & Vrtilek, S. D. 2005, ApJS, 160, 450
- Flaccomio et al. (2006) Flaccomio, E., Micela, G., & Sciortino, S. 2006, A&A, 455, 903
- Flaccomio et al. (2010) Flaccomio, E., Micela, G., Favata, F., & Alencar, S. P. H. 2010, A&A, 516, L8
- Fűrész et al. (2006) Fűrész, G., et al. 2006, ApJ, 648, 1090
- Grosso et al. (2007) Grosso, N., Bouvier, J., Montmerle, T., et al. 2007, A&A, 475, 607
- Hartmann & MacGregor (1982) Hartmann, L., & MacGregor, K. B. 1982, ApJ, 259, 180
- Hartmann (2002) Hartmann, L. 2002, ApJ, 578, 914
- Herbst (1994) Herbst, W. 1994, The Nature and Evolutionary Status of Herbig Ae/Be Stars, 62, 35
- Herbst et al. (2000) Herbst, W., Rhode, K. L., Hillenbrand, L. A., & Curran, G. 2000, AJ, 119, 261
- Herbst et al. (2002) Herbst, W., Bailer-Jones, C. A. L., Mundt, R., Meisenheimer, K., & Wackermann, R. 2002, A&A, 396, 513
- Horne & Baliunas (1986) Horne, J. H., & Baliunas, S. L. 1986, ApJ, 302, 757
- Kendall et al. (2005) Kendall, T. R., Bouvier, J., Moraux, E., James, D. J., & Ménard, F. 2005, A&A, 434, 939
- Kenyon & Hartmann (1995) Kenyon, S. J., & Hartmann, L. 1995, ApJS, 101, 117
- Kenyon & Hartmann (1996) Kenyon, S. J., & Hartmann, L. 1996, VizieR Online Data Catalog, 2101, 10117
- Koenigl (1991) Koenigl, A. 1991, ApJL, 370, L39
- Irwin et al. (2011) Irwin, J., Berta, Z. K., Burke, C. J., et al. 2011, ApJ, 727, 56
- Lamm et al. (2004) Lamm, M. H., Bailer-Jones, C. A. L., Mundt, R., Herbst, W., & Scholz, A. 2004, A&A, 417, 557
- Lamm et al. (2005) Lamm, M. H., Mundt, R., Bailer-Jones, C. A. L., & Herbst, W. 2005, A&A, 430, 1005
- Martín (1998) Martín, E. L. 1998, AJ, 115, 351
- Matt & Pudritz (2005) Matt, S., & Pudritz, R. E. 2005, ApJL, 632, L135
- Matt et al. (2010) Matt, S. P., Pinzón, G., de la Reza, R., & Greene, T. P. 2010, ApJ, 714, 989
- Matt et al. (2012) Matt, S. P., Pinzón, G., Greene, T. P., & Pudritz, R. E. 2012, ApJ, 745, 101
- Ménard et al. (2003) Ménard, F., Bouvier, J., Dougados, C., Mel’nikov, S. Y., & Grankin, K. N. 2003, A&A, 409, 163
- Paatz & Camenzind (1996) Paatz, G., & Camenzind, M. 1996, A&A, 308, 77
- Press et al. (2002) Press, W. H., Teukolsky, S. A., Vetterling, W. T., & Flannery, B. P. 2002, Numerical recipes in C++ : the art of scientific computing by William H. Press. xxviii, 1,002 p. : ill. ; 26 cm. Includes bibliographical references and index. ISBN : 0521750334,
- Ramírez et al. (2004) Ramírez, S. V., et al. 2004, AJ, 127, 2659
- Rebull et al. (2002) Rebull, L. M., et al. 2002, AJ, 123, 1528
- Rebull et al. (2005) Rebull, L. M., Stauffer, J. R., Megeath, T., Hora, J., & Hartmann, L. 2005, Bulletin of the American Astronomical Society, 37, #185.08
- Rebull et al. (2006) Rebull, L. M., Stauffer, J. R., Megeath, S. T., Hora, J. L., & Hartmann, L. 2006, ApJ, 646, 297
- Rhode et al. (2001) Rhode, K. L., Herbst, W., & Mathieu, R. D. 2001, AJ, 122, 3258
- Roberts et al. (1987) Roberts, D. H., Lehar, J., & Dreher, J. W. 1987, AJ, 93, 968
- Samadi et al. (2007) Samadi, R., Fialho, F., Costa, J. E. S., et al. 2007, arXiv:astro-ph/0703354
- Scargle (1982) Scargle, J. D. 1982, ApJ, 263, 835
- Shu et al. (1994) Shu, F., Najita, J., Ostriker, E., et al. 1994, ApJ, 429, 781
- Siess et al. (1997) Siess, L., Forestini, M., & Dougados, C. 1997, A&A, 324, 556
- Siess et al. (2000) Siess, L., Dufour, E., & Forestini, M. 2000, A&A, 358, 593
- Soderblom et al. (1999) Soderblom, D. R., King, J. R., Siess, L., Jones, B. F., & Fischer, D. 1999, AJ, 118, 1301
- Stassun et al. (1999) Stassun, K. G., Mathieu, R. D., Mazeh, T., & Vrba, F. J. 1999, AJ, 117, 2941
- Sung et al. (2008) Sung, H., Bessell, M. S., Chun, M.-Y., Karimov, R., & Ibrahimov, M. 2008, AJ, 135, 441
- Sung et al. (2009) Sung, H., Stauffer, J. R., & Bessell, M. S. 2009, AJ, 138, 1116
- Teixeira et al. (2006) Teixeira, P. S., Lada, C. J., Young, E. T., et al. 2006, ApJL, 636, L45
- Zwintz et al. (2011) Zwintz, K., Kallinger, T., Guenther, D. B., et al. 2011, ApJ, 729, 20