001
E. M. Corsini
55email: enricomaria.corsini@unipd.it
The relation between bar formation, galaxy luminosity, and environment
Abstract
We derive the bar fraction in three different environments ranging from the field to Virgo and Coma clusters, covering an unprecedentedly large range of galaxy luminosities (or, equivalently, stellar masses). We confirm that the fraction of barred galaxies strongly depends on galaxy luminosity. We also show that the difference between the bar fraction distributions as a function of galaxy luminosity (and mass) in the field and Coma cluster are statistically significant, with Virgo being an intermediate case. We interpret this result as a variation of the effect of environment on bar formation depending on galaxy luminosity. We speculate that brighter disk galaxies are stable enough against interactions to keep their cold structure, thus, the interactions are able to trigger bar formation. For fainter galaxies the interactions become strong enough to heat up the disks inhibiting bar formation and even destroying the disks. Finally, we point out that the controversy regarding whether the bar fraction depends on environment could be resolved by taking into account the different luminosity ranges of the galaxy samples studied so far.
keywords:
galaxies: clusters: individual (Coma) – galaxies: clusters: individual (Virgo) – galaxies: evolution – galaxies: formation – galaxies: structure1 Introduction
Galaxy bars spontaneously form due to instabilities in dynamically cold disks. The growth rate of bars depends on the halo-to-disk mass ratio and the velocity dispersions of the disk and halo and bars grow faster in massive and cold disks (see Athanassoula, 2012, for a review). Moreover, environmental processes can regulate the life cycle of bars contributing both to their development by forcing disk instabilities and to their destruction via disk heating. A variety of methods to detect bars in galaxy disks and measure the local galaxy density have been adopted, but the results on the correlation between the bar fraction and environment are controversial (see Méndez-Abreu et al., 2012, and references therein).
Here, we derive the bar fraction in three different galaxy environments ranging from the field to the Virgo and Coma clusters. The unprecedentedly large range of luminosities (or, equivalently, stellar masses) covered by the different galaxy samples we investigate allows us to distinguish the effects of environment in heating galaxy disks from those triggering bar formation.
2 Galaxy sample, identification of disks, and detection of bars
Four galaxy samples were selected in order to analyze three different galaxy environments (i.e., the field, Virgo cluster, and Coma cluster):
-
•
field1 sample: 2389 field galaxies with magnitude from Aguerri et al. (2009);
-
•
field2 sample: 352 field galaxies with from Sánchez-Janssen et al. (2010);
-
•
Virgo sample: 588 Virgo galaxies with from Zarattini et al. (in prep.);
-
•
Coma sample: 169 Coma galaxies with and located mainly in the cluster center from Méndez-Abreu et al. (2010).
The and apparent magnitudes and axial ratios , of all the galaxies were retrieved from Sloan Digital Sky Survey (SDSS) III (Aihara et al. 2011). We considered only the galaxies with in order to deal with projection effects. The galaxy images of field2, Virgo, and Coma samples have a similar spatial resolution ( pc). Indeed, the farthest galaxies (i.e., those in the Coma sample) were analyzed by studying their Hubble Space Telescope images. The mean resolution of the field1 sample is kpc. However, since the field1 galaxies are the largest galaxies in our sample, bars smaller than the resolution limit should be considered as nuclear bars. We computed the stellar mass from the color following Zibetti et al. (2009) to avoid a possible color bias due to cluster galaxies being on average redder than in the field.
We adopted the morphological classification of the galaxies in the SSDS-Data Release 7 spectroscopic sample given by Huertas-Company et al. (2011). Due to the incompleteness of the SDSS spectroscopic sample and since several of our sample galaxies do not have any spectroscopic information, we remained with 1604, 336, 228, and 44 disk galaxies in the field1, field2, Virgo, and Coma sample, respectively. Following Aguerri et al. (2009) and Méndez-Abreu et al. (2010), we detected the presence of bars by visually inspecting the galaxy images. We classified all the galaxies into strong barred, weakly barred, and unbarred.
3 Results
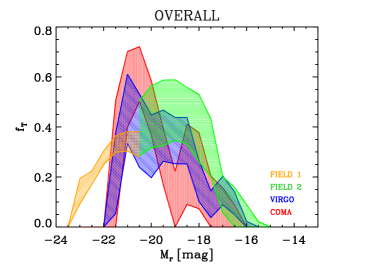
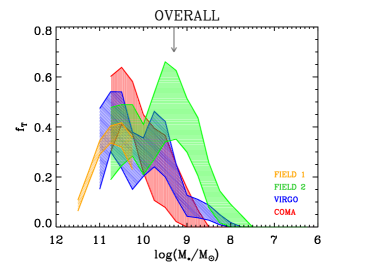
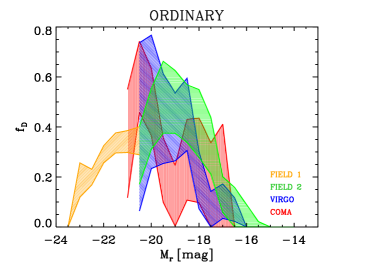
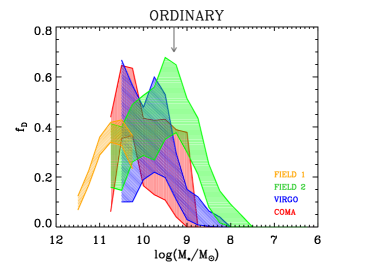
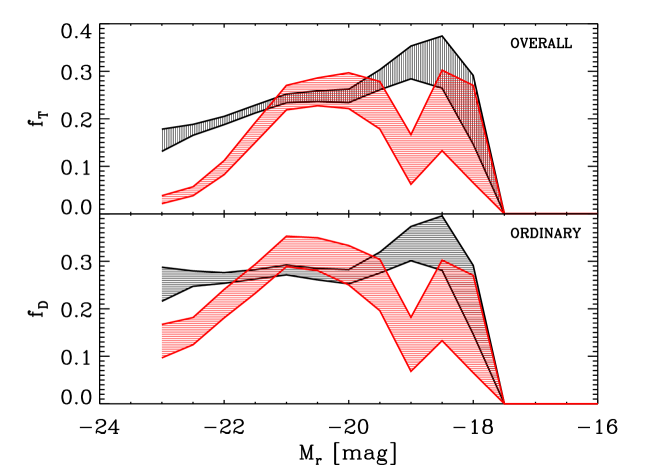
For each galaxy sample we derived the ordinary bar fraction (calculated only for the disk galaxies) and the overall bar fraction (calculated for all the galaxies independently of their Hubble type). Since bars can only be triggered in disks, combines the luminosity distribution of disk galaxies with their probability of having a bar overcoming the problem of the identification of disk galaxies. This is always a major concern in morphological classifications dealing with the measurement of bar fraction. allows us to probe a larger range of luminosities than .
Figure 1 shows and as function of the -band absolute magnitude and mass of the galaxies. The lower and upper boundaries of the hatched areas correspond to the bar fraction calculated by considering only the strong (i.e., secure) bars and both the strong and weak (i.e., secure and uncertain) bars, respectively and including their statistical uncertainties. The values of and for the samples of bright (field1) and faint field galaxies (field2) are in good agreement. Therefore, for studying the bar fraction distribution we merged the two samples into a joint sample of field galaxies (hereafter field sample). The fraction of barred galaxies shows a maximum of about at in clusters, whereas the peak is shifted to in the field.
For a consistency check we performed the same analysis in the sample studied by Nair & Abraham (2010). We adopted their morphological classification and estimate of the local galaxy density to identify galaxies in the field ( Mpc-2) and in compact groups ( Mpc-2). The bar fraction distributions of these two subsamples probing the very low-density and very high-density environments, respectively are shown in Figure 2. The trends we derived from the data by Nair & Abraham (2010) are fully in agreement with the findings for our samples once we take into account that Nair & Abraham (2010) impose a more severe definition in identifying barred galaxies and hence the values of and we derived for their samples are systematically lower than those in this work.
4 Conclusions
The difference of the bar fraction distributions as a function of galaxy luminosity (and mass) in the field and Coma cluster is found to be statistically significant ( confidence level), with the Virgo cluster being an intermediate case. Since bars live in disks, these findings allow us to distinguish between the environmental processes inhibiting bar formation (heating) or even destroying the host disk from the processes triggering the disk instabilities which are responsible for bar formation.
We interpret the decrease of and with decreasing galaxy luminosity observed for fainter () or, equivalently, less massive galaxies () as due to the increase of the disk thickness. Indeed, Sánchez-Janssen et al. (2010) have recently found that the minimum of the disk thickness distribution occurs at a characteristic mass (corresponding to ) below which low-mass galaxies start to be systematically thicker making it difficult to develop a bar. We suggest that the values of and in the field are systematically larger than those in Virgo and Coma because the low-mass galaxy disks in clusters are more easily heated, or destroyed, by galaxy interactions and can not develop a bar. In the low luminosity regime nurture and nature are acting on galaxy disks in cluster and field, respectively.
Since the values of and are larger for cluster galaxies with (or ), we conclude that brighter disks are strong enough to survive interactions and form a bar. In the high luminosity regime nurture and nature are acting on bar formation in galaxy disks of cluster and field, respectively.
Our results highlight the importance of studying galaxy samples which have been carefully selected in luminosity to avoid biases when dealing with bar statistics. We argue that most of the controversial results about the relationship between environment and bar fraction could be explained in terms of the different luminosity ranges covered by the galaxy samples studied so far.
References
- Aguerri et al. (2009) Aguerri, J. A. L., Méndez-Abreu, J., & Corsini, E. M. 2009, A&A, 495, 491
- Aihara et al. (2011) Aihara, Allende Prieto, C., An, D., et al. 2011, ApJS, 193, 29
- Athanassoula (2012) Athanassoula, E. 2012, in Proc. XXIII Canary Islands Winter School, Secular Evolution of Galaxies, ed. J. Falcón-Barroso & J. H. Knapen (CUP, Cambridge), in press (arXiv:1211.6752)
- Huertas-Company et al. (2011) Huertas-Company, M., Aguerri, J. A. L., Bernardi, M., Mei, S., & Sánchez Almeida, J. 2011, A&A, 525, A157
- Méndez-Abreu et al. (2010) Méndez-Abreu, J., Sánchez-Janssen, R., & Aguerri, J. A. L. 2010, ApJ, 711, L61
- Méndez-Abreu et al. (2012) Méndez-Abreu, J., Sánchez-Janssen, R., Aguerri, J. A. L., Corsini, E. M., & Zarattini, S. 2012, ApJ, 761, L6
- Nair & Abraham (2010) Nair, P. B., & Abraham, R. G. 2010, ApJS, 186, 427
- Sánchez-Janssen et al. (2010) Sánchez-Janssen, R., Méndez-Abreu, J., & Aguerri, J. A. L. 2010, MNRAS, 406, L65
- Zibetti et al. (2009) Zibetti, S., Charlot, S., & Rix, H.-W. 2009, MNRAS, 400, 1181