Heterogeneous relaxation dynamics in amorphous materials under cyclic loading
Abstract
Molecular dynamics simulations are performed to investigate heterogeneous dynamics in amorphous glassy materials under oscillatory shear strain. We consider three-dimensional binary Lennard-Jones mixture well below the glass transition temperature. The structural relaxation and dynamical heterogeneity are quantified by means of the self-overlap order parameter and the dynamic susceptibility. We found that at sufficiently small strain amplitudes, the mean square displacement exhibits a broad sub-diffusive plateau and the system undergoes nearly reversible deformation over about cycles. Upon increasing strain amplitude, the transition to the diffusive regime occurs at shorter time intervals and the relaxation process involves intermittent bursts of large particle displacements. The detailed analysis of particle hopping dynamics and the dynamic susceptibility indicates that mobile particles aggregate into clusters whose sizes increase at larger strain amplitudes. Finally, the correlation between particle mobilities in consecutive time intervals demonstrates that dynamic facilitation becomes increasingly pronounced at larger strain amplitudes.
pacs:
61.43.-j, 66.30.Pa, 62.20.F-, 83.10.RsI Introduction
Understanding the relationship between atomic structure and mechanical properties in amorphous materials is important in many current applications and emerging technologies Ediger12 . In contrast to crystalline solids, where the plastic deformation is governed by dislocations, it was originally found that the plastic activity in amorphous materials is controlled by the localized shear transformations Argon79 , which were more recently studied using computer simulations Falk98 ; Maloney06 ; Tanguy06 ; Delogu08 and directly visualized in experiments on colloidal glasses Weitz07 ; Weeks10 and foams Dennin08 . Under the applied strain, the deformation of amorphous materials is determined by the cooperative organization of irreversible rearrangements of small clusters of particles, which could be triggered by the nonlocal redistribution of elastic stress Maloney04 ; Demkowicz05 ; Lemaitre09 ; Martens11 . The sequence of such plastic events can lead to an avalanche process characterized by a power-law scaling of the average stress or energy drops with the system size Jacobsen07 ; Procaccia09 . Another notable examples of systems with intermittent, spatiotemporal heterogeneous dynamics include the Barkhausen crackling noise in magnets subject to an external magnetic field Colaiori08 and the driven block-spring model in the theory of self-organized criticality Bak87 ; BakNature .
In recent years, computer simulations have become an increasingly important tool for studying slow particle dynamics in molecular liquids near the glass transition at thermal equilibrium Berthier11 . A common observation is that the mean square displacement of individual particles is reduced upon approaching the glass transition temperature from above, which also results in broadening of the sub-diffusive plateau that separates the ballistic and diffusive regimes. More importantly, however, is that the particle mobility in the sub-diffusive regime can be significantly different from the average value; and, in addition, the particles with similar mobility become spatially correlated, thus leading to dynamic heterogeneity Cavagna09 ; Donati98 ; Harrowell99 . The spatial fluctuations of mobile regions are characterized by the four-point dynamic correlation function, and they can be efficiently measured by computing the variance of the self-overlap order parameter, or the dynamic susceptibility Glotzer00 ; Glotzer03 . While no obvious changes in spatial correlations of particle positions are detected near the glass transition, the dynamic susceptibility provides an estimate of the number of particles involved in the correlated motion. It is now well recognized that when a liquid is cooled toward the glass transition temperature, the peak value of the dynamic susceptibility increases, indicating that dynamics becomes spatially increasingly correlated Berthier11 . More recently, it was shown that in the presence of steady shear flow, the dynamics of supercooled liquids is more homogeneous as the shear flow reduces the dynamic correlation length and the lifetime of dynamical heterogeneity Yamamoto12 .
The microscopic mechanism of structural relaxation in glassy materials is governed by spatially extended domains of fast moving particles that can be identified from the analysis of individual particle trajectories. Hopping particle dynamics was recently studied in a number of systems, i.e., binary mixtures below the glass transition Vollmayr04 , supercooled liquids at thermal equilibrium BiroliPRL10 , dense granular media BiroliPRL09 ; BiroliEPL10 , and actively deformed polymer glasses Rottler10 . In each case, a particle trajectory was decomposed into a series of segments, where motion takes place inside a cage, separated by fast cage jumps. Of particular importance is the analysis of cage jumps and their spatio-temporal clusterization performed in the cyclic shear BiroliPRL09 and the fluidized bed BiroliEPL10 ; GlotzerNat07 experiments of two-dimensional granular media. In both experiments, it was found that the major structural relaxation events are well correlated with the bursts of cage jumps. Furthermore, these cage jumps tend to aggregate into clusters, whose sizes are approximately power-law distributed BiroliPRL09 ; BiroliEPL10 . In turn, several clusters might dynamically facilitate each other and form avalanches, which propagate along the soft regions of the system BiroliPRL09 ; BiroliEPL10 ; BiroliPRL10 . One of the motivations of the present study is to examine the collective motion of particles and dynamic facilitation in periodically deformed three-dimensional amorphous materials.
In this paper, molecular dynamics simulations are employed to study the relaxation dynamics in the Kob-Andersen Lennard-Jones binary mixture model at a finite temperature well below the glass transition. The three-dimensional system is periodically strained over many cycles, probing regions with low instability thresholds, which leads to intermittent localized rearrangements of particles. We find that at sufficiently large strain amplitudes the particle dynamics is purely diffusive, while at lower amplitudes, the mean square displacement develops an extended sub-diffusive plateau. The analysis of the dynamical susceptibility and particle hopping dynamics reveals the spatial heterogeneity of structural relaxation.
The rest of the paper is organized as follows. The details of molecular dynamics simulations are described in the next section. The results for the particle diffusion, hopping dynamics, and microstructure of clusters of mobile particles, as well as the analysis of the two and four-point correlation functions are presented in Sec. III. The conclusions are given in the last section.
II Molecular dynamics simulation model
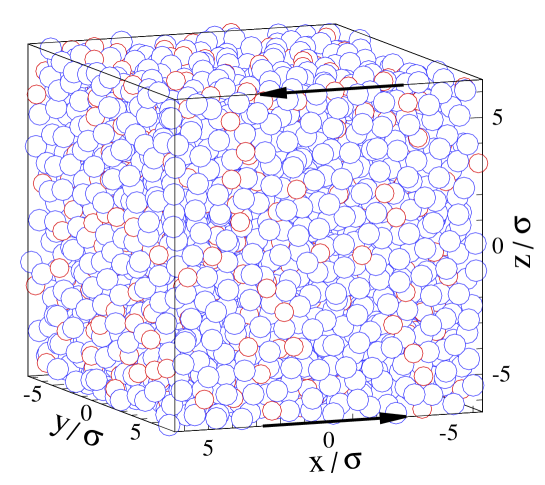
The three-dimensional amorphous material is modeled as the Kob-Andersen binary (80:20) Lennard-Jones mixture with non-additive interaction parameters that prevent crystallization KobAnd95 . The snapshot of the equilibrated system which consists of particles is presented in Fig. 1. In this model, any two particles interact via the pairwise Lennard-Jones (LJ) potential
| (1) |
where , , , , , and . The cutoff radius is taken to be twice the minimum position of the LJ potential Varnik04 ; Varnik06 . In what follows, the units of length, mass, and energy are set to be , , and , and, correspondingly, the unit of time is defined as . The equations of motion were solved numerically using the fifth-order Gear predictor-corrector algorithm Allen87 with a time step .
All simulations were performed at a constant volume with the total density and temperature , where is the Boltzmann constant. This temperature is well below the value at which the computer glass transition is detected KobAnd95 . The constant temperature was maintained by rescaling the velocity component in the direction (perpendicular to the plane of shear). As indicated in Fig. 1, the system dimensions are measured , , and . In order to simulate homogeneous, time-dependent shear strain, the Lees-Edwards periodic boundary conditions Allen87 were implemented with the SLLOD equations of motion Evans92 . It should be mentioned that in contrast to the boundary-driven shear algorithms, the spatially homogeneous shear strain prevents the formation of shear bands VarnikBBB03 .
The time-periodic shear strain was imposed (in the plane) by varying the strain rate as a function of time , where is the oscillation frequency and is the strain rate amplitude. We define the strain amplitude as a ratio of the strain rate amplitude over the frequency, i.e., . For the results reported in this paper, the oscillation frequency was set , with the corresponding period ; and the strain amplitude was varied in the range .
The system was first equilibrated for about MD steps at a constant volume and temperature in the absence of shear, and then gradually quenched to the final temperature with steps of . After the oscillatory shear strain was applied, the first MD steps were discarded to avoid quench-rate and aging effects. During the oscillatory motion, the measurements of particle positions were taken every back and forth cycle when strain is zero. The data were accumulated over cycles (about MD steps) at each strain amplitude, and the post-processing analysis of particle trajectories was performed in six independent systems.
III Results
At the studied temperature and density, an equilibrated model glass in the absence of deformation is characterized by the amorphous liquid-like molecular structure where most of the atoms remain in cages formed by their neighbors on the time scale accessible to computer simulations KobAnd95 . A typical steady shear stress–strain response involves an elastic deformation at strains below a few percent and a yield stress that depends on the physical aging and strain rate Varnik04 ; Rottler05 . During the elastic and plastic deformations, the atoms can undergo non-affine, irreversible displacements, which, depending on the strain, might form cascades spanning a considerable fraction of the system BarratCh8 . Thus, instead of temperature, the consecutive irreversible displacements of atoms are governed by the strain rate as a control parameter Tsamados10 . In the present study, the amorphous material is periodically deformed, and the particle positions are saved every cycle at zero strain. In such a setup, the affine deformation field, which is present at steady shear strain, is zero; and, therefore, any irreversible particle rearrangements will contribute to the structural relaxation of the material.
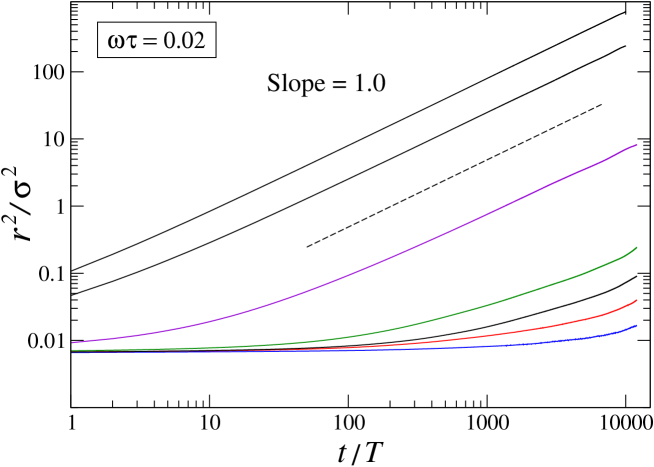
The mean square displacement (MSD) averaged over both and particles is plotted in Fig. 2 as a function of time for the frequency and various strain amplitudes. To compute the displacement, the position of the system center of mass was subtracted from the position of each particle. It can be observed in Fig. 2 that at small strain amplitudes, , the MSD curves exhibit a broad sub-diffusive plateau, which becomes more pronounced at smaller strain amplitudes, and a gradual crossover to diffusive motion. In contrast, at larger strain amplitudes, , the sub-diffusive regime is absent, and the slope of the MSD curves becomes equal to one at times as indicated by the straight dashed line in Fig. 2. At the largest time interval , the particle displacement is still about the cage size for the strain amplitude , which implies that during the periodic deformation the system dynamics is nearly reversible. Note also that the ballistic regime is not observed in any of the MSD curves as it occurs at times much smaller than the oscillation period .
The appearance of the extended sub-diffusive plateau in the MSD curves reported in Fig. 2 suggests that the particle dynamics might be spatially heterogeneous on the length scales of about the cage size. The structural relaxation in amorphous materials is commonly quantified via the self-correlation function, which is defined as follows:
| (2) |
where is the displacement vector of the th particle, is the lag time, and is the probed length scale BiroliPRL05 . In turn, the extent of dynamical heterogeneity is measured by the four-point correlation function, or the dynamical susceptibility, which is computed as the variance of the self-correlation function:
| (3) |
where the brackets denote averaging over all particles and initial times Glotzer00 . At a given time lag, the correlation function provides an estimate of the number of particles involved in a cooperative displacement over the length scale Berthier11 . At some intermediate time and length scales, the function usually displays a maximum indicating the largest spatial correlation between localized particles Glotzer00 .
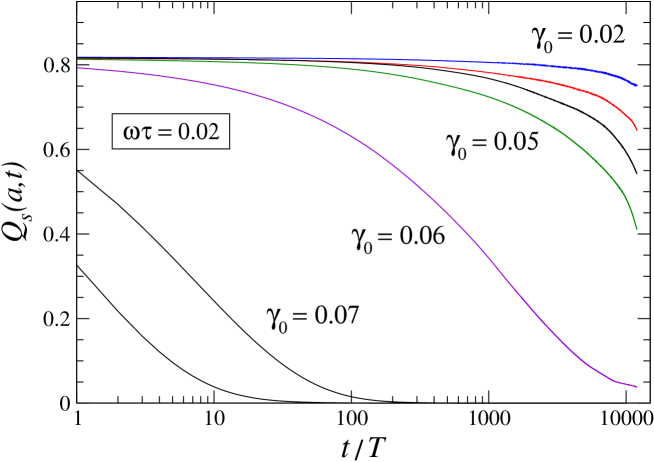
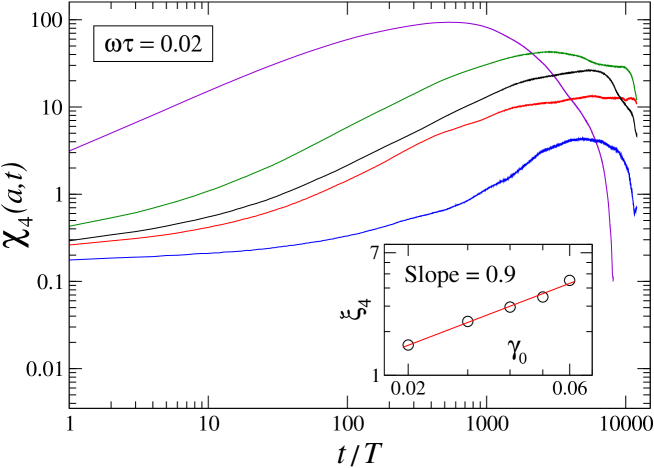
The time dependence of the self-correlation function is illustrated in Fig. 3 when and the parameter is slightly larger than the cage size, i.e., . As is evident, the correlation function decays faster at larger strain amplitudes. Note that at smaller strain amplitudes , the system is not fully relaxed even at the largest time interval . On the other hand, at the smallest time interval , the function is less than because of the thermal vibrations inside a cage. Further, the dynamic susceptibility is shown in Fig. 4 for the same parameters and . It can be observed that the correlation function exhibits a pronounced peak, whose magnitude increases at larger strain amplitudes, indicating progressively larger size of dynamically correlated regions. Upon increasing strain amplitude, the peak is displaced to smaller times, which is consistent with the onset of the diffusive regime in MSD curves reported in Fig. 2. Finally, assuming that the correlated regions are compact, the dynamic correlation length can be estimated from the peak value of at . The inset in Fig. 4 shows as a function of the stain amplitude. It is seen that the data are well fitted by the power-law function with the exponent of about (straight red line in Fig. 4). One should keep in mind, however, that the dynamic susceptibility is an averaged quantity, which measures mean square fluctuations of the number of mobile particles, and, thus, it does not completely describe the microscopic mechanism of structural relaxation. We next perform a more detailed analysis of the particle hopping dynamics and the local microstructure of clusters of mobile particles.
At sufficiently low temperature and small strain, a typical particle trajectory in a glassy material consists of rapid hopping events separated by the rattling motion within a cage. Hence, the hopping dynamics is controlled by the cage-to-cage jumps, which, in practice, can be identified by a numerical algorithm recently introduced by Candelier et al. BiroliPRL09 . In essence, this algorithm is based on the spatial separation of two consecutive segments of a particle trajectory. More specifically, the measure of the distance separating two segments is defined by the product of the root mean square distances between all points within the segments to the center of mass of the other segment BiroliPRL09 . Furthermore, the effective distance between two segments is normalized by a factor that counterbalances large fluctuations arising from averaging over short segments. During the iterative procedure, the cage jumps are detected if the effective distance is greater than the typical cage size; and the whole trajectory is consecutively divided into a number of segments where the particle motion takes place inside a cage. This algorithm was successively applied to identify cage jumps in two-dimensional granular systems under cyclic loading BiroliPRL09 , in the fluidized bed experiment BiroliEPL10 , and in supercooled liquids at mechanical equilibrium BiroliPRL10 .
In the present study, the cage detection algorithm was used to analyze three-dimensional trajectories of individual particles as follows. First, we choose a subset of points in the particle trajectory, divide the subset in two adjacent segments, and then compute the effective distance separating these two segments. If the effective distance between any two adjacent segments within the subset is less than the cage size, , then the particle was considered being in the cage during the time interval defined by the subset. For every particle, the procedure was repeated for all time intervals greater than and less than and all initial times. As a result, all particle trajectories were decomposed into successive cages separated by cage jumps, which typically consist of several consecutive points each. A visual examination of the trajectories revealed two types of jumps; namely, reversible, where a particle jumps back and forth between the averaged positions, and irreversible, where a particle permanently escapes its cage. This is consistent with the results of previous MD studies of glassy systems at equilibrium Hansen88 ; Wahnstrom91 ; Vollmayr04 .
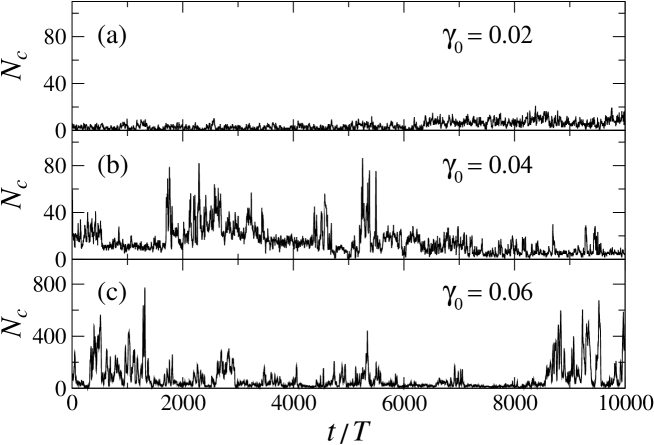
Figure 5 shows the total number of particles undergoing cage jumps as a function of time for three representative cases at strain amplitudes . It is clearly observed that the periodic deformation generates a heterogeneous temporal response characterized by intermittent bursts of large particle displacements. It is apparent that the amplitude of the bursts and frequency of their occurrence increase at larger strain amplitudes. During the time intervals between the bursts, we also detect a finite number of cage jumps that are assisted by thermal activation. Following tradition, the frequency spectrum of the data series in Fig. 5 was determined by computing their discrete Fourier transform. Within the reported time interval, the power spectrum at each strain amplitude exhibits a power-law decay with the exponent of about two (not shown), which is indicative of a simple Brownian noise. This is in contrast with the inverse frequency spectrum of the so-called flicker noise found in many complex systems that are characterized by scale-invariant avalanche-like processes and described by the phenomenon known as self-organized criticality Bak87 ; BakNature ; Vollmayr06 .
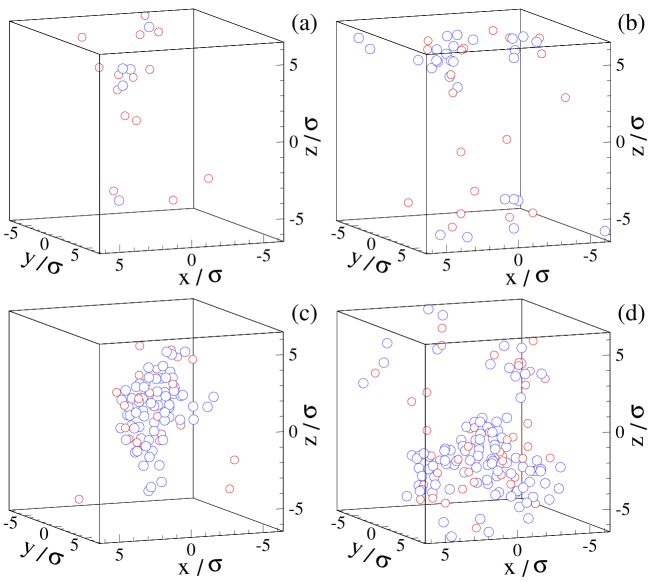
A more direct evidence of spatial heterogeneity can be obtained from visualization of instantaneous positions of mobile particles. Snapshots of mobile particle positions during intermittent bursts are presented in Fig. 6 for different strain amplitudes. It is clearly seen that the particles undergoing cage jumps mostly aggregate into clusters whose sizes increase at larger strain amplitudes. A number of previous studies of heterogeneous dynamics in glassy materials have demonstrated that the sizes of clusters of mobile particles are power-law distributed Vollmayr06 ; BiroliPRL09 ; BiroliEPL10 . As shown in Fig. 5, the structural relaxation process involves only a few large-scale cooperative clusters during the time interval , and, as a consequence, we find that the probability distribution of cluster sizes of more than about particles is subject to large statistical uncertainty (not shown).
It was recently suggested that dynamic facilitation might be one of the important mechanisms leading to spatio-temporal heterogeneity in glassy materials Chandler03 . In the context of kinetically constrained models, dynamic facilitation can be quantified either by the mobility transfer function between highly mobile regions and nearby regions that were previously mobile, or by the facilitation volume, which measures the spatial extent of mobile regions initiated by localized excitations Keys12 . In MD simulations of glass-forming liquids, the mobility transfer function was computed for mobile particles near their neighbors that were previously mobile Glotzer04 ; Glotzer05 . In particular, it was demonstrated that mobility propagates continuously through the system, and dynamic facilitation becomes increasingly pronounced upon supercooling Glotzer04 ; Glotzer05 .
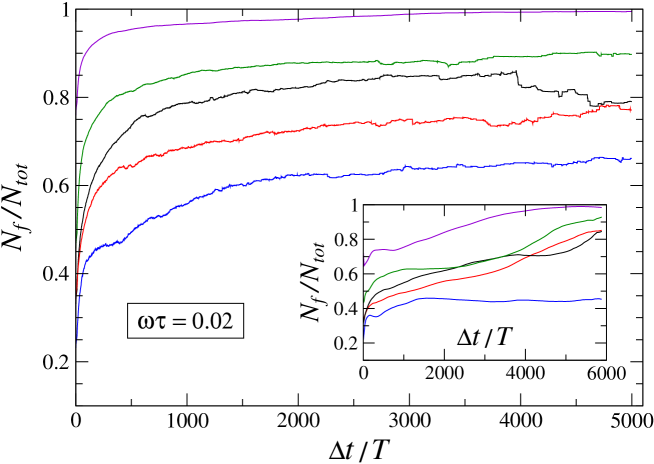
In the present study, two measures of dynamic facilitation were considered based on the results of the cage detection algorithm applied to individual particle trajectories. First, it was determined whether a particle was mobile at a given time step and it remained immobile during the preceding time interval . Next, we checked if the particle had at least one mobile nearest neighbor during the time interval . Figure 7 shows the ratio of dynamically facilitated mobile particles and the total number of particles that become mobile after cycles. It can be seen that the ratio increases with increasing strain amplitude, implying that dynamic facilitation plays a more important role at larger strain amplitudes. Note also that at the strain amplitude and , nearly all particles undergo cage jumps after being in contact with mobile regions. In contrast, at the strain amplitude , the ratio appears to saturate at about , which characterizes the relaxation dynamics that involves single particles undergoing reversible jumps and rearrangement of small clusters of particles [e.g., see Fig. 6 (a)].
Similar to the analysis presented in the previous MD studies Glotzer04 ; Glotzer05 , we also computed the correlation between particle mobilities in back-to-back time intervals of equal duration . Namely, we only selected particles that were mobile at least once during the time interval but always immobile during the preceding time interval . Then, the dynamically facilitated mobile particles were identified if there was at least one mobile nearest neighbor during the preceding time interval . The results are shown in the inset of Fig. 7. Although the data are somewhat noisy, the trend is clear; an increasingly larger fraction of mobile particles are dynamically facilitated at larger strain amplitudes. Thus, regardless of the definition, the results of numerical simulations indicate that, as the strain amplitude increases, there is a higher probability to find a mobile particle that was previously located near mobile regions.
IV Conclusions
In this paper, we performed molecular dynamics simulations to study heterogeneous relaxation dynamics in an amorphous material under time-periodic shear strain deformation. The three-dimensional amorphous material was modeled as the binary Lennard-Jones mixture at a temperature well below the glass transition. During the oscillatory deformation, the particle positions were stored every cycle when the net strain is zero. We found that at small strain amplitudes, the mean square displacement develops an extended sub-diffusive plateau followed by the diffusive regime; whereas at larger amplitudes only the diffusive regime is present at the reported time scales.
The structural relaxation was described by the decay of the self-overlap correlation function, which indicated that at small strain amplitudes the system dynamics is nearly reversible over about cycles, while at strain amplitudes above a few percent, almost all particles undergo irreversible displacements and escape their cages. With increasing strain amplitude, the dynamic susceptibility exhibits a pronounced peak at intermediate time and length scales, and the magnitude of the peak increases at larger strain amplitudes, indicating progressively larger size of dynamically correlated regions. Furthermore, the detailed analysis of particle hopping dynamics revealed that the periodic deformation generates a heterogeneous temporal response characterized by intermittent bursts of large particle displacements. Lastly, our numerical simulations have shown that dynamic facilitation of mobile particles becomes increasingly important as the strain amplitude increases.
Acknowledgments
Financial support from the National Science Foundation (CBET-1033662) is gratefully acknowledged. Computational work in support of this research was performed at Michigan State University’s High Performance Computing Facility.
References
- (1) M. D. Ediger and P. Harrowell, J. Chem. Phys. 137, 080901 (2012).
- (2) A. S. Argon, Acta Metall. 27, 47 (1979).
- (3) M. Falk and J. Langer, Phys. Rev. E 57, 7192 (1998).
- (4) C. E. Maloney and A. Lemaitre, Phys. Rev. E 74, 016118 (2006).
- (5) A. Tanguy, F. Leonforte, and J.-L. Barrat, European Physical Journal E 20, 355 (2006).
- (6) F. Delogu, Phys. Rev. Lett. 100, 255901 (2008).
- (7) P. Schall, D. A. Weitz, and F. Spaepen, Science 318, 1895 (2007).
- (8) D. Chen, D. Semwogerere, J. Sato, V. Breedveld, and E. R. Weeks, Phys. Rev. E 81, 011403 (2010).
- (9) M. Lundberg, K. Krishan, N. Xu, C. S. O’Hern, and M. Dennin, Phys. Rev. E 77, 041505 (2008).
- (10) C. E. Maloney and A. Lemaitre, Phys. Rev. Lett. 93, 016001 (2004).
- (11) M. J. Demkowicz and A. S. Argon, Phys. Rev. B 72, 245206 (2005).
- (12) A. Lemaitre and C. Caroli, Phys. Rev. Lett. 103, 065501 (2009).
- (13) K. Martens, L. Bocquet, and J.-L. Barrat, Phys. Rev. Lett. 106, 156001 (2011).
- (14) N. P. Bailey, J. Schiotz, A. Lemaitre, and K. W. Jacobsen, Phys. Rev. Lett. 98, 095501 (2007).
- (15) E. Lerner and I. Procaccia, Phys. Rev. E 79, 066109 (2009).
- (16) F. Colaiori, Adv. Phys. 57, 287 (2008).
- (17) P. Bak, C. Tang, and K. Wiesenfeld, Phys. Rev. Lett. 59, 381 (1987).
- (18) P. Bak, How Nature Works: The Science of Self-Organized Criticality (Copernicus, Springer-Verlag, New York, 1996).
- (19) L. Berthier and G. Biroli, Rev. Mod. Phys. 83, 587 (2011).
- (20) A. Cavagna, Physics Reports 476, 51 (2009).
- (21) C. Donati, J. F. Douglas, W. Kob, S. J. Plimpton, P. H. Poole, and S. C. Glotzer, Phys. Rev. Lett. 80, 2338 (1998).
- (22) D. N. Perera and P. Harrowell, J. Chem. Phys. 111, 5441 (1999).
- (23) S. C. Glotzer, V. N. Novikov, and T. B. Schroder, J. Chem. Phys. 112, 509 (2000).
- (24) N. Lacevic, F. W. Starr, T. B. Schroder, and S. C. Glotzer, J. Chem. Phys. 119, 7372 (2003).
- (25) H. Mizuno and R. Yamamoto, J. Chem. Phys. 136, 084505 (2012).
- (26) K. Vollmayr-Lee, J. Chem. Phys. 121, 4781 (2004).
- (27) R. Candelier, A. Widmer-Cooper, J. K. Kummerfeld, O. Dauchot, G. Biroli, P. Harrowell, and D. R. Reichman, Phys. Rev. Lett. 105, 135702 (2010).
- (28) R. Candelier, O. Dauchot, and G. Biroli, Phys. Rev. Lett. 102, 088001 (2009).
- (29) R. Candelier, O. Dauchot, and G. Biroli, Europhys. Lett. 92, 24003 (2010).
- (30) M. Warren and J. Rottler, J. Chem. Phys. 133, 164513 (2010).
- (31) A. S. Keys, A. R. Abate, S. C. Glotzer, and D. J. Durian, Nature Physics 3, 260 (2007).
- (32) W. Kob and H. C. Andersen, Phys. Rev. E 51, 4626 (1995).
- (33) F. Varnik, J. Chem. Phys. 125, 164514 (2006).
- (34) F. Varnik, L. Bocquet, and J.-L. Barrat, J. Chem. Phys. 120, 2788 (2004).
- (35) M. P. Allen and D. J. Tildesley, Computer Simulation of Liquids (Clarendon, Oxford, 1987).
- (36) D. J. Evans and G. P. Morriss, Statistical Mechanics of Nonequilibrium Liquids (Academic Press, London, 1990).
- (37) F. Varnik, L. Bocquet, J.-L. Barrat, and L. Berthier, Phys. Rev. Lett. 90, 095702 (2003).
- (38) J. Rottler and M. O. Robbins, Phys. Rev. Lett. 95, 225504 (2005).
- (39) J.-L. Barrat and A. Lemaitre, “Heterogeneities in amorphous systems under shear,” Chapter 8 in the book Dynamical Heterogeneities in Glasses, Colloids, and Granular Media (Oxford University Press, 2011).
- (40) M. Tsamados, Eur. Phys. J. E 32, 165 (2010).
- (41) O. Dauchot, G. Marty, and G. Biroli, Phys. Rev. Lett. 95, 265701 (2005).
- (42) H. Miyagawa, Y. Hiwatari, B. Bernu, and J. P. Hansen, J. Chem. Phys. 88, 3879 (1988).
- (43) G. Wahnstrom, Phys. Rev. A 44, 3752 (1991).
- (44) K. Vollmayr-Lee and E. A. Baker, Europhys. Lett. 76, 1130 (2006).
- (45) J. P. Garrahan and D. Chandler, Proc. Natl. Acad. Sci. USA 100, 9710 (2003).
- (46) Y. S. Elmatad and A. S. Keys, Phys. Rev. E 85, 061502 (2012).
- (47) M. Vogel and S. C. Glotzer, Phys. Rev. Lett. 92, 255901 (2004).
- (48) M. N. J. Bergroth, M. Vogel, and S. C. Glotzer, J. Phys. Chem. B 109, 6748 (2005).