Resolved Depletion Zones and Spatial Differentiation of N2H+ and N2D+111Based on observations carried out with the IRAM 30m Telescope, the IRAM Plateau de Bure Interferometer, and the Submillimeter Array. IRAM is supported by INSU/CNRS (France), MPG (Germany) and IGN (Spain).
Abstract
We present a study on the spatial distribution of N2D+ and N2H+ in thirteen protostellar systems. Eight of thirteen objects observed with the IRAM 30m telescope show relative offsets between the peak N2D+ () and N2H+ () emission. We highlight the case of L1157 using interferometric observations from the Submillimeter Array and Plateau de Bure Interferometer of the N2D+ () and N2H+ () transitions respectively. Depletion of N2D+ in L1157 is clearly observed inside a radius of 2000 AU (7″) and the N2H+ emission is resolved into two peaks at radii of 1000 AU (3.5″), inside the depletion region of N2D+. Chemical models predict a depletion zone in N2D+ and N2D+ due to destruction of H2D+ at T 20 K and the evaporation of CO off dust grains at the same temperature. However, the abundance offsets of 1000 AU between the two species are not reproduced by chemical models, including a model that follows the infall of the protostellar envelope. The average abundance ratios of N2D+ to N2H+ have been shown to decrease as protostars evolve by Emprechtinger et al., but this is the first time depletion zones of N2D+ have been spatially resolved. We suggest that the difference in depletion zone radii for N2H+ and N2D+ is caused by either the CO evaporation temperature being above 20 K or an H2 ortho-to-para ratio gradient in the inner envelope.
1 Introduction
The dense (n 105 cm-3), cold (T10 K) gas of starless or prestellar cores present one of the prime conditions for the formation of deuterated molecules in the interstellar medium. These conditions are needed to allow the formation of H2D+; reactions with this molecule and more highly deuterated isotopomers are the primary routes for molecules to gain molecular [D]/[H] ratios greater than the cosmic ratio of 10-5 within T 10 K gas (Watson, 1974; Langer, 1985). Furthermore, at these high densities and low temperatures, CO is frozen-out onto dust grains, increasing the rate of deuterium fractionation in the gas-phase, as CO is a primary destroyer of H and H2D+ (e.g. Bergin & Tafalla, 2007). A key molecular tracer of dense gas where CO has frozen out is N2H+ (e.g. Caselli et al., 2002). Its deuterated counterpart N2D+ is found to form with abundances relative to N2H+ of 5 - 10% in starless cores, with some extreme examples having 20 - 40% (Crapsi et al., 2005).
Shortly after the gravitational collapse of a starless core begins, a Class 0 protostar is formed within the dense core (Andre et al., 1993). This phase may last a few times 105 yr (Evans et al., 2009) and is accompanied by significant luminosity evolution and likely episodic accretion (Young & Evans, 2005; Kenyon et al., 1990; Dunham et al., 2010). The combination of protostellar and accretion luminosity has a significant effect on the chemical abundances in the surrounding envelope (Lee et al., 2004). Regions near the protostar are heated above 20 K (R 1000 AU for low-mass/low-luminosity systems) and CO is evaporated off the dust grains back into the gas phase. Then as the protostellar luminosity increases with time, the region of CO evaporation increases as does the region where H2D+ is converted back into HD and H. Thus, cold deuterium chemistry is brought to a halt in the inner envelope (Roberts & Millar, 2000; Caselli et al., 2008; Roberts & Millar, 2007).
Emprechtinger et al. (2009) showed that this process of a growing CO evaporation and H2D+ destruction region will affect the N2D+ to N2H+ ratio and demonstrated how it could be used as an evolutionary indicator. The youngest Class 0 protostars are expected to have higher N2D+ to N2H+ ratios than more evolved Class 0 protostars. This is because the inside-out growth of the CO evaporation and H2D+ destruction region causes the overall abundance of N2D+ to drop relative to N2H+, due to the formation of N2D+ (and other deuterated species) being most efficient at the highest densities. Thus, as the luminosity of the protostar increases with time, the N2D+ abundance will fall faster than the N2H+ abundance. The depletion zone of N2D+ may then be slightly larger (200 AU) than that of N2H+, shown by the chemical models in Emprechtinger et al. (2009).
Depletion zones of N2H+ have been spatially resolved previously, the most dramatic being IRAM 04191, with a 1600 AU radius N2H+ depletion zone (Belloche & André, 2004). Other apparent depletion zones were pointed in Chen et al. (2007) and Tobin et al. (2011); depletion zones of NH3 were also seen in some sources with N2H+ depletion regions (Tobin et al., 2011), as well as IRAM 04191 (Mangum et al. unpublished). However, most studies of deuterated molecules, in particular N2D+ (e.g. Roberts & Millar, 2007), are primarily based on single-dish, single-point observations and do not spatially resolve or map the emission. N2D+ and N2H+ emission maps have been observed toward many starless cores and one protostellar core (Crapsi et al., 2004, 2005). These studies find close agreement between N2H+ and N2D+ distributions; however, a larger sample of N2D+ maps toward protostellar sources are lacking.
In conjunction with the N2H+ kinematics survey of Tobin et al. (2011), we simultaneously observed N2D+ toward a set of thirteen low-mass protostellar systems. Furthermore, we execute more detailed analysis of the protostellar system L1157 where we resolve symmetric depletion zones in both molecules using high-resolution interferometric observations. The symmetry and likely filamentary nature of the dense protostellar envelope around L1157 (e.g. Gueth et al., 2003; Looney et al., 2007; Tobin et al., 2010; Chiang et al., 2010) make it an ideal system for examining the detailed spatial distribution of these species. The observations and data analysis are described in Section 2, the observational results of the spatial distribution of N2D+ relative to N2H+ in L1157 and twelve other systems are described in Section 3, we compare a chemical model to L1157 in Section 4, the results are discussed and possible causes of the spatial offset of N2D+ relative to N2H+ are given in Section 5, and our main conclusions are given in Section 6.
2 Observations
This paper includes observations taken with the Submillimeter Array, the Plateau de Bure Interferometer and the IRAM 30m telescope. The properties of the selected sample are given in Table 1, with our sample being a subset of those in Tobin et al. (2011). We detail the observations and data reduction in the subsequent sections and list the relevant details of the observations in Tables 2 and 3.
2.1 SMA data
L1157 was observed with the Submillimeter Array (SMA) at Mauna Kea on 2009 September 15 in sub-compact configuration. The weather conditions were optimal with stable phases and less than 3 mm of precipitable water vapor, yielding a zenith opacity at 225 GHz of 0.1; system temperatures were between 120 and 150 K throughout the track. The receivers were tuned to the N2D+ () transition (=231.321635 GHz; Lovas (1992)) in the upper-sideband and 800 MHz of each side band was allocated to continuum; see Table 2 for a summary of observation details. The data were edited and calibrated using the MIRIAD software package (Sault et al., 1995); minimal flagging of uncalibrateable data was necessary (i.e. phase/amplitude jumps) and the Tsys correction was applied, putting the data on a Jansky amplitude scale. The nearby quasars 1849+670 and 1927+739 were used for phase and amplitude calibration, Mars was used for absolute flux calibration, and the quasar 3C454.3 was the bandpass calibrator. Uncertainty in absolute flux calibration is expected to be 10%.
2.2 IRAM 30m data
Observations were taken with the IRAM 30m radio telescope on Pico Veleta using the EMIR receiver over several nights during 2009 October (Table 3). For L1157, we observed the N2D+ () (=154.217096 GHz) and () (=231.321966 GHz) transitions along with the N2H+ () (=279.511701 GHz) and () (=93.173404 GHz) transitions, see Table 3 for details. We also observed 11 other sources in the N2H+ () and N2D+ () transitions simultaneously. System temperatures were between 100 K and 140 K at 93 GHz and between 110 K to 230 K at 154 GHz, see Table 3.
All data were taken in frequency-switched On-The-Fly (OTF) mapping mode. For L1157 in particular, the N2D+ () and N2H+ () lines were mapped in a 90″ 90″ box centered on the protostar and N2H+ () and N2D+ () were observed in a 4′ 3′ box centered 30″ south of the protostar. Data for the additional sources were generally observed in 3′ 3′ regions centered near the protostar. The OTF maps were constructed by fully scanning each source in both the north-south and east-west directions (5″ steps between scan legs); the orthogonal mapping directions minimize striping in the final map. The maps were repeated when necessary for a higher signal-to-noise ratio. We conducted system temperature measurements (calibration scans) about every 10 minutes and about 2 hours were needed to complete each map. The pointing offset was measured once every two hours, preceeding the observation of each source. The offsets were generally 5″ and this offset was stable throughout an observing session, having variations of only 2″ from one pointing scan to the next. The RMS pointing accuracy of the telescope is 2″ and our observed variations are consistent with this. The receiver offsets between the 3 mm and 2 mm bands were 2″ and had been measured only a month before the data were taken; such a small offset will not affect our results.
The initial calibration of the OTF data to the antenna temperature scale and CLASS data format was performed automatically on-site by the Multichannel Imaging and calibration software for Receiver Arrays (MIRA)222http://www.iram.fr/IRAMFR/GILDAS package. The default amplitude calibration is expected to be accurate within 10%. Further data reduction was done using CLASS (part of GILDAS22footnotemark: 2). For all molecular lines observed, the frequency switched spectra were folded and baseline subtracted using a second order polynomial. We then reconstructed the spectral map on a grid such that the FWHM of the beam was spanned by 3 pixels and each pixel is the average of all measurements within the FWHM of the beam, see Tables 2 and 3, as well as Tobin et al. (2011) for additional details. Lastly, the emission maps were put on the Tmb scale where Tmb = FeffT/Beff. Feff is the forward efficiency, accounting for losses by the secondary support structure, and Beff is the main beam efficiency; values for Feff and Beff are dependent on frequency and given in Table 2.
2.3 PdBI data
L1157 was observed with the Plateau de Bure Interferometer in the N2H+ () transition in the D and C configurations in 2009 June and 2009 November. The data were edited, calibrated, and mapped using the CLIC and MAPPING components of the GILDAS software package. The absolute flux was derived from observations of MWC349, assuming a flux density of 1.15 Jy at 3 mm for that source; uncertainty in the absolute flux is 10%. More details on the data reduction are given in Tobin et al. (2011).
2.4 Single-Dish and Interferometric Combination
As an additional step, we combined the single-dish N2H+ data from the 30m with the PdBI data. We regridded the single-dish data to the phase center of the PdBI observations and resampled the velocity axis to correspond to the 0.125 km s-1 velocity resolution of the PdBI data. We did this using the MAPPING component of GILDAS, performing a joint deconvolution of the single-dish and interferometric data; GILDAS provides built-in routines for combining the 30m data. The resulting image provides substantially better extended structure sensitivity than the default interferometric image shown in Tobin et al. (2011).
We also explored the possibility of combining the single-dish N2D+ data with the SMA N2D+ data for L1157. Unfortunately, the single-dish N2D+ () data had a lower signal-to-noise ratio than the SMA data, prohibiting a useful combination of the data.
2.5 Data Analysis and Hyperfine Fitting
The nuclear spin of nitrogen causes both N2H+ and N2D+ to have a hyperfine emission line spectrum. The multiple hyperfine components and line ratios of N2H+ (Caselli et al., 1995; Keto & Rybicki, 2010) and N2D+ (Dore et al., 2004) enable us to simultaneously determine the line-center velocity, linewidth, optical depth, and excitation temperature at each point in the map.
CLASS was used to fit the hyperfine emission line structure, which can fit multiple lines given the optically thin line ratios and velocity offsets. The lines were fit at each pixel in the spectral map using a semi-automated routine. This routine used the integrated intensity map (zeroth moment) of the line emission, calculated from the total line intensity in a velocity range and multiplied by the channel velocity width. The pixels with at least a 3 detection of N2H+ or N2D+ were selected and a CLASS script to fit the hyperfine line structure at each pixel was generated; the resultant fit parameters (line-center velocity, linewidth, optical depth, and excitation temperature) were written out to a text table. This criteria does not require 3 detections of all line components and there were cases in which only the strongest hyperfine lines are detected. Bad fits resulting from inadequate signal-to-noise were removed to generate the final table of pixels with good fits. The typical failure mode of the fitting is excessively large linewidths (1.5 km s-1) and/or optical depths of 30, making the discrepant points easy to identify.
The integrated intensity, excitation temperature, and optical depths from line fitting are then used to calculate the column densities of the data following Goldsmith & Langer (1999). The column density maps generally trace regions where the integrated intensity was at least 6 and usually 10. We use the excitation temperature of the N2H+ () in the calculation of N2D+ column density when the N2D+ () optical depth is less than 1.0. This is because the excitation temperature cannot be well-constrained if the lines are optically thin. If the excitation temperature of N2D+ () is actually lower than that of N2H+ (), the N2D+ abundances would systematically underestimated. When the N2D+ excitation temperatures could be constrained from the hyperfine fitting, they are comparable but generally lower than the values fit for N2H+ (). The uncertainties in optical depth and excitation temperature lead to column density uncertainties of order 20% to 30%, in addition to a possible 10% amplitude calibration uncertainty. A few case have 100% uncertainty in the column densities due to large uncertainties in the optical depth.
We also computed spectra averaged within a 12″ radius (roughly the beamwidth at of the IRAM 30m at 93 GHz) centered on the position of each protostar. We used these spectra to derive average abundances and column densities toward the protostars for comparison with previous single-pointing studies (e.g. Roberts & Millar, 2007; Emprechtinger et al., 2009).
3 Observational Results
We obtained simultaneous N2D+ and N2H+ mapping of twelve protostellar envelopes, as well as interferometric data in both species for L1157. The best example of spatially resolved N2D+ and N2H+ depletion is found toward L1157 in the interferometric data. We will discuss this source in detail first before presenting the rest of the sample.
3.1 L1157
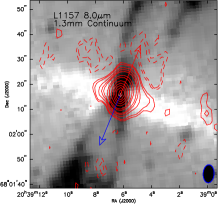
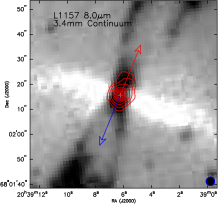
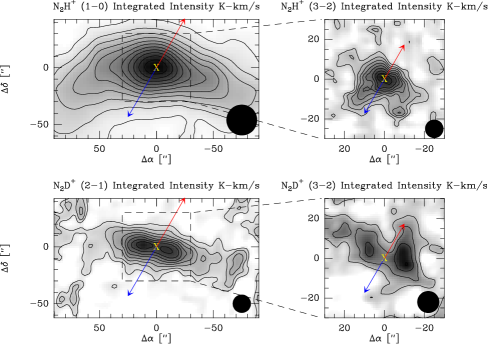
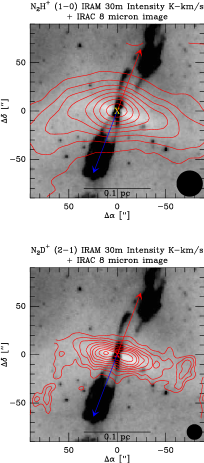
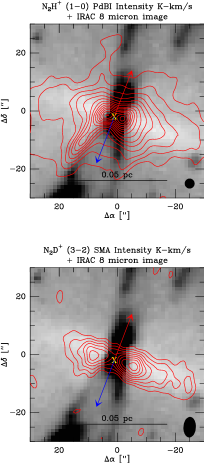
The SMA continuum and N2D+ () data (4.3″7.1″ resolution) for L1157 are shown in Figure 1, overlaid on the Spitzer IRAC 8 µm image. The 1.3 mm continuum data show that the source is strongly dominated by the point source emission coincident with the protostar, arising from the dense inner protostellar envelope. There is also extension along the outflow direction, likely due to warm gas associated with the inner outflow cavity. The outflow is nearly within the plane of the sky (Gueth et al., 1997) having an inclination of 85°. At lower intensity levels, the continuum emission is found to be extended along the dense envelope that was detected in extinction at 8 m (Looney et al., 2007; Tobin et al., 2010) and in N2H+/NH3 molecular line emission (Chiang et al., 2010; Tobin et al., 2011). This extension along the extinction lane was previously seen in the continuum with single-dish bolometer mapping at 850 µm and 1.3 mm (Gueth et al., 2003), but not in interferometric continuum data (Gueth et al., 1997, 2003; Chiang et al., 2010, 2012). The 3 mm continuum image from the PdBI is centrally peaked with no indication of extension along the envelope (Figure 1), consistent with Chiang et al. (2010). The detection of emission extended along the envelope with the SMA likely owes to the high-sensitivity of the observation, the short uv-spacings in subcompact configuration, and the brighter dust continuum emission at 1.3 mm as compared to 3 mm.
The N2D+ () integrated intensity map (Figure 1), unlike the continuum data, is double-peaked, roughly symmetric about the protostar, with a local minimum coincident with the position of the protostar. The peaks are at radii of 2000 AU (7″) from the protostar and the emission closely correlates with opaque regions of the 8 µm extinction feature. In contrast, the N2H+ integrated intensity map from the PdBI+30m has emission peaks that are located at R1000 AU (3.3″) from the protostar (Figure 1); the N2D+ emission peaks are 1000 AU further out. The double-peaked N2H+ emission appears at the same location in both the PdBI+30m image and the PdBI-only image from (Tobin et al., 2011). The symmetry about the protostar in N2D+ and N2H+ is striking, a strong indication that the protostar is affecting the abundance distribution of these molecules.
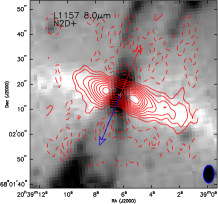
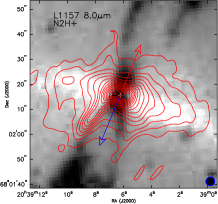
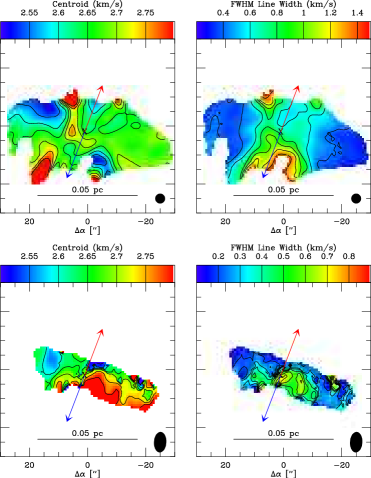
We also conducted single-dish mapping of N2H+ in the () and () transitions and N2D+ in the () and () transitions. The integrated intensity maps of these lines are shown in Figure 2 and spectra of all four lines toward the location of the protostar are shown in Figure 3. The N2H+ maps both appear centrally peaked and the () transition appears slightly elongated along the envelope axis, consistent with the resolved PdBI data. Both N2D+ maps show a double-peaked feature, coincident with the widely separated emission peaks observed in the SMA data.
The single-dish data having centrally peaked N2H+ () emission, double-peaked N2D+ () and () rule-out any excitation anomaly, optical depth, or interferometric filtering being responsible for the apparent central depletion of N2D+ emission around L1157. If the higher temperatures at smaller radii were causing the apparent central deficit of N2D+ (), then the N2H+ () should have appeared to be similarly double-peaked. Optical depth is ruled out because fitting the hyperfine transitions of N2D+ finds them to be optically thin; the optically thin nature of the emission is apparent in the spectra shown in Figure 3 where the satellite lines emission lines are quite faint relative to the main lines. Therefore, we conclude that the deficit of N2D+ emission toward the protostar and the offset between interferometric N2H+ and N2D+ peaks reflects a reduction of N2D+ abundance relative to N2H+ in the inner envelope.
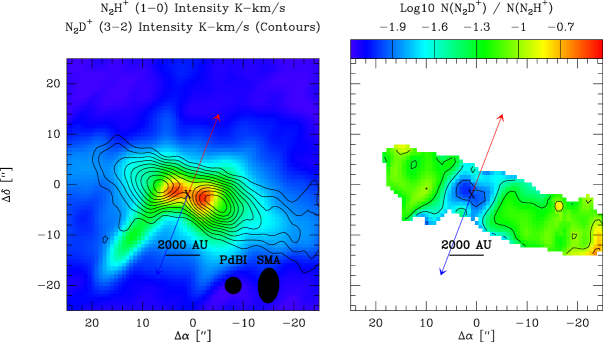
We used the interferometric N2H+ and N2D+ maps to construct column density maps of each species in order to construct a ratio map of N2D+ to N2H+. The N2H+ data have the single-dish data combined with the interferometer data to correct for missing flux. The N2D+ data have resolved out some flux, apparent from the negative contours in Figure 1; however, the total interferometric flux is comparable to the single-dish flux indicating that most emission is recovered in the SMA map. The SMA data were sampled with the same pixel scale and phase center as the PdBI data and we calculated the column densities for each transition following Goldsmith & Langer (1999). The excitation temperature for N2D+ was taken from the hyperfine fits of N2H+ () at each point because the N2D+ () was optically thin and the excitation temperature could not be determined from hyperfine fitting. Figure 4 shows the SMA N2D+ () emission contours overlaid on the PdBI+30m N2H+ () map and shows the column density ratio of N2D+ relative to N2H+ in the adjacent panel. We then take one dimensional radial cuts of the column densities and ratio and plot them in Figure 5.
The line parameters for the average N2H+ and N2D+ spectra within a 12″ radius around the protostar are given in Table 4 and the column densities and ratios are given in Table 5. We calculate that L1157 has 3 times the level of N2D+ as measured by Emprechtinger et al. (2009), but a similar N2H+ column density. This may result from us having mapped the area surrounding the protostar, while Emprechtinger et al. (2009) appear to have only taken spectra in single pointings centered on the protostar. In which case, the 16″ beam at the frequency of N2D+ () would not have sampled the region of peak N2D+ emission with only one pointing. The single-dish ratio is also an order of magnitude higher than the minimum observed in the interferometer data, mainly due to the N2H+ column density being about and order of magnitude larger in the interferometer data. The lower column density in the single-dish data can be attributed to beam dilution and if we consider the column densities and ratios at 3600 AU radii (12″), then the interferometer data are consistent with the single-dish.
3.2 Other Sources
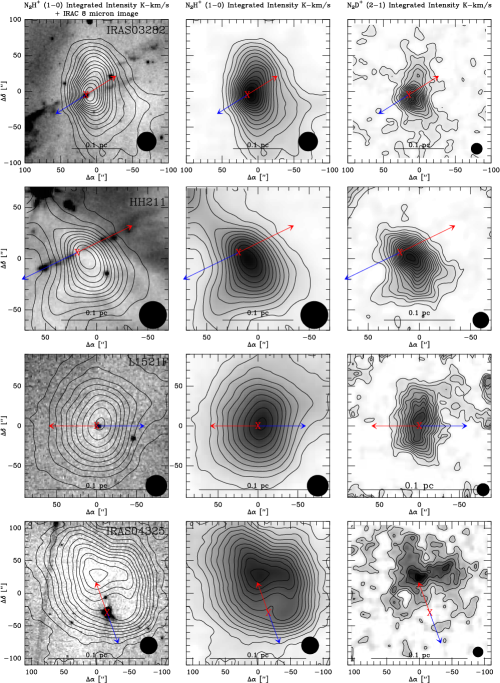
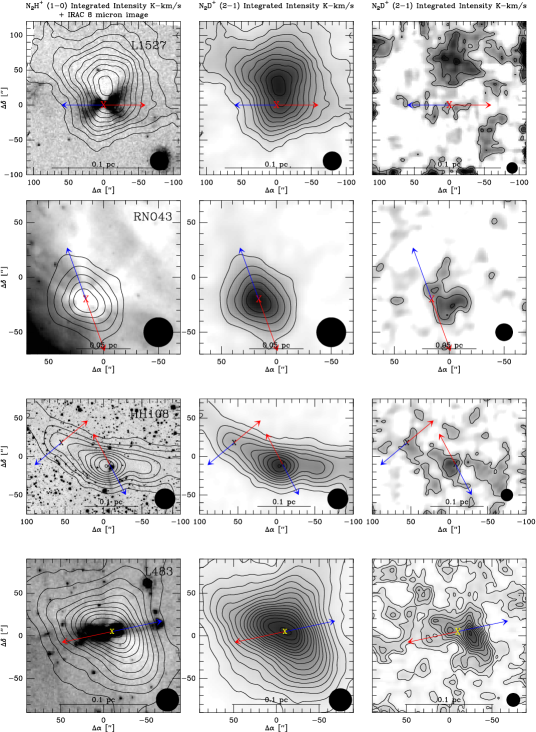
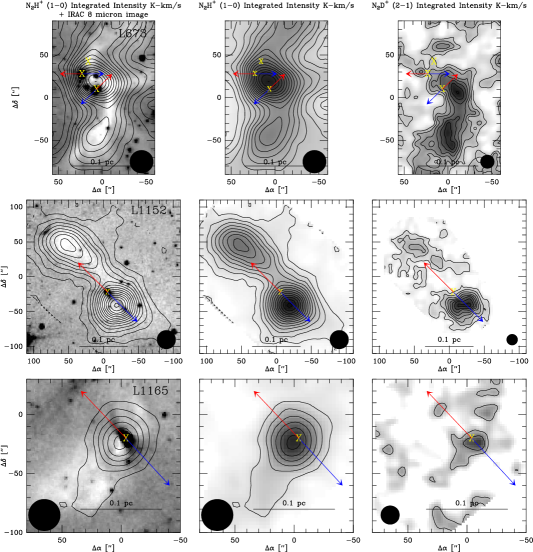
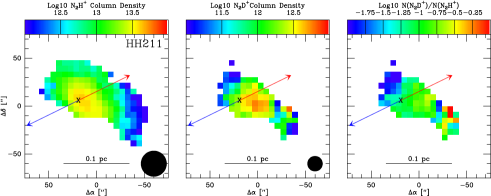
While we have given significant attention to L1157, observations of a larger sample show that N2D+ and N2H+ are often spatially differentiated and L1157 is not a special case. Figure 6 shows the N2H+ emission maps of the full sample overlaid on the IRAC 8 m images, compared with the N2D+ emission maps. Figure 7 shows the column density maps of N2H+, N2D+, and the ratio of N2D+ to N2H+ for HH211 as an example and only the ratio maps are shown for the rest of the sample in Figure 8. The column densities are calculated by the method described in Section 2, using the integrated intensity corrected for optical depth and excitation temperature. The parameters of the N2H+ and N2D+ line fits are given in Table 4 and our column densities and ratios are given in Table 5. Our calculated column densities and ratios are consistent with those in Emprechtinger et al. (2009) within about a factor of two. The differences likely result from our exact centering on the protostar and our 12″ radius for averaging the spectra to derive an overall column density and abundance ratio. The sources are briefly discussed individually below.
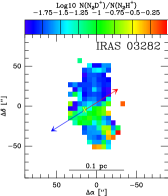
IRAS 03282+3035 – This source has a very dense envelope extended in the north-south direction, with nearly coincident N2H+ and N2D+ emission peaks. The ratio map indicates that the peak N2D+ abundance is offset from the protostar and N2H+ peak on one side only and to the south by 8″. This offset seems real and is larger than the 2″ receiver offset.
HH211 – This protostar was the most heavily deuterated object in Emprechtinger et al. (2009) and this is true of our sample as well (see Table 5), with a comparable ratio of N2D+ to N2H+. However, those measurements were toward the protostar position; the peak emission of N2H+ and N2D+ is offset to the southwest. Despite the N2H+ emission peak being offset from the protostar, the column density peak is centered on the protostar (Figure 7). The N2D+ column density peak is, however, offset southwest and the peak level of N2D+/N2H+is 0.28 at (-9″, 9″).
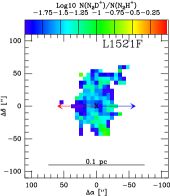
L1521F – This protostar was classified as a Very Low Luminosity Object (VeLLO) by Bourke et al. (2006) and was previously regarded as a starless core (Crapsi et al., 2004). The N2D+ emission peak may be slightly offset to the north relative to the N2H+; the overall spatial distribution of N2D+ appears quite flat; these maps are consistent with those of Crapsi et al. (2004). The column density ratio maps indicates that the N2D+ abundance may be reduced toward the central protostar.
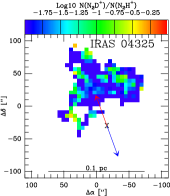
IRAS 04325+2402 – This protostar is a multiple Class I source in Taurus, but with a large, dense core in close proximity, approximately located at (10, 25) in Figure 6 and offset from the protostar by 63″ (Scholz et al., 2010; Hogerheijde & Sandell, 2000). The peak N2H+ emission is found to be north of the protostar, coincident with the nearby dense core seen in 8 µm extinction, with emission extending southward toward the protostars. The N2D+ emission is all located north of the protostar, coincident with the N2H+ peaks. The detection of N2D+ toward the protostar listed in Table 4 is marginal.
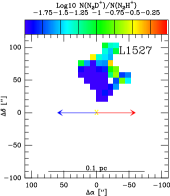
L1527 – L1527 is also in Taurus and Emprechtinger et al. (2009) did not detect N2D+ emission toward this source. However, we find that the N2D+ emission is concentrated north of the protostar by 70″ (10000 AU) and north of the N2H+ peak by 35″ (5000 AU), see Figure 6. Despite the large offset of N2D+ from the protostar, the submillimeter emission and 8 µm extinction are also more extended on the north-side of the protostar and coincide with the N2D+ emission (Tobin et al., 2010; Chandler & Richer, 2000). Roberts & Millar (2007) also detected N2D+ toward this source in a lower resolution study with comparable column density. Despite the Class 0 status of L1527, it is very depleted in N2D+ relative to others in the sample. This could result from the wide outflow cavities increasing the overall envelope temperature and driving down the deuteration.
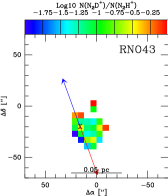
RNO43 – This source was the most distant in the sample, associated with Orion. Nonetheless, we did find that the N2D+ emission was spatially offset from the N2H+ emission, with the N2D+ mostly on the west side of the protostar. The column density and ratio map is quite noisy due to the faintness of N2D+; moreover, the abundance of N2D+ relative to N2H+ may be overestimated due to beam dilution of the N2H+ map, given that RNO43 has the lowest N2H+ column density in the sample.
HH108 IRS – In the case of this protostar, the N2D+ and N2H+ emission are both centered to the southeast of the protostar. Unfortunately, the signal-to-noise of the N2D+ was too poor to make a useful column density ratio map.
HH108 MMS – This is the nearby neighbor of HH108 IRS, but is apparently less evolved and lower luminosity. Its ratio of N2D+ to N2H+ is about 4 times greater than HH108 IRS, consistent with the apparent youth of this protostar relative to HH108 IRS. The N2D+ emission from his protostar might be offset, but the noisy map makes this indefinite.
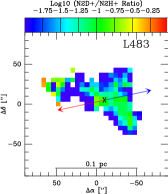
L483 – L483 is the strongest N2H+ source in the sample and most optically thick. The N2D+ emission peak is offset by 20″ west of the protostar, with the highest N2D+ to N2H+ ratio at the location of peak N2D+ emission. However, the column density ratio map (Figure 8) indicates that there could be higher column density N2D+ coincident with the highest column density of N2H+.
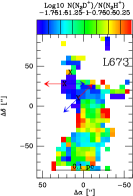
L673 – The subregion of L673 mapped coincides with L673-SMM2 as identified by Visser et al. (2002), harboring a small clustering of young stars. The sources marked in Figure 6 and 8 correspond to the Class 0/I sources 13, 27, and 28 in Tsitali et al. (2010). The N2D+ emission is clearly not peaked at the same location as the N2H+ emission and the column density is substantially reduced. The average N2H+ to N2D+ ratios are fairly constant and low for the three identified sources. However, the northern most source (28) may be at the location of higher N2D+ abundance as shown in the column density and ratio maps, but this is uncertain.
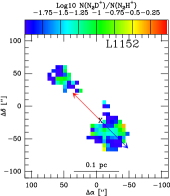
L1152 – L1152 is comprised of two cores seen in N2D+ and N2H+ emission linked by an apparent filament of material. The protostellar core in the south has strong N2D+ and N2H+ emission, but offset from the protostar. The peak N2D+ to N2H+ ratios in the south (protostellar) and north (starless) are 0.09 and 0.11 respectively.
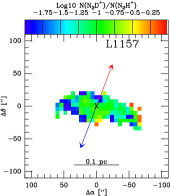
L1157 – We performed the same analysis on L1157 as the rest of the sample for completeness, the drop in N2D+ abundance is not apparent in the single-dish ratio map (Figure 8), but there is a slight depression of emission in the N2D+ () map. The average N2D+ to N2H+ ratio of 0.12 is consistent with averaging the minimum and maximum abundance ratio from the interferometer data.
L1165 – Similar to L483, the N2D+ emission is also shifted along the outflow in L1165. The emission does seem to extend back toward the N2H+ peak that is southeast of the protostar. The small area of N2D+ emission makes a ratio map uninteresting, but the source has one of the lowest ratios of N2D+ to N2H+ from the single-point analysis; however this could be affected by beam dilution.
Including L1157, eight of the thirteen sources show spatial shifts in the peak emission or column density of N2D+ relative to N2H+. Although L673 is included, it could be argued that it is different since its environment is more complex due to having several young stars within a 0.1 pc diameter region. It is also important to note that we are limited by resolution in many cases, so some sources could have shifts that are not detectable in the 30m data. The N2H+ and N2D+ shifts can be regarded with high confidence because the data were taken simultaneously and the receivers are aligned to within 2″ accuracy. The relative offset between N2H+ and N2D+ peaks are tabulated in Table 5. In addition to N2D+ being shifted relative to N2H+, there are also offsets between the peak emission of N2H+ and the protostars in six of the thirteen sources (HH108 IRS, L1152, L1165, HH211, L1527, and IRAS 04325+2402).
While spatial differentiation between the species is quite prevalent, the location of the peaks relative to the protostar is often not as well-ordered as L1157. We observe a trend in the sample in which the apparently youngest sources, as classified from their cold bolometric temperatures () (Table 1) (HH211, HH108MMS, IRAS 03282+3035, and L1521F) do not show as strong spatial differentiation between N2D+ and N2H+. The more evolved protostars (with warmer and wide outflows (Arce & Sargent, 2006)) have the largest spatial offset between N2D+ and N2H+ (L1527 and IRAS 04325+2402).
We also compare the N2D+ to N2H+ ratios to the bolometric luminosity and temperature in Figure 11. There is not a clear trend in bolometric luminosity, only that more luminous sources tend to have less deuteration while lower luminosity sources may be more highly deuterated or not. There does appear to be a trend of decreasing N2D+ to N2H+ ratio with increasing bolometric temperature, indicating that the deuteration may be decreasing with protostellar evolution. However, there is significant scatter at low bolometric temperatures.
3.3 Kinematics of N2D+ versus N2H+
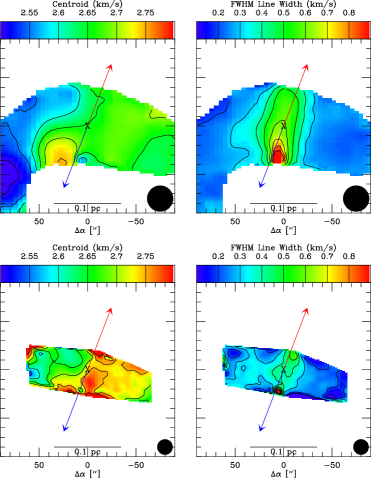
The difference in relative spatial distributions between N2D+ and N2H+ in most systems is an indication that these molecules are not tracing the same material throughout the envelope. This suggests that the kinematic structure probed by these tracers is likely different. We compare the kinematics of the two tracers for L1157 in Figures 12 & 13, using both single-dish and interferometric kinematics respectively. For L1157, we notice a similar large-scale velocity gradient in both N2H+ and N2D+; however, near the protostar, where the N2D+ abundance drops, there are clear differences. The line-of-sight velocities measured from N2D+ on the west side of the envelope appear systematically larger by about 0.1 km s-1 as compared to the N2H+ data; this is present in both the single-dish and interferometric data. This region is located near the blueshifted outflow cavity and could be due to N2H+ being entrained by the outflow (Tobin et al., 2011), skewing the line profile toward blue-shifted velocities. Since the N2D+ abundance is peaked at larger radii, it may not be affected by the outflow as strongly as N2H+. Thus, the N2D+ could be tracing an increased velocity gradient due to rotation and/or infall (Tobin et al., 2011, 2012) that is masked by the outflow interaction with N2H+.
The linewidth of N2H+ is also found to be larger than N2D+ within 10″ of the protostar in both the single-dish and interferometer data. Thus, the signature of the outflow-envelope interaction is not as pronounced in N2D+ due to its lower abundance on scales less than 2000 AU. This is a clear indication that on small-scales, the N2D+ is not tracing the same gas as N2H+. Moreover, this demonstrates that N2H+ is able to probe closer to the protostar and disk forming region of the envelope during this stage of evolution.
4 Chemical Model Comparison
L1157 represents an ideal case to test chemical models for a protostellar source due to the higher resolution data, excellent signal-to-noise, and well-known orientation in the plane of the sky. Moreover, the relative symmetry of the filamentary envelope (Tobin et al., 2010), N2H+, and N2D+ emission on scales less than 5000 AU make chemical modeling of this source more tractable. We will first review the critical chemical processes at work, affecting the formation and abundance of N2H+ and N2D+.
4.1 Relevant Chemical Processes
Deuterium chemistry in the cold (T 10 K) interstellar medium begins with the formation of H2D+, dominated by the reaction
| (1) |
where 230 K (Herbst, 1982). At low temperatures (T 20 K) the forward reaction will dominate causing H2D+ to have an abundance approaching that of H in cold, dense cores (Langer, 1985). The high abundance of reactive H2D+ enables subsequent deuterated molecules further down the reaction chain to have abundances elevated above the cosmic [D/H] 10-5, including D2H+ and D (Caselli et al., 2008; Pagani et al., 2009). The abundance of H2D+ is limited by recombination with electrons and reactions with other molecules. The back reaction can also become non-negligible at T 20 K, leading to decreased deuteration even before CO has been liberated from the dust (Emprechtinger et al., 2009).
At T 20 K, most CO is frozen-out onto dust grains at the densities of protostellar cores (n105 cm-3), but once the protostar raises the temperature to 20 K, the CO ice sublimates back to the gas phase. When CO is in the gas phase, all the available carbon not locked into dust grains will react, effectively shutting off the deuterium chemistry as initiated by H2D+; an additional route to deuterium fractionation is available through CH2D+at T 30 K, but this does not cause subsequent N2D+ formation. Furthermore, the H2 ortho-to-para ratio of the cloud can affect the overall deuterium fractionation; ortho-H2 is in the J=1 state with an energy above the ground of 170 K. This has enough energy to lower the potential barrier of the back reaction of Equation 1 even at low temperatures, making the overall level of deuteration sensitive to the H2 ortho-to-para ratio (Flower et al., 2006; Pagani et al., 2009).
The primary formation route for N2H+ is the gas phase reaction
| (2) |
and N2D+ is understood to form via the same process, but with H2D+ as the reactant. Thus, the ability to form N2D+ is constrained by the conditions in which H2D+ exists. Both N2D+ and N2H+ are destroyed by reactions with CO, therefore, they are only expected to be present with significant abundance in regions where CO has depleted. In low-mass/luminosity protostellar systems, the temperatures only rise above 20 K at radii less than 1000 AU. Thus, the results from chemical modeling lead us to expect N2D+ and N2H+ to trace the same gas where CO is frozen-out onto dust grains (e.g. Emprechtinger et al., 2009; Pagani et al., 2009).
4.2 Chemical Model
We compare our data with the evolutionary chemical model of Lee et al. (2004). Since L1157 has formed a protostar, a model that accounts for the infalling material as well as the evolution of radiative heating is important. This model endeavors to simulate the chemistry of an isolated protostellar cloud through the prestellar phase as approximated by a Bonnor-Ebert sphere and then transition to the protostellar phase using the inside-out collapse model (Shu, 1977) with an initially isothermal temperature of 10 K. The protostellar phase includes luminosity evolution following the prescription of (Young & Evans, 2005) with radiative transfer calculated by DUSTY, but not including episodic accretion bursts. The chemistry of the infalling gas parcels is calculated discretely and the inward radial motion is tracked within the model.
Since the chemical model calculates a 1D radial abundance profile, we took several steps to make a more realistic observational comparison. We used the input radial density profile from the chemical model and the calculated abundance profile to construct a circular envelope midplane. We then summed the density along the line of sight through the envelope to calculate the predicted column density distribution in order to compare with the observations. Since L1157 is likely a filament rather than a sheet (Tobin et al., 2010), we also tapered the circular sheet by a Gaussian along the assumed line of sight with scale height parameters of 500, 750, 1000, and 2000 AU in order to simulate a filamentary density distribution. However, we note that the chemical abundances calculated for a 1D density profile will not exactly map to a filamentary envelope, but should be a reasonable approximation. Our goal was not to fit L1157 in detail with the model, but to look for a general agreement with the observed radial distribution and abundance ratio of the two species.
In Figure 14, we show a plot of the N2D+ to N2H+ column density ratios as a function of radius from the model. We clearly see the drop in abundance of the two species at radii less than 1000 AU due to reactions with CO and their abundances peak at intermediate radii between 1000 and 5000 AU, with decreasing abundances at larger radii. The model that best fits the abundance ratio of L1157 has evolved for 300,000 yr after collapse and the luminosity of the model (5 L☉) is comparable to what is observed. While the abundance ratio of N2D+ relative to N2H+ matches the data reasonably well, the column density and abundance peaks of N2H+ and N2D+ are nearly coincident with each other, inconsistent with the data shown in Figure 14. Earlier and later timesteps of the model also show coincident peaks between these two molecules. Thus, predicted ratio of N2D+ and N2H+ is consistent with the model, but the absolute abundances/column densities are inconsistent.
It is important to point out that the column density peak of N2D+ is in agreement with the observed N2D+ column density peak and the N2H+ column density peak of the model is what disagrees with the observations. The inability of the model to reproduce the abundance peak offsets between the N2D+ and N2H+ may indicate that the models may not be capturing some physical process; we will discuss this further in the following section.
5 Discussion
It has been previously shown that the depletion of N2D+ relative to N2H+ is expected in protostars (Roberts & Millar, 2007; Emprechtinger et al., 2009), but the 1000 AU spatial differentiation between the peaks of the two species is not matched by our chemical modeling, nor that of Emprechtinger et al. (2009). Moreover, the only other study to recognize the spatial offset of N2H+ and N2D+ was Friesen et al. (2010) with observations of the protocluster Oph B2. However, such spatial offsets have not been observed toward individual/isolated protostellar systems previously. Spatially resolved observations of deuterated molecules relative to their normal counterparts offer crucial tests to chemical models and further our understanding of the evolution of deuterated molecules in protostellar systems.
5.1 N2H+ Depletion Zones
As pointed out in the introduction, a N2H+ depletion zone had been observed previously toward the Class 0 protostar IRAM 04191 (Belloche & André, 2004). This source is recognized as a Very Low Luminosity Object or VeLLO, having an internal luminosity of 0.1 L☉. The depletion zone in IRAM 04191 has a radius of 1600 AU, larger than that of L1157 and other protostars observed by Chen et al. (2007) and Tobin et al. (2011). However, the disappearance of N2H+ could be explained by either freeze-out onto dust grains, as apparently observed in the pre-stellar core B68 (Bergin et al., 2002), or the destruction of N2H+ due to CO being released from dust grains as a result of protostellar heating (e.g. Lee et al., 2004). Such a large depletion zone in IRAM 04191 produced via N2H+ destruction from evaporated CO would not work given the low system luminosity and Belloche & André (2004) suggested freeze-out of N2 onto dust grains as the likely mechanism for N2H+ depletion. Alternatively, Lee (2007) constructed an episodic accretion model that could also explain the size of the depletion zone with a recent burst of luminosity in IRAM 04191. L1157 and the other protostars known to have resolved N2H+ depletion zones are of order 5 to 10 L☉. These protostars could evaporate CO from dust grains out to sufficiently large radii with equilibrium heating to explain the size of the depletion zones.
5.2 Cause of N2H+ and N2D+ Emission Offsets
The inability of the chemical model used here (Lee et al., 2004) and others in the literature (Emprechtinger et al., 2009) to reproduce the relative offset of the column density peaks for both species is troubling at first. However, this may not mean that our understanding of the chemical processes forming and destroying the molecules is wrong. The presence of the central protostar, raising the gas and dust temperatures above 10 K introduces significant complexities to the chemistry within 2000 AU of the protostar, as compared to the pre-stellar phase. Moreover, since we are considering the radial abundances of two molecules, we must determine whether it is the N2D+ or N2H+ that is problematic.
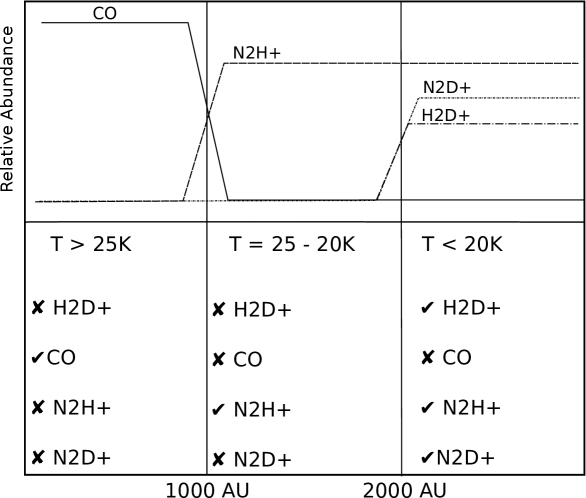
As outlined in the previous section, the reaction that forms H2D+, leading to the formation of N2D+, is only active at temperatures less than 20 K; at greater temperatures the H2D+ reacts with H2 and is converted back to H and HD (Equation 1). Furthermore, T 20 K is also the temperature at which CO is evaporated off of dust grains and can freely react with and destroy N2D+ and N2H+. A C18O map of L1157 detects an emission peak at the protostar and very little CO at radii larger than 1200 AU (Jørgensen et al., 2007), consistent with the location of the N2H+ abundance peaks. CO will destroy N2D+ as quickly as it destroys N2H+, so reactions with CO will affect the abundance distribution of both molecules in the same manner. In order to have an abundance peak of N2H+ inside that of N2D+, one needs to have a range of radii where the H2D+ abundance is reduced and CO is not significantly present in the gas phase. Figure 15 shows a schematic diagram of the spatial zones in L1157 where N2H+, N2D+, and the two molecules governing the spatial distribution of emission are located (CO and H2D+). Of these molecules, only observations of H2D+ are lacking.
The relevant processes in the protostellar envelope that could affect the spatial distribution of molecules are protostellar heating, outflows, and infall. Emprechtinger et al. (2009) presented chemical models that considered protostellar heating and the H2D+ abundances becoming reduced at radii somewhat larger than CO sublimation; however, the shifts of N2D+ peak abundances were only 200 AU outside of the N2H+ peak and unable to explain the 1000 AU offset in L1157. Replenishment of N2H+ and N2D+ via infall from the outer envelope is built into Lee et al. (2004) model, but N2H+ and N2D+ remain coincident at all time steps. Tobin et al. (2011) showed that the protostellar outflow is entraining N2H+ at the 1000 AU scale; however, such entrainment would affect N2D+ in the same way that it affects N2H+. Moreover, N2D+ does not appear to be significantly affected by the outflow as evidenced by its narrower linewidth than N2H+ (Figure 12).
Another possibility considered was episodic accretion (e.g. Kenyon et al., 1990; Dunham et al., 2010). If there was an accretion outburst, it could temporarily heat the envelope to T 20 K out to 2000 AU. Then all the H2D+ could have been converted back to H and HD. Moreover, CO would be liberated from the dust grains destroying the N2H+ and N2D+ present (Lee, 2007; Visser & Bergin, 2012). After the luminosity decreases and CO freezes back out, N2H+ would be able to form directly, while N2D+ would have to wait until H2D+ has reformed. Thus, we considered the possibility that N2H+ could reform faster than N2D+ since it is a one-step process and N2D+ takes two steps to form. While this scenario is attractive, work by Lee (2007); Visser & Bergin (2012) shows that the chemistry is governed by the CO freeze-out timescale after an accretion outburst and N2D+ and N2H+ should reform in lockstep. Thus, episodic accretion alone cannot adequately account for the observed spatial distribution of N2H+ and N2D+.
An additional scenario we considered is an H2 ortho-to-para (OPR) gradient in the envelope. The steady-state OPR in cold (T 10 K) clouds is calculated to be 2.710-3 Flower et al. (2006), whereas H2 forms with OPR = 3 from statistical equilibrium. OPR values larger than steady-state would decrease the deuteration by enabling the back reaction of H2D+ formation to be active (Equation 1). Since the protostar likely went through a cold starless phase with a duration of 104 to 106 yr the H2 OPR throughout the cloud was likely around the equilibrium value before collapse (Parise et al., 2011). Once the protostar forms and begins to heat the inner envelope, the OPR ratio could increase; Sipilä et al. (2010) shows a sharp increase at T 15 K. Such an OPR ratio gradient going into the warm inner envelope could explain the large region of N2D+ depletion. However, it is unclear if this could reproduce the observations given that the OPR is still quite low (10-4). There is also a question of timescales given that the steady-state timescale in Sipilä et al. (2010) is 105 yr, longer than the infall timescale for material to fall in from 2000 AU to 1000 AU ( 104 yr assuming a 0.5 protostar). While there are some problems with this scenario, it cannot be ruled out.
A final scenario to produce the observed abundance offsets is a CO evaporation temperature is higher than 20 K. The temperatures for H2D+ destruction and CO evaporation are quite close and if the CO evaporation temperature was even just a few degrees higher than 20 K, this could be enough to explain the observed emission offsets, as was true in the Emprechtinger et al. (2009) models. We illustrate this in Figure 15, where if the CO remained mostly frozen-out between 20 to 25 K, this could explain the emission offsets by enabling N2H+ to be present in this warmer region at smaller radii than N2D+. It is possible that the CO evaporation temperature could vary since the physical state of CO ice can be much more complex. The CO may be mixed with other ices: NH3, CO2,CH3OH, H2O, etc. The binding energy of CO to other ices tends to be strong than CO to CO (Collings et al., 2004; Fayolle et al., 2011), therefore ice mixtures having slightly larger evaporation temperatures could explain the observations. However, it is uncertain how mixed the ice is because some species tend to freeze-out more quickly, forming ice layers rather than a single mixed layer (Öberg et al., 2011). Aside from the caveat of unknown ice mixtures, a slightly altered evaporation temperature of CO ice due to mixing would explain our observations quite simply without needing episodic accretion and/or H2 OPR gradients. But, episodic accretion could cause more ice mixing and conversion of CO ice to CO2 may build an ice mixture with a large enough binding energy to remain frozen at T 20 K (Kim et al., 2012).
In summary, the abundance peak offsets between N2D+ and N2H+ could be explained by either an H2 OPR gradient in the inner envelope or an increased CO evaporation temperature due to ice mixtures. The chemical model of Lee et al. (2004) does not calculate a temperature dependent H2 OPR, which may explain why it does not reproduce the abundance peak offset between N2D+ and N2H+. At the same time, the model also does not allow for ice mixtures to increase the evaporation temperature CO, which could cause the N2H+ peak to move inward. However, the chemical model does have its N2D+ column density/abundance peak at roughly the same radius as the observations, this offers some evidence for the increased CO evaporation temperature scenario, i.e. the deuterium chemistry produced the expected results for N2D+ but N2H+ is divergent. Though, we cannot conclusively distinguish between these two scenarios as both seem likely to occur and could be simultaneously contributing to make the shift in abundance peaks stronger.
5.3 Envelope and N2D+/N2D+ Emission Morphology
An additional effect to consider is the viewing angle and three dimensional envelope density structure in relation to the observed N2D+ emission morphology. In the case of L1157, there is evidence that the envelope is filamentary rather than sheet-like (Tobin et al., 2010). A filamentary envelope can have two effects on the apparent N2H+ and N2D+ depletion zones. First, the depletion zones are likely more apparent in a filamentary geometry than in a axisymmetric sheet, due to less emission superimposed along the line of sight in than an axisymmetric object; this is demonstrated in the column density plots in Figure 14. Also, the orientation of a filament within the plane of the sky can change the apparent size of the depletion regions; however, viewing angle effects would only make the depletion regions smaller and not larger. Thus, no complicated viewing angle effects could give the illusion of large N2D+ depletion zones outside those of N2H+. In the case of L1157, we cannot attribute the observed morphology to observational bias due to the symmetry of the depletion zones and abundance peaks.
The rest of the sample is not as well-ordered as L1157 in terms of envelope structure and/or emission morphology. L1527, L1165, L1152, HH108 IRS, HH211, and IRAS 04325+2402 have N2H+ emission peaks that are not coincident with the protostar, but the N2D+ emission is never peaked closer to the protostar that N2H+. L483 and L1165 show N2D+ emission peaked in the direction of the outflow rather than perpendicular to it. In these cases of complex emission morphology, the heating of the protostar and the envelope structure are both contributing to the complex emission morphology. L483 shows N2H+, NH3, and 850 µm emission that are oriented at a 45° angle to the outflow direction (Fuller & Wootten, 2000; Shirley et al., 2000), roughly the same direction as the N2D+ emission. Therefore, the N2D+ emission apparently extended along the outflow is simply shifted in the direction of the high-density envelope structure and the highest density material is simply not perpendicular to the outflow.
Moreover, the envelopes with less complex structure near the protostar in 8 µm extinction and N2H+ (i.e. L1521F, IRAS 03282+3035, HH211, and L1157) do not have irregular N2D+ distributions. These sources, except for L1157, appear to have N2D+ emission peaks possibly shifted to one side of the envelope. Thus, we can conclude that if the envelope has highly irregular structure, then we expect this to create an irregular distribution of N2D+. Furthermore, the frequent offsets of N2D+ emission from the protostars, even though it may be coincident with the N2H+ peak, means that N2D+ is not tracing the densest material in protostellar cores. Thus, caution must be exercised when interpreting the kinematics of the deuterated species without observations of both as deuterated species cannot be relied upon to trace the densest and/or same material as non-deuterated in the presence of temperature gradients.
5.4 Chemical Evolution
It is important to stress that even though N2D+ and N2H+ are not always spatially coincident as previously assumed and indicated by chemical models, our results do not disagree with the generalized picture of chemical evolution in protostellar cores (e.g. Lee et al., 2004; Roberts & Millar, 2007; Emprechtinger et al., 2009). Specifically, the reduced abundance of N2D+ relative to N2H+ as protostar evolve is consistent with our data as shown in Figure 11 and the previous work; moreover, the spatial offsets of N2D+ relative to N2H+ appear to be a product of this chemical evolution and contribute to the relative decrease of N2D+ relative to N2H+. Given the two scenarios we outline for the cause of the peak offsets, further chemical modeling that accounts for infall, H2 OPR gradients, and changes in the CO evaporation temperature is needed to fully understand the exact cause. Sensitive, spatially-resolved observations of both C18O and H2D+ could determine if the increased evaporation temperature is likely, as we would expect to see a gap between the two species if this were the case.
6 Summary and Conclusions
We have presented a detailed study of the relative spatial distribution of N2D+ and N2H+ in Class 0/I protostellar envelopes from interferometric observations of L1157 and single-dish data of thirteen sources (L1157 included). We find that N2H+ and N2D+ often do not have the same column density distribution, given that the emission peaks of the two species are not spatially coincident, contrary to predictions by previous chemical models.
1. The depletion regions of both N2H+ () and N2D+ () in the envelope around the Class 0 protostar L1157 are well-resolved in interferometric observations with the PdBI and SMA respectively. Both N2D+ and N2H+ are double-peaked with the N2D+ peaks at R2000 AU, outside the peaks of N2H+ which are at R1000 AU. Follow-up single-dish observations from the IRAM 30m of N2H+ (), N2D+ (), and () confirm the spatial offsets of the species.
2. Subsequent observations of additional protostellar envelopes in N2H+ () and N2D+ () with the IRAM 30m show frequent offsets between the emission peaks of N2D+ and N2H+ in eight of thirteen sources (L1157 included). Some sources without offsets could be due to a lack of spatial resolution; moreover, the additional sources with spatial offsets are not as well-ordered as L1157.
3. The large (1000 AU) offset in abundance peaks of N2H+ and N2D+ is not matched by the dynamic chemical model, nor previously published static models from (Emprechtinger et al., 2009). In such models, the abundance ratio of N2D+ and N2H+ falls due to heating by the protostar, but the abundance peaks remain closely coincident.
4. We suggest that the emission offsets are best explained by either an increased CO evaporation temperature due to ice mixtures or an H2 ortho-to-para ratio gradient. In the case of an increased CO evaporation temperature, there would be a region where H2D+ is not present in the gas phase, but CO is still frozen-out, enabling N2H+ have its emission peak be inside of the N2D+ peak. However, an H2 ortho-to-para ratio gradient would appear observationally similar and both effects may be happening.
We thank the referee Paola Caselli for helpful comments that improved the final manuscript. The authors wish to acknowledge useful discussions with K. Oberg. We thank the SMA staff for carrying out the observations, IRAM 30m staff for allowing us to use the E330 receiver with its interim local oscillator in the Fall of 2009 and assistance with the observations. The Submillimeter Array is a joint project between the Smithsonian Astrophysical Observatory and the Academia Sinica Institute of Astronomy and Astrophysics and is funded by the Smithsonian Institution and the Academia Sinica. J.Tobin acknowledges support provided by NASA through Hubble Fellowship grant #HST-HF-51300.01-A awarded by the Space Telescope Science Institute, which is operated by the Association of Universities for Research in Astronomy, Inc., for NASA, under contract NAS 5-26555. The National Radio Astronomy Observatory is a facility of the National Science Foundation operated under cooperative agreement by Associated Universities, Inc.
References
- Andre et al. (1993) Andre, P., Ward-Thompson, D., & Barsony, M. 1993, ApJ, 406, 122
- Arce & Sargent (2006) Arce, H. G., & Sargent, A. I. 2006, ApJ, 646, 1070
- Belloche & André (2004) Belloche, A., & André, P. 2004, A&A, 419, L35
- Bence et al. (1996) Bence, S. J., Richer, J. S., & Padman, R. 1996, MNRAS, 279, 866
- Bergin et al. (2002) Bergin, E. A., Alves, J., Huard, T., & Lada, C. J. 2002, ApJ, 570, L101
- Bergin & Tafalla (2007) Bergin, E. A., & Tafalla, M. 2007, ARA&A, 45, 339
- Bourke et al. (2006) Bourke, T. L., Myers, P. C., Evans, II, N. J., Dunham, M. M., Kauffmann, J., Shirley, Y. L., Crapsi, A., Young, C. H., Huard, T. L., Brooke, T. Y., Chapman, N., Cieza, L., Lee, C. W., Teuben, P., & Wahhaj, Z. 2006, ApJ, 649, L37
- Caselli et al. (2002) Caselli, P., Benson, P. J., Myers, P. C., & Tafalla, M. 2002, ApJ, 572, 238
- Caselli et al. (1995) Caselli, P., Myers, P. C., & Thaddeus, P. 1995, ApJ, 455, L77
- Caselli et al. (2008) Caselli, P., Vastel, C., Ceccarelli, C., van der Tak, F. F. S., Crapsi, A., & Bacmann, A. 2008, A&A, 492, 703
- Chandler & Richer (2000) Chandler, C. J., & Richer, J. S. 2000, ApJ, 530, 851
- Chapman & Mundy (2009) Chapman, N. L., & Mundy, L. G. 2009, ApJ, 699, 1866
- Chen et al. (2007) Chen, X., Launhardt, R., & Henning, T. 2007, ApJ, 669, 1058
- Chiang et al. (2012) Chiang, H., Looney, L. W., & Tobin, J. J. 2012, ApJ submitted
- Chiang et al. (2010) Chiang, H., Looney, L. W., Tobin, J. J., & Hartmann, L. 2010, ApJ, 709, 470
- Chini et al. (2001) Chini, R., Ward-Thompson, D., Kirk, J. M., Nielbock, M., Reipurth, B., & Sievers, A. 2001, A&A, 369, 155
- Collings et al. (2004) Collings, M. P., Anderson, M. A., Chen, R., Dever, J. W., Viti, S., Williams, D. A., & McCoustra, M. R. S. 2004, MNRAS, 354, 1133
- Crapsi et al. (2005) Crapsi, A., Caselli, P., Walmsley, C. M., Myers, P. C., Tafalla, M., Lee, C. W., & Bourke, T. L. 2005, ApJ, 619, 379
- Crapsi et al. (2004) Crapsi, A., Caselli, P., Walmsley, C. M., Tafalla, M., Lee, C. W., Bourke, T. L., & Myers, P. C. 2004, A&A, 420, 957
- Dore et al. (2004) Dore, L., Caselli, P., Beninati, S., Bourke, T., Myers, P. C., & Cazzoli, G. 2004, A&A, 413, 1177
- Dunham et al. (2010) Dunham, M. M., Evans, N. J., Terebey, S., Dullemond, C. P., & Young, C. H. 2010, ApJ, 710, 470
- Emprechtinger et al. (2009) Emprechtinger, M., Caselli, P., Volgenau, N. H., Stutzki, J., & Wiedner, M. C. 2009, A&A, 493, 89
- Enoch et al. (2009) Enoch, M. L., Evans, N. J., Sargent, A. I., & Glenn, J. 2009, ApJ, 692, 973
- Enoch et al. (2007) Enoch, M. L., Glenn, J., Evans, II, N. J., Sargent, A. I., Young, K. E., & Huard, T. L. 2007, ApJ, 666, 982
- Evans et al. (2009) Evans, N. J., Dunham, M. M., Jørgensen, J. K., Enoch, M. L., Merín, B., van Dishoeck, E. F., Alcalá, J. M., Myers, P. C., Stapelfeldt, K. R., Huard, T. L., Allen, L. E., Harvey, P. M., van Kempen, T., Blake, G. A., Koerner, D. W., Mundy, L. G., Padgett, D. L., & Sargent, A. I. 2009, ApJS, 181, 321
- Fayolle et al. (2011) Fayolle, E. C., Öberg, K. I., Cuppen, H. M., Visser, R., & Linnartz, H. 2011, A&A, 529, A74
- Flower et al. (2006) Flower, D. R., Pineau Des Forêts, G., & Walmsley, C. M. 2006, A&A, 449, 621
- Friesen et al. (2010) Friesen, R. K., Di Francesco, J., Myers, P. C., Belloche, A., Shirley, Y. L., Bourke, T. L., & André, P. 2010, ApJ, 718, 666
- Froebrich (2005) Froebrich, D. 2005, ApJS, 156, 169
- Fuller et al. (1995) Fuller, G. A., Lada, E. A., Masson, C. R., & Myers, P. C. 1995, ApJ, 453, 754
- Fuller & Wootten (2000) Fuller, G. A., & Wootten, A. 2000, ApJ, 534, 854
- Goldsmith & Langer (1999) Goldsmith, P. F., & Langer, W. D. 1999, ApJ, 517, 209
- Gueth et al. (2003) Gueth, F., Bachiller, R., & Tafalla, M. 2003, A&A, 401, L5
- Gueth et al. (1996) Gueth, F., Guilloteau, S., & Bachiller, R. 1996, A&A, 307, 891
- Gueth et al. (1997) Gueth, F., Guilloteau, S., Dutrey, A., & Bachiller, R. 1997, A&A, 323, 943
- Hartmann et al. (1999) Hartmann, L., Calvet, N., Allen, L., Chen, H., & Jayawardhana, R. 1999, AJ, 118, 1784
- Herbig & Jones (1983) Herbig, G. H., & Jones, B. F. 1983, AJ, 88, 1040
- Herbst (1982) Herbst, E. 1982, A&A, 111, 76
- Hirota et al. (2011) Hirota, T., Honma, M., Imai, H., Sunada, K., Ueno, Y., Kobayashi, H., & Kawaguchi, N. 2011, PASJ, 63, 1
- Hogerheijde & Sandell (2000) Hogerheijde, M. R., & Sandell, G. 2000, ApJ, 534, 880
- Hogerheijde et al. (1998) Hogerheijde, M. R., van Dishoeck, E. F., Blake, G. A., & van Langevelde, H. J. 1998, ApJ, 502, 315
- Jørgensen (2004) Jørgensen, J. K. 2004, A&A, 424, 589
- Jørgensen et al. (2007) Jørgensen, J. K., Bourke, T. L., Myers, P. C., Di Francesco, J., van Dishoeck, E. F., Lee, C., Ohashi, N., Schöier, F. L., Takakuwa, S., Wilner, D. J., & Zhang, Q. 2007, ApJ, 659, 479
- Kenyon et al. (1990) Kenyon, S. J., Hartmann, L. W., Strom, K. M., & Strom, S. E. 1990, AJ, 99, 869
- Keto & Rybicki (2010) Keto, E., & Rybicki, G. 2010, ApJ, 716, 1315
- Kim et al. (2012) Kim, H. J., Evans, II, N. J., Dunham, M. M., Lee, J.-E., & Pontoppidan, K. M. 2012, ApJ, 758, 38
- Kirk et al. (2009) Kirk, J. M., Ward-Thompson, D., Di Francesco, J., Bourke, T. L., Evans, N. J., Merín, B., Allen, L. E., Cieza, L. A., Dunham, M. M., Harvey, P., Huard, T., Jørgensen, J. K., Miller, J. F., Noriega-Crespo, A., Peterson, D., Ray, T. P., & Rebull, L. M. 2009, ApJS, 185, 198
- Langer (1985) Langer, W. D. 1985, in Protostars and Planets II, ed. D. C. Black & M. S. Matthews, 650–667
- Lee et al. (2009) Lee, C., Hirano, N., Palau, A., Ho, P. T. P., Bourke, T. L., Zhang, Q., & Shang, H. 2009, ApJ, 699, 1584
- Lee et al. (2004) Lee, J., Bergin, E. A., & Evans, II, N. J. 2004, ApJ, 617, 360
- Lee (2007) Lee, J.-E. 2007, Journal of Korean Astronomical Society, 40, 83
- Loinard et al. (2007) Loinard, L., Torres, R. M., Mioduszewski, A. J., Rodríguez, L. F., González-Lópezlira, R. A., Lachaume, R., Vázquez, V., & González, E. 2007, ApJ, 671, 546
- Looney et al. (2007) Looney, L. W., Tobin, J. J., & Kwon, W. 2007, ApJ, 670, L131
- Lovas (1992) Lovas, F. J. 1992, Journal of Physical and Chemical Reference Data, 21, 181
- Öberg et al. (2011) Öberg, K. I., Boogert, A. C. A., Pontoppidan, K. M., van den Broek, S., van Dishoeck, E. F., Bottinelli, S., Blake, G. A., & Evans, II, N. J. 2011, ApJ, 740, 109
- Pagani et al. (2009) Pagani, L., Vastel, C., Hugo, E., Kokoouline, V., Greene, C. H., Bacmann, A., Bayet, E., Ceccarelli, C., Peng, R., & Schlemmer, S. 2009, A&A, 494, 623
- Parise et al. (2011) Parise, B., Belloche, A., Du, F., Güsten, R., & Menten, K. M. 2011, A&A, 526, A31
- Roberts & Millar (2000) Roberts, H., & Millar, T. J. 2000, A&A, 361, 388
- Roberts & Millar (2007) —. 2007, A&A, 471, 849
- Sault et al. (1995) Sault, R. J., Teuben, P. J., & Wright, M. C. H. 1995, in Astronomical Society of the Pacific Conference Series, Vol. 77, Astronomical Data Analysis Software and Systems IV, ed. R. A. Shaw, H. E. Payne, & J. J. E. Hayes, 433–+
- Scholz et al. (2010) Scholz, A., Wood, K., Wilner, D., Jayawardhana, R., Delorme, P., Caratti O Garatti, A., Ivanov, V. D., Saviane, I., & Whitney, B. 2010, MNRAS, 409, 1557
- Shirley et al. (2000) Shirley, Y. L., Evans, II, N. J., Rawlings, J. M. C., & Gregersen, E. M. 2000, ApJS, 131, 249
- Shu (1977) Shu, F. H. 1977, ApJ, 214, 488
- Sipilä et al. (2010) Sipilä, O., Hugo, E., Harju, J., Asvany, O., Juvela, M., & Schlemmer, S. 2010, A&A, 509, A98
- Terebey et al. (2009) Terebey, S., Fich, M., Noriega-Crespo, A., Padgett, D. L., Fukagawa, M., Audard, M., Brooke, T., Carey, S., Evans, N. J., Guedel, M., Hines, D., Huard, T., Knapp, G. R., McCabe, C., Menard, F., Monin, J., & Rebull, L. 2009, ApJ, 696, 1918
- Tobin et al. (2012) Tobin, J. J., Hartmann, L., Bergin, E., Chiang, H.-F., Looney, L. W., Chandler, C. J., Maret, S., & Heitsch, F. 2012, ApJ, 748, 16
- Tobin et al. (2008) Tobin, J. J., Hartmann, L., Calvet, N., & D’Alessio, P. 2008, ApJ, 679, 1364
- Tobin et al. (2011) Tobin, J. J., Hartmann, L., Chiang, H.-F., Looney, L. W., Bergin, E. A., Chandler, C. J., Masqué, J. M., Maret, S., & Heitsch, F. 2011, ApJ, 740, 45
- Tobin et al. (2010) Tobin, J. J., Hartmann, L., Looney, L. W., & Chiang, H. 2010, ApJ, 712, 1010
- Tsitali et al. (2010) Tsitali, A. E., Bourke, T. L., Peterson, D. E., Myers, P. C., Dunham, M. M., Evans, N. J., & Huard, T. L. 2010, ApJ, 725, 2461
- Visser et al. (2002) Visser, A. E., Richer, J. S., & Chandler, C. J. 2002, AJ, 124, 2756
- Visser & Bergin (2012) Visser, R., & Bergin, E. A. 2012, ApJ, 754, L18
- Watson (1974) Watson, W. D. 1974, ApJ, 188, 35
- Young & Evans (2005) Young, C. H., & Evans, II, N. J. 2005, ApJ, 627, 293
- Young et al. (2006) Young, K. E., Enoch, M. L., Evans, II, N. J., Glenn, J., Sargent, A., Huard, T. L., Aguirre, J., Golwala, S., Haig, D., Harvey, P., Laurent, G., Mauskopf, P., & Sayers, J. 2006, ApJ, 644, 326


| Source | RA | Dec | Distance | Mass8μm | Masssubmm**Mass computed from sub/millimeter emission assuming an isothermal temperature. | Lbol | Tbol | Outflow PA | References |
|---|---|---|---|---|---|---|---|---|---|
| (J2000) | (J2000) | (pc) | () | () | () | (K) | (°) | (Distance, Mref, Lbol,) | |
| (r0.05pc) | (Tbol, Outflow PA) | ||||||||
| IRAS 03282+3035 | 03:31:21.10 | +30:45:30.2 | 230 | 2.4 | 2.2 | 1.2 | 33 | 122 | 23, 4, 3, 3, 26 |
| HH211 | 03:43:56.78 | +32:00:49.8 | 230 | 1.1 | 1.5 | 3.02 | 24 | 116 | 23, 3, 3, 3, 6 |
| L1521F | 04:28:39.03 | +26:51:35.0 | 140 | 2.3 | 1.0 | 0.35 | 20 | 270 | 20, 10, 8, 1, 7 |
| IRAS 04325+2402 | 04:35:35.39 | +24:08:19.0 | 140 | 3.9 | - | 0.97 | 73 | 200 | 20, 1, 15, 15, 16 |
| L1527 | 04:39:53.86 | +26:03:09.5 | 140 | 0.8 | 2.4 | 1.9 | 56 | 90 | 20, 4, 9, 15, 31 |
| RNO43 | 05:32:19.39 | +12:49:40.8 | 460 | 2.8 | 2.6 | 12.5 | 56 | 20 | 21, 10, 2, 15, 21 & 1 |
| L483 | 18:17:29.93 | -04:39:39.6 | 200 | 3.5 | 1.8 | 11.5 | 54 | 282 | 25, 4, 3, 15, 30 |
| HH108 IRS | 18:35:42.14 | -00:33:18.5 | 300 | - | 4.5 | 8.0 | 28 | 208 | 17, 14, 14, 1, 1 |
| HH108 MMS | 18:35:46.46 | -00:32:51.2 | 300 | - | 3.6 | 0.7 | 18 | 130 | 17, 17, 1, 1, 1 |
| L673-SMM2 | 19:20:25.96 | +11:19:52.9 | 300 | 1.0 | 0.35 | 2.8 | - | 270, 135 | 24, -, -, 12, 1 & 12 |
| L1152 | 20:35:46.22 | +67:53:01.9 | 300 | 3.4 | 12.0 | 1.0 | 33 | 225 | 5, 10, 3, 1, 11 |
| L1157 | 20:39:06.25 | +68:02:15.9 | 300 | 2.6 | 2.2 | 3.0 | 29 | 150 | 5, 4, 3, 15, 27 |
| L1165 | 22:06:50.46 | +59:02:45.9 | 300 | 1.1 | 0.32 | 13.9 | 46 | 225 | 5, 1, 12, 1, 12 |
Note. — Properties of sources observed in the single-dish and/or interferometric sample. The 8m extinction masses are taken within 0.05 pc of the protostar and note that some of the masses have been rescaled to account for a different distance estimate as compared to Paper I. Positions are reflect the coordinates of the 24m point source from Spitzer data or the 3mm continuum continuum position for protostars observed with CARMA. The Outflow position axes (PA) are not well constrained since the outflows are known to precess they can have fairly large angular width; a conservative estimate of uncertainty would be 10°. References: (1) This work, (2) Tobin et al. (2010), (3) Enoch et al. (2009), (4) Shirley et al. (2000), (5) Kirk et al. (2009), (6) Lee et al. (2009), (7) Bourke et al. (2006) (8) Terebey et al. (2009), (9) Tobin et al. (2008), (10) Young et al. (2006), (3) Visser et al. (2002), (11) Chapman & Mundy (2009), (14) Enoch et al. (2007), (15) Froebrich (2005), (16) Hartmann et al. (1999), (17) Chini et al. (2001), (20) Loinard et al. (2007), (21) Bence et al. (1996), (23) Hirota et al. (2011), (24) Herbig & Jones (1983), (25) Jørgensen (2004), (26) Arce & Sargent (2006), (27) Gueth et al. (1996), (30) Fuller et al. (1995), (31) Hogerheijde et al. (1998).
| Transition | Frequency | Observatory | Beam width | Feff | Beff |
|---|---|---|---|---|---|
| (GHz) | (′′) | ||||
| N2H+ () | 93.1737637 | IRAM 30m | 26 | 0.95 | 0.81 |
| PdBI D, C-array | 3.4 x 3.3 | ||||
| N2H+ () | 279.511832 | IRAM 30m | 9 | 0.88 | 0.53 |
| N2D+ () | 154.217206 | IRAM 30m | 16 | 0.93 | 0.74 |
| N2D+ () | 231.321966 | IRAM 30m | 10 | 0.94 | 0.63 |
| SMA sub-compact | 7.1 x 4.3 |
Note. — The single-dish data were rescaled to main beam brightness temperatures (Tmb) where Tmb = FeffT/Beff. Feff is the forward efficiency, accounting for losses by the secondary support structure, and Beff is the main beam efficiency, the ratio of the main beam solid angle over the entire antenna pattern (http://www.iram.es/IRAMES/mainWiki/Iram30mEfficiencies).
| Source | RA | Dec | Date | Tsys††System temperatures, channel widths, and intensity uncertainties are given for 93 GHz and 154 GHz respectively. For L1157, values for 231 GHz and 279 GHz are also given. | Channel Width††System temperatures, channel widths, and intensity uncertainties are given for 93 GHz and 154 GHz respectively. For L1157, values for 231 GHz and 279 GHz are also given. | ††System temperatures, channel widths, and intensity uncertainties are given for 93 GHz and 154 GHz respectively. For L1157, values for 231 GHz and 279 GHz are also given. |
|---|---|---|---|---|---|---|
| (J2000) | (J2000) | (UT) | (K) | (kHz) | (K km s-1) | |
| IRAS 032823035 | 03:31:19.8 | +30:45:37 | 25 Oct 2009 | 115, 130 | 20, 40 | 0.04, 0.035 |
| HH211-mm | 03:43:55.3 | +32:00:46 | 24 Oct 2009 | 110, 120 | 20, 40 | 0.05, 0.04 |
| L1521F | 04:28:39.0 | +26:51:37 | 24 Oct 2009 | 102, 110 | 20, 40 | 0.04, 0.025 |
| IRAS04325+2402 | 04:35:36.6 | +24:08:54 | 25 Oct 2009 | 105, 120 | 20, 40 | 0.04, 0.035 |
| L1527 | 04:39:54.0 | +26:03:22 | 26 Oct 2009 | 100, 130 | 20, 40 | 0.03, 0.015 |
| RNO43 | 05:32:18.2 | +12:50:01 | 24 Oct 2009 | 115, 135 | 20, 40 | 0.04, 0.03 |
| L483 | 18:17:30.3 | -04:39:40.6 | 25 Oct 2009 | 135, 180 | 20, 40 | 0.06, 0.05 |
| HH108 | 18:35:42.7 | -00:33:07 | 23 Oct 2009 | 140, 230 | 20, 40 | 0.05, 0.06 |
| L673-SMM2 | 19:20:25.4 | +11:19:44 | 23/24 Oct 2009 | 140, 210 | 20, 40 | 0.04, 0.04 |
| L1152 | 20:35:47.17 | +67:53:22 | 24 Oct 2009 | 120, 150 | 20, 40 | 0.04, 0.035 |
| L1157 | 20:39:05.6 | +68:02:13.2 | 25 Oct 2009 | 110, 115, 320, 290 | 20, 20, 40, 40 | 0.027, 0.05, 0.12, 0.14 |
| L1165 | 22:06:50.8 | +59:03:06.5 | 25 Oct 2009 | 110, 120 | 20, 40 | 0.04, 0.035 |
Note. — Observations of protostellar envelopes taken with the IRAM 30m telescope. The positions reflect the map center and not necessarily the protostar position.
| Source | W | Vlsr | V | W | Vlsr | V | ||||
|---|---|---|---|---|---|---|---|---|---|---|
| N2H+ () | N2D+ () | |||||||||
| (K km s-1) | (km s-1) | (km s-1) | (K) | (nepers) | (K km s-1) | (km s-1) | (km s-1) | (K) | (nepers) | |
| IRAS03282 | 6.37 0.04 | 6.94 0.003 | 0.40 0.006 | 6.0 0.6 | 4.8 0.5 | 1.40 0.04 | 7.01 0.01 | 0.35 0.02 | 4.2 0.6 | 2.7 0.6 |
| HH211 | 5.90 0.05 | 9.10 0.003 | 0.45 0.008 | 4.8 0.5 | 6.9 0.6 | 2.27 0.05 | 9.18 0.01 | 0.38 0.03 | 4.3 0.6 | 3.9 0.8 |
| L1521F | 5.30 0.02 | 6.47 0.001 | 0.30 0.001 | 4.5 0.1 | 16.9 0.2 | 0.93 0.03 | 6.56 0.01 | 0.27 0.02 | 4.1 0.2 | 2.2 0.3 |
| IRAS04325 | 4.31 0.05 | 5.70 0.004 | 0.39 0.011 | 5.3 1.1 | 4.1 0.8 | 0.03 0.02 | 5.66 0.07 | 0.40 0.11 | 4.7 1.7 | 0.1 0.0 |
| IRAS04325N | 6.40 0.03 | 5.87 0.003 | 0.33 0.008 | 6.7 1.1 | 4.9 0.8 | 0.81 0.03 | 5.94 0.01 | 0.29 0.02 | 21.7 3.6 | 0.1 0.0 |
| L1527 | 3.24 0.03 | 5.90 0.004 | 0.33 0.009 | 4.5 0.8 | 5.9 0.9 | 0.01 | … | … | … | … |
| L1527N | 2.87 0.03 | 5.82 0.004 | 0.32 0.009 | 4.2 0.7 | 6.6 1.0 | 0.22 0.01 | 5.81 0.03 | 0.39 0.08 | 6.4 1.5 | 0.1 0.0 |
| RNO43 | 2.50 0.03 | 10.25 0.007 | 0.82 0.019 | 5.5 2.6 | 0.9 0.4 | 0.30 0.02 | 10.40 0.04 | 0.69 0.08 | 6.2 3.0 | 0.1 0.0 |
| L483 | 12.03 0.06 | 5.35 0.006 | 0.42 0.011 | 5.7 0.2 | 13.7 0.4 | 0.99 0.07 | 5.39 0.01 | 0.27 0.02 | 3.4 0.5 | 5.5 1.2 |
| HH108 IRS | 5.47 0.06 | 10.80 0.008 | 0.55 0.017 | 5.0 1.1 | 4.4 0.9 | 0.61 0.04 | 10.78 0.03 | 0.51 0.08 | 10.1 2.5 | 0.1 0.0 |
| HH108 MMS | 2.12 0.04 | 10.92 0.005 | 0.38 0.013 | 4.4 1.4 | 3.3 1.0 | 0.54 0.05 | 10.95 0.04 | 0.50 0.10 | 4.7 2.7 | 0.4 2.8 |
| L673S | 7.30 0.05 | 6.85 0.006 | 0.55 0.015 | 7.6 2.1 | 2.6 0.7 | 0.74 0.03 | 6.84 0.02 | 0.58 0.06 | 10.6 3.0 | 0.1 0.0 |
| L673M | 6.63 0.05 | 6.90 0.008 | 0.68 0.020 | 6.1 1.4 | 2.9 0.7 | 0.47 0.04 | 6.93 0.04 | 0.62 0.08 | 7.7 2.0 | 0.1 0.0 |
| L673N | 5.37 0.05 | 6.91 0.009 | 0.70 0.022 | 5.1 1.1 | 3.4 0.7 | 0.33 0.03 | 6.90 0.04 | 0.47 0.12 | 3.8 2.2 | 0.4 3.3 |
| L1152 | 4.17 0.04 | 2.64 0.005 | 0.40 0.012 | 4.6 0.9 | 6.0 1.0 | 0.31 0.03 | 2.71 0.03 | 0.40 0.07 | 3.0 1.1 | 2.6 1.8 |
| L1157 | 4.85 0.02 | 2.65 0.007 | 0.57 0.017 | 4.6 0.9 | 4.5 0.8 | 0.78 0.05 | 2.73 0.01 | 0.40 0.02 | 3.6 0.7 | 2.2 0.5 |
| L1165 | 1.50 0.04 | -1.61 0.006 | 0.43 0.015 | 3.9 1.4 | 2.8 1.0 | 0.04 0.01 | -1.61 0.04 | 0.26 0.09 | 5.7 2.7 | 0.1 0.0 |
Note. — The N2H+ and N2D+ integrated intensities are on the scale and do not include the 10% calibration error. Note that for N2D+ is not well constrained when 0.1 and the uncertainties for = 0.1 are not meaningful.
| Source | N(N2H+) | N(N2D+) | N(N2D+)/N(N2H+) | N2H+/N2D+ offset |
|---|---|---|---|---|
| (cm-2) | (cm-2) | (′′) | ||
| IRAS03282 | 2.66 1013 3.25 1012 | 3.42 1012 6.52 1011 | 0.129 0.029 | 8 |
| HH211 | 3.41 1013 4.17 1012 | 7.57 1012 1.58 1012 | 0.222 0.054 | 20††Taken from the column density maps, emission maps are spatially coincident. |
| L1521F | 7.42 1013 1.72 1012 | 2.09 1012 2.00 1011 | 0.028 0.003 | 0 |
| IRAS04325 | 1.51 1013 3.97 1012 | 1.6 1010 | 0.001 | … |
| IRAS04325N | 2.83 1013 5.42 1012 | 4.05 1011 4.89 1010 | 0.014 0.003 | 0 |
| L1527 | 1.59 1013 3.53 1012 | 1.6 1010 | 0.001 | 35 |
| L1527N | 1.56 1013 3.78 1012 | 1.85 1011 3.59 1010 | 0.012 0.004 | … |
| RNO43 | 3.18 1012 1.35 1012 | 1.79 1011 7.02 1010 | 0.056 0.033 | 16 |
| L483 | 1.40 1014 6.17 1012 | 6.92 1012 1.60 1012 | 0.049 0.012 | 16 |
| HH108 IRS | 2.01 1013 5.41 1012 | 4.03 1011 8.27 1010 | 0.020 0.007 | 0aaShift between protostar and N2H+ is observed even though N2H+ and N2D+ are spatially coincident. |
| HH108 MMS | 5.99 1012 2.55 1012 | 5.32 1011 7.23 1011 | 0.089 0.127 | … |
| L673S | 1.89 1013 5.05 1012 | 3.47 1011 5.89 1010 | 0.018 0.006 | 18 |
| L673M | 1.77 1013 4.56 1012 | 2.54 1011 4.84 1010 | 0.014 0.005 | … |
| L673N | 1.57 1013 4.05 1012 | 2.60 1011 3.98 1011 | 0.017 0.026 | … |
| L1152 | 2.09 1013 5.20 1012 | 1.49 1012 8.79 1011 | 0.071 0.046 | 0 |
| L1157 | 1.82 1013 4.49 1012 | 2.19 1012 5.58 1011 | 0.120 0.043 | 3.5 |
| L1165 | 3.76 1012 1.97 1012 | 3.75 1010 2.03 1010 | 0.010 0.008 | 8 |