Hadronic resonance production in Pb–Pb collisions at the ALICE experiment
Abstract
Measurements of the yields of hadronic resonances (relative to non-resonances) in high-energy heavy-ion collisions allow the chemical freeze-out temperature and the time between chemical and thermal freeze-out of the collision system to be studied, while modifications to resonance masses and widths could be a signature of chiral symmetry restoration. The spectra (for 5 GeV), total integrated yields, ratios to non-resonances ( and /K), mass, and width of the meson and the uncorrected yields, mass, and width of the K and mesons have been measured using the ALICE detector for Pb–Pb collisions at . These measurements will be compared to results from other collision systems and energies. Angular correlations between leading trigger hadrons and mesons have been measured in Pb–Pb and pp collisions; the mass and width of the meson as a function of the correlation angle will be presented.
1 Introduction
The production of resonances occurs both during the transition (at a critical temperature of 160 MeV [1, 2, 3]) from the quark-gluon plasma (QGP) to the hadronic phase and in the hadronic phase itself due to regeneration [4, 5, 6]. Due to their short lifetimes (a few fm), many resonances will decay during the hadronic phase; their decay products will tend to be re-scattered in the hadronic medium, making experimental reconstruction of the resonance impossible [7]. The temperature evolution and lifetime of the hadronic phase affect the relative strengths of resonance-generating processes and re-scattering, and therefore ratios of resonance yields to non-resonance yields [8]. Particle ratios have been predicted as functions of the chemical freeze-out temperature and the elapsed time between chemical and thermal freeze-out using thermal models [9, 10, 11, 8, 5]. In principle, measurements of two different particle ratios are needed to tune the thermal models and determine uniquely the chemical freeze-out temperature and the lifetime of the hadronic medium; in practice, many measured ratios are used to obtain a best-fit value for these model parameters.
It is expected that chiral symmetry is restored at around the same critical temperature as the deconfinement phase transition [12], with the quark-antiquark condensate decreasing towards 0 with increasing temperature [13]. Resonances that interact with the medium in the mixed or early hadronic phases, when chiral symmetry is at least partially restored, may be shifted off of their mass shells and exhibit broader widths than observed in vacuum [13, 14, 15]. For example, it has been predicted that the meson should “melt” (its width approaches its mass) near the critical temperature [13], with a mass shift of a few tens of MeV at most [16]. However, the modified resonance spectral functions will only be observable if a large fraction of resonances decay while the medium is chirally restored. UrQMD [17] calculations indicate that regeneration (which adds resonances with vacuum properties) and re-scattering effects (which reduce the resonance signal) will be strongest for GeV. It was argued in [18], accounting for the time dependence of the QGP temperature and the time dilation of resonance decays, that experimental searches at the LHC for the signatures of chiral symmetry restoration should focus on resonances with GeV. It has been predicted that the majority of reconstructable resonances with GeV will be produced when the density of the medium is high [19]; however, estimating the fraction of reconstructable resonances that decay in the chirally restored medium is a more complicated question and further input is needed from the theoretical community [18]. Resonances with shorter lifetimes (a few fm/) are more likely to exhibit mass shifts or width broadening, meaning that the would be more likely than the (1020) to exhibit these signatures.
These proceedings present measurements of the , K, and resonances in Pb–Pb collisions at using the ALICE detector at the LHC. For the sake of brevity, will be hereafter be denoted simply by . The K and mesons will be collectively referred to as and all results will be for the combination of the particle and antiparticle. The ALICE detector will be described in Section 2. The method used to extract the masses, widths, and yields of the resonances as functions of will be described in Section 3.1 and measurements of the and masses and widths as functions of will be presented and discussed in Section 3.2. The spectra for 5 GeV are presented is Section 4. Resonance-to-non-resonance ratios and measurements of the mean transverse momentum of the meson are presented and discussed in Section 5. The method of jet-resonance (or hadron-resonance) correlations has been proposed as a way of preferentially selecting for resonances (with ) that originated in the mixed or partonic phases, when chiral symmetry was still at least partially restored. The hadron-resonance correlation method will be described in Section 6.
2 The ALICE Detector
The ALICE detector [20] is the only detector at the LHC dedicated primarily to the study of heavy-ion collisions. It was designed to operate at high particle multiplicities, which were expected to be up to three orders of magnitude greater than for pp collisions at the same energy and 2-5 times greater than the multiplicities seen in heavy-ion collision at RHIC. The ALICE detector provides extensive particle tracking and identification at mid-rapidity as well as muon tracking and identification at forward rapidity . The components of the ALICE detector most directly related to the results presented in this article will be described below.
The Inner Tracking System (ITS) is a silicon detector that surrounds the interaction point, with six layers between radii 3.9 cm and 43 cm from the beam axis. The ITS is used to reconstruct the collision vertex and provide hits used in particle tracking. Particle tracking is mainly provided by the large (90 m3) cylindrical Time Projection Chamber (TPC) [21]. The TPC also allows particles to be identified through their energy loss. The Time-of-Flight Detector (TOF) is an array of multi-gap resistive-plate chambers that sits outside the TPC and measures particle speed. The TOF allows for kaons to be distinguished from pions for GeV and for kaons to be separated from protons for GeV (by better than 3 in both cases [22, 23]). In the present analysis, TOF information was not used to identify the decay daughters of and , although it will be used in the future. The V0 detector consists of two arrays of scintillator counters that sit at large pseudorapidities ( and ) on opposite sides of the interaction point; it provides minimum-bias triggers for the central barrel detectors.
3 Resonance Signals
3.1 Signal Extraction
(a)
 (b)
(b)
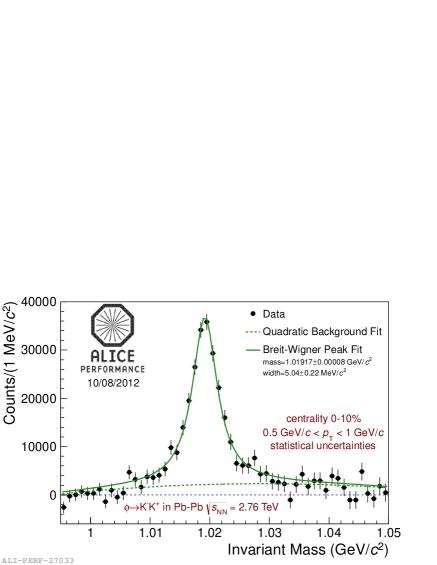
The decays of mesons to oppositely charged kaons (branching ratio = [24]) were reconstructed in 9.5 million Pb–Pb collisions. The kaons were identified by applying a cut to their measured energy loss in the ALICE TPC. The measured energy loss was required to deviate from the expected mean value by , where is the energy-loss resolution ( for isolated tracks [21]). An invariant-mass distribution of pairs (with ) of oppositely charged kaons from the same event was generated. In order to remove the large number of random combinations, combinatorial backgrounds were generated using two different methods. The like-charge111also known as “like-sign” combinatorial background was generated by pairing each kaon candidate with kaons from the same event with the same charge. The like-charge combinatorial background is , where and are the numbers of K-K- and K+K+ pairs, respectively, in each invariant mass bin. A second combinatorial background was generated by mixing oppositely charged kaon tracks from different events. The pairs of mixed events were required to differ by cm in vertex position and in centrality percentile; each identified kaon track was mixed into other events. The mixed-event combinatorial background was scaled so that its integral in a region surrounding the peak222The exact boundaries of this normalization region ( or ) were varied. The following six sets of boundaries were used (units of GeV): =(1,1.01,1.03,1.06), (1,1.006,1.04,1.06), (1,1.006,1.03,1.06), (1,1.01,1.035,1.06), (1,1.006,1.04,1.05), and (0.995,1.01,1.03,1.06). was the same as the integral of the unlike-charge distribution in the same region. The mixed-event combinatorial background was chosen as the primary method for this analysis due to its smaller statistical uncertainties and fluctuations.
After the subtraction of the combinatorial background, a peak could be observed sitting on a residual background (See Figure 1a), which was present due to the fact that neither choice of combinatorial background could account for correlated sources of unlike-charge background. A polynomial fit was performed on a region surrounding the peak in order to parametrize this residual background. Second-order polynomials were used as the primary fitting functions. To extract the yield, the unlike-charge invariant mass distribution was integrated and the integral of the residual background fit was subtracted. The unlike-charge distribution was also fit with a relativistic Breit-Wigner function added to the residual background fit. This provided a second method for extracting the particle yield and also allowed the mass and width of the meson to be extracted. The systematic uncertainties in the yield take into account variations in the yield due to different kaon identification (TPC energy loss) cuts, combinatorial backgrounds, normalization regions, residual background parameterizations333First- and third-order polynomial fits were also performed., residual background fit regions, and methods of extracting the yield from the peak (integrating the histogram vs. integrating the fit). The systematic uncertainties also include contributions that arise from varying the track quality cuts, uncertainties in the amount of material used in simulations of the ALICE detector (in the efficiency calculation), and the uncertainty in centrality selection.
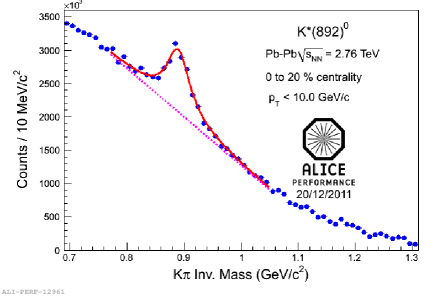
The extraction of the yields, mass, and width was performed in a similar fashion (See Figure 1b). The decays of mesons to pairs (branching ratio = [24]) were reconstructed in 3.4 million Pb–Pb collisions. The kaons were again identified by applying a cut on energy loss in the TPC, while the pions were identified by applying a cut on the energy loss. As in the analysis, both like-charge and mixed-event combinatorial backgrounds were constructed. A first-order polynomial was used as the primary fit function for the residual background.
3.2 Masses and Widths
(a)

(b)
(a)
(b)
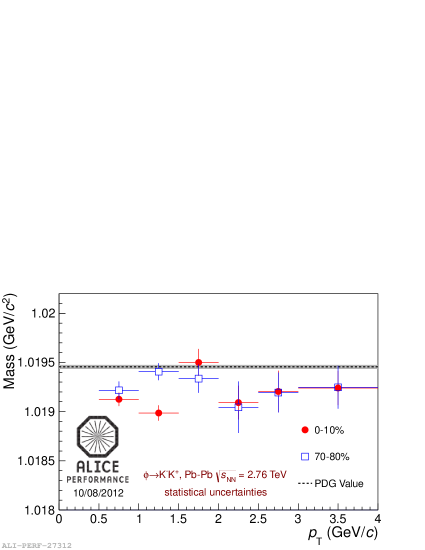
The mass and width of mesons are shown as functions of transverse momentum in Figure 3 for central and peripheral Pb–Pb collisions. The measured values of the mass are within 0.5 MeV of the nominal value, while the measured values of the width are within 2 MeV of the nominal value. There is no obvious centrality dependence in either the mass or the width. The mass and width of mesons have also been extracted from simulated Pb–Pb collisions, with particle production via HIJING and the ALICE detector simulated using GEANT3. The deviations from the nominal mass and width observed in these simulations444The values of the simulated mass are observed to be within 0.5 MeV of the vacuum value, while the values of the simulated width are observed to be within 1-2 MeV of the vacuum value. Studies of these simulated peaks are ongoing. are similar to the deviations observed for the real data, suggesting that the shifts in the mass and width can be explained purely by detector effects.
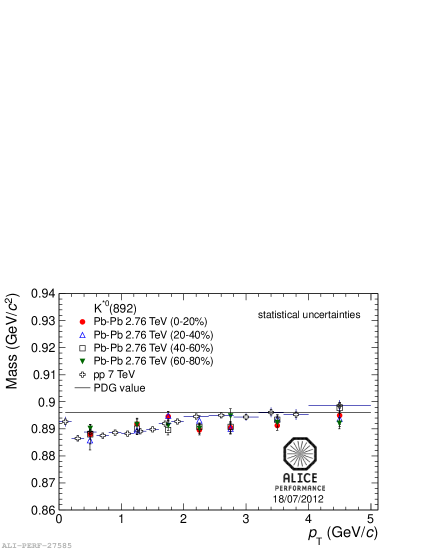
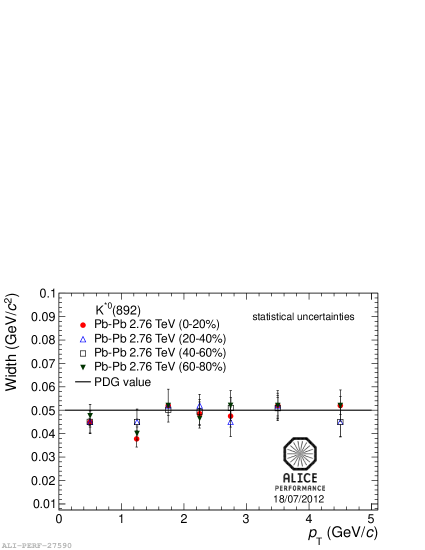
The mass and width of are shown as functions of transverse momentum in Figure 3 for Pb–Pb collisions at in multiple centrality bins. The measured values of the mass are consistent with the values measured in pp collisions at , which suggests that the deviation from the nominal value is an instrumental effect555The reconstructed masses and widths of simulated peaks are being studied in order to confirm whether or not these deviations are detector effects.. The measured values of the width are generally consistent with the nominal value. As with the meson, there is no apparent centrality dependence in the mass or width.
4 Spectra
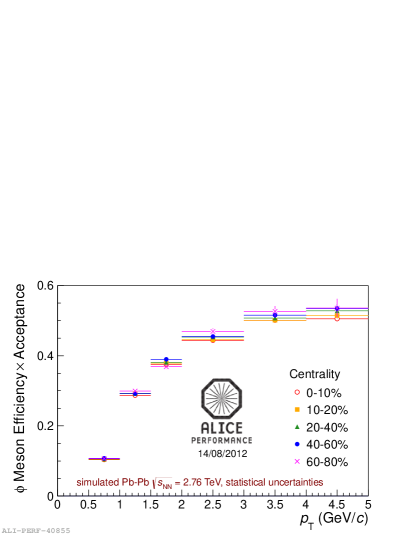
The efficiency acceptance for the meson was calculated from simulated 1.82 million Pb–Pb events; particles were generated using HIJING and their interactions with the ALICE detector were simulated using GEANT3. The same event-selection and track-quality cuts were used in the analyses of the real and simulated data. Figure 4 shows efficiency acceptance for the meson. While the energy-loss followed a Gaussian distribution in the real data, this behavior was not reproduced in the simulation. For this reason, a separate factor was applied to correct for the efficiency of the TPC energy-loss cuts used to identify kaons; for the default energy-loss cuts (a cut) . More simulated events must be analyzed in order for the efficiency calculation to be extended to higher transverse momenta; it is for this reason that the spectra reported in this article are only for GeV.
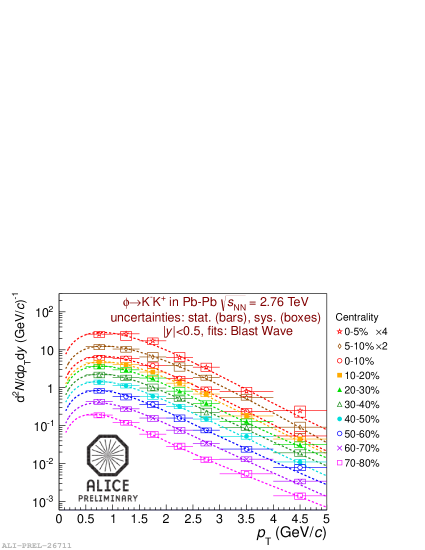
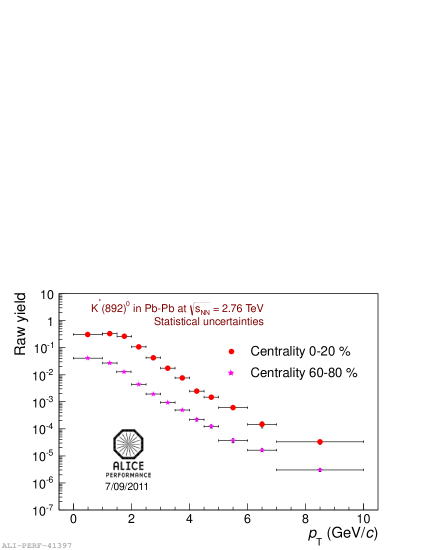
Figure 5a shows the corrected spectra (ddd) in multiple centrality bins; these spectra have been corrected for the efficiency acceptance, energy-loss cut efficiency, and the branching ratios. The spectra were fit with Boltzmann-Gibbs Blast Wave functions [26]. Figure 5b shows the uncorrected yields; signals are observed for 10 GeV.
(a)
(b)
5 Ratios and Mean
(a)
(b)
(a)
(b)
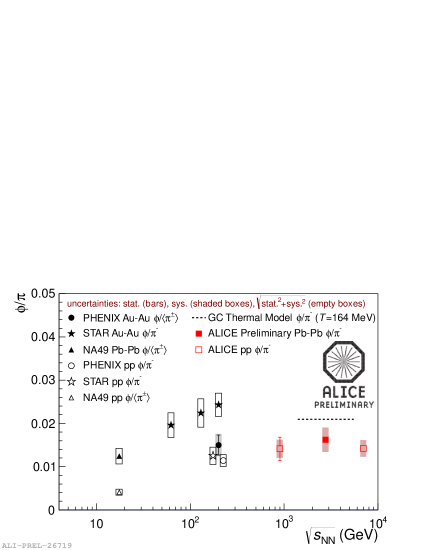
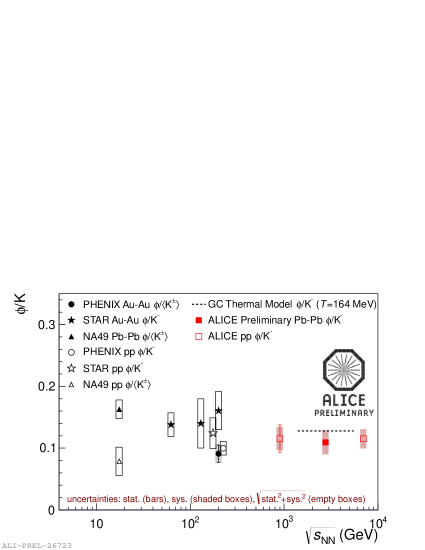
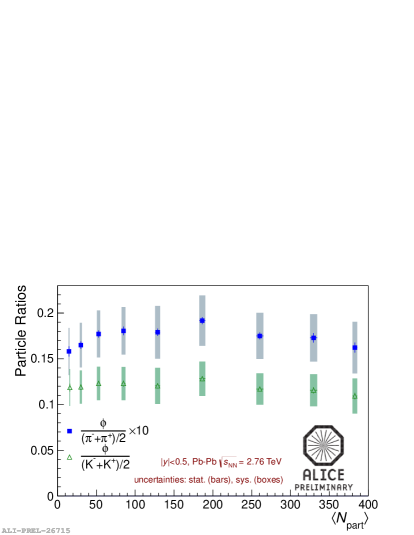
The total -integrated yields of mesons are calculated by integrating the spectra and using the fits to estimate the yields for GeV and GeV (the yield in the extrapolation regions is of the total yield). The total -integrated yields of charged pions and kaons have been measured in Pb–Pb collisions at using the ALICE detector; these integrated yields are used to calculate the and ratios. Figure 7 shows the and ratios as functions of collision energy from SPS energies to LHC energies. Figure 7a shows the and ratios as functions of (the mean number of nucleons participating in collisions for a given centrality bin).
In Pb–Pb collisions, the and ratios do not depend on collisions centrality. In hadron transport models such as RQMD and UrQMD [36, 17, 37], where the dominant production mechanism for mesons is kaon coalescence , the ratio is predicted to be larger for more central collisions (increasing roughly linearly with ) [38, 28]. The ratio observed in Pb–Pb collisions at does not increase for more central events, suggesting that mesons are not produced dominantly through kaon coalescence. Similar behavior was observed at RHIC [35, 28]. The ratio does not exhibit a clear dependence on collision system or energy from RHIC to LHC energies. The ratio in Pb–Pb collisions at is consistent with the thermal model prediction [11].
The ratios measured in pp and Pb–Pb collisions at LHC energies are consistent with each other; at RHIC energies, the ratios measured using the PHENIX detector are also consistent in pp and Au–Au collisions, but the ratio measured using the STAR detector is higher for Au–Au collisions. The ratio in Pb–Pb collisions at is below the thermal model prediction.
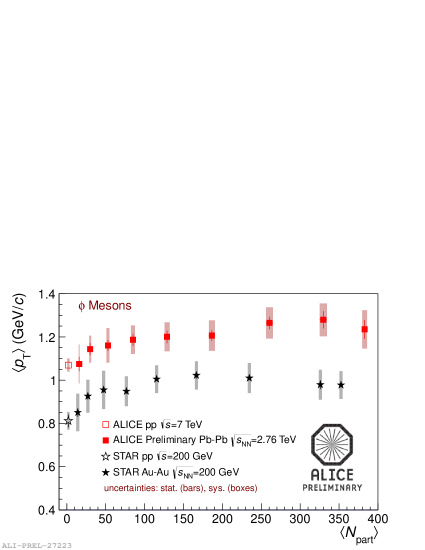
The mean transverse momentum of mesons was calculated based on the data points (with the fits used to account for the low- and high- extrapolation regions). Figure 7b shows for the two resonances for pp and nucleus-nucleus collisions at RHIC and LHC energies. For Pb–Pb collisions at , there may be a weak centrality dependence in , although the values in central and peripheral collisions are still consistent within uncertainties. The values at LHC energies are higher than the observed at RHIC energies. The values in peripheral Pb–Pb collisions at are consistent with the values measured in pp collisions at .
6 Jet-Resonance Correlations
6.1 Method
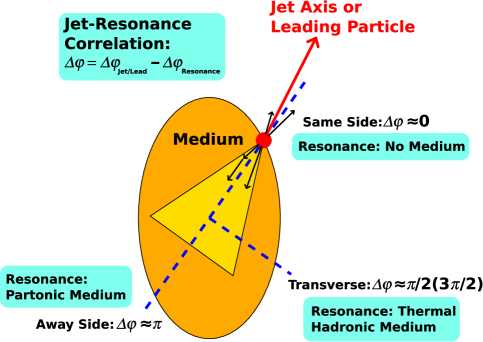
The jet-resonance correlation method has been proposed [18] as a way to preferentially select for resonances that interacted with the partonic medium or the mixed phase (and which would therefore be more likely to exhibit the signatures of chiral symmetry restoration). While the ideal implementation of this method involves full jet reconstruction for use as a trigger, the current results use high- hadrons as triggers (serving as proxies for jets). The difference in azimuthal angle between a resonance and the trigger hadron is computed. As shown in Figure 8, a nucleus-nucleus collision can be divided into three regions in . For the “near side,” (), both the jet and the resonance should be surface-biased. It is argued that the resonance has a lower probability of interacting with the medium and therefore a lower probability of exhibiting a mass shift or width broadening. In the “transverse region,” () resonances are expected to come predominantly from thermal production in the hadronic medium, meaning the resonances would be less likely to interact with the chirally restored medium. In contrast, on the “away side” from the (surface-biased) jet, for , the probability that the resonance interacted with the medium is expected to be greater. At low , the resonance signal (even on the away side) would be affected by interactions in the hadronic phase (re-scattering and regeneration). At high on the away side, the resonances would be more likely both to interact with the medium when chiral symmetry was restored and to have decay products with enough momentum to escape the hadronic phase with minimal interaction. Therefore, it was proposed that resonances with high transverse momentum ( GeV) on the away side, opposite a trigger jet or hadron, would be more likely to exhibit a shift in mass or an increase in width, expected signatures of chiral symmetry restoration.
6.2 Results
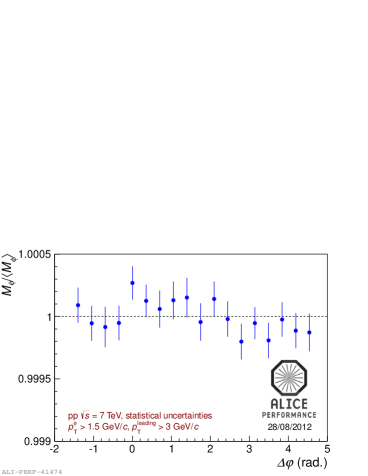
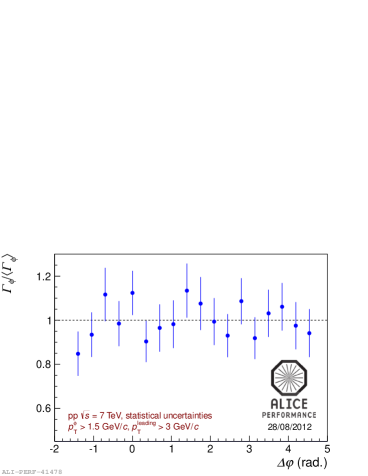
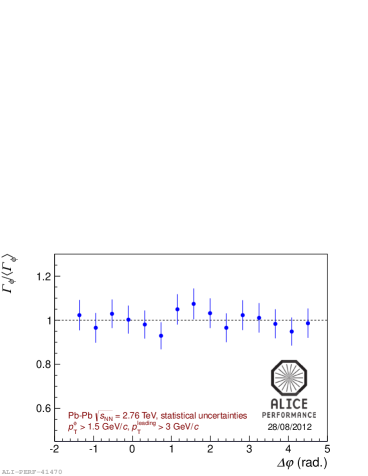
Using the ALICE detector, has been measured [25], using leading trigger hadrons with GeV and mesons with GeV. Figure 9 shows the mass (upper row) and width (lower row) of mesons (divided by the mean of the measured values) as functions of in pp collisions at (left column) and Pb–Pb collisions at (right column). The behavior of this distribution is similar for pp and Pb–Pb collisions. Furthermore, there is no clear difference in the mass and width measured in the away side () in Pb–Pb collisions in comparison to the near side ().
(a)

(b)
(c)
(d)
7 Conclusion
The spectra (for GeV), total yields, mean transverse momenta, mass, and width of the meson and the mass and width of the meson have been measured in Pb–Pb collisions at using the ALICE detector. No centrality dependence has been observed in the masses or widths of either resonance. The mass values are not consistent with the nominal value at low , but are consistent with the mass measured in pp collisions (indicating that the observed deviation is likely an instrumental effect). The width is consistent with the nominal value. The mass of the meson is within 0.5 MeV of the nominal value, while the width is within 1-2 MeV of its nominal value; similar deviations are observed when simulated mesons are analyzed using the same methods. The and ratios in Pb–Pb collisions do not depend on collision centrality, indicating that mesons are not produced predominantly through kaon coalescence. These ratios are consistent with the values measured in pp collisions at GeV and . The values for mesons at LHC energies are higher than the values measured at RHIC energies. The angular correlations between leading trigger hadrons and mesons have been measured in pp and Pb–Pb collisions, but no difference in the resonance mass or width between the near and away sides (relative to the trigger axis) has been observed. However, it may be necessary to increase the transverse-momentum limits on the trigger particles and the mesons in order to obtain a sample of resonances that exhibit the signatures of chiral symmetry restoration.
References
References
- [1] Aoki Y, Fodor Z, Katz S D and Szabó K K 2006 Phys. Lett. B 643 46–54
- [2] Aoki Y, Borsányi S, Dürr S, Fodor Z, Katz S D, Krieg S and Szabo K 2009 J. High Energy Phys. 2009 No. 6 1–17
- [3] Borsányi S, Fodor Z, Hoelbling C, Katz S D, Krieg S, Ratti C and Szabó K K 2010 J. High Energy Phys. 2010 No. 9 1–31
- [4] Bleicher M and Stöcker H 2004 J. Phys. G 30 S111–8
- [5] Markert C, Torrieri G and Rafelski J 2002 Proc. of PASI 2002 (Preprint hep-ph/0206260)
- [6] Vogel S and Bleicher M 2005 Proc. of Nucl. Phys. Winter Meeting 2005 in Bormio (Preprint nucl-th/0505027v1)
- [7] Bleicher M and Aichelin J 2002 Phys. Lett. B 530 81–7
- [8] Torrieri G and Rafelski J 2001 Phys. Lett. B 509 239–45
- [9] Andronic A, Braun-Munzinger P and Stachel J 2009 Phys. Lett. B 673 142–5
- [10] Braun-Munzinger P and Stachel J 2011 From Nuclei To Stars: Festschrift in Honor of Gerald E Brown ed Lee S (Singapore: World Scientific) (Preprint 1101.3167v1)
- [11] Andronic A, Braun-Munzinger P and Stachel J 2011 J. Phys. G 38 124081
- [12] Petreczky P 2007 Nucl. Phys. A 785 10–7
- [13] Rapp R, Wambach J and van Hees H 2009 Preprint 0901.3289v1
- [14] Brown G E and Rho M 2002 Rhys. Rep. 363 85–171
- [15] Brodsky S J and de Teramond G F 1988 Phys. Rev. Lett. 60 1924–7
- [16] Eletsky V L, Belkacem M, Ellis P J and Kapusta J I 2001 Phys. Rev. C 64 035202
- [17] Bleicher M 1999 J. Phys. G 25 1859–96
- [18] Markert C, Bellwied R and Vitev I 2008 Phys. Lett. B 669 92–7
- [19] Vogel S, Aichelin J and Bleicher M 2010 J. Phys. G 37 094046
- [20] Aamodt K (ALICE Collaboration) 2008 J. Inst. 3 No. S08002 i–245
- [21] Alme J 2010 Nucl. Inst. Meth. in Phys. Res. A 622 316–67
- [22] Caminati F 2004 J. Phys. G 30 1517
- [23] Akindinov A N 2004 Eur. Phys. J. C 32 s165–77
- [24] Beringer J (Particle Data Group) 2012 Phys. Rev. D 86 010001
- [25] Markert C (for the ALICE Collaboration) 2012 Acta Physica Polonica B Proc. Supplement 5 243–8
- [26] Schnedermann E, Sollfrank J and Heinz U 1993 Phys. Rev. C 48 2462–75
- [27] Afanasiev S V (NA49 Collaboration) 2000 Phys. Lett. B 491 59–66
- [28] Abelev B I (STAR Collaboration) 2009 Phys. Rev. C 79 064903
- [29] Adare A (PHENIX Collaboration) 2011 Phys. Rev. C 83 064903
- [30] Adare A (PHENIX Collaboration) 2011 Phys. Rev. D 83 052004
- [31] Adler S S (PHENIX Collaboration) 2005 Phys. Rev. C 72 014903
- [32] Aamodt K (ALICE Collaboration) 2011 Eur. Phys. J. C 71 1655 1–22
- [33] Aamodt K (ALICE Collaboration) 2011 Eur. Phys. J. C 71 1594 1–24
- [34] Abelev B (ALICE Collaboration) 2012 CERN-PH-EP-2012-221 (Preprint 1208.5717v2)
- [35] Adams J (STAR Collaboration) 2005 Phys. Lett. B 612 181–9
- [36] Sorge H 1995 Phys. Rev. C 52 3291–314
- [37] Lu Y, Bleicher M, Liu F, Liu Z, Petersen H, Sorensen P, Stöcker H, Xu N and Zhu X 2006 J. Phys. G 32 1121–9
- [38] Mohanty B and Xu N 2009 J. Phys. G 36 064022