-titleConference Title, to be filled
Differential population studies using asteroseismology: solar-like oscillating giants in CoRoT fields LRc01 and LRa01
Abstract
Solar-like oscillating giants observed by the space-borne satellites CoRoT and Kepler can be used as key tracers of stellar populations in the Milky Way. When combined with additional photometric/spectroscopic constraints, the pulsation spectra of solar-like oscillating giant stars not only reveal their radii, and hence distances, but also provide well-constrained estimates of their masses, which can be used as proxies for the ages of these evolved stars. In this contribution we provide supplementary material to the comparison we presented in Miglio et al. (2013) between populations of giants observed by CoRoT in the fields designated LRc01 and LRa01.
This contribution is organised as follows. In §1, we briefly recall how global stellar properties (mass, radius, distance) are determined using average seismic constraints, while we refer to Miglio2013a for a general motivation behind this study, the methods adopted, and main results obtained. In §2 we present the data used in this study, along with independent verifications of the asteroseismic radius and mass determination available in the literature (§2.1). Comparisons between the properties of the population observed in LRa01 and LRc01 are presented in §3. Finally, a comparison of observed and synthetic populations computed using parameterised models of the Milky Way is discussed in §4.
1 Determination of global stellar properties
Radii and masses of solar-like oscillating stars can be estimated from the average seismic parameters that characterise their oscillation spectra: the so-called average large frequency separation (), and the frequency corresponding to the maximum observed oscillation power (). We refer to (Miglio2013a, ) for a discussion on the method.
We determine stellar radii and masses by combining the available seismic parameters and with effective temperatures . The latter are determined using 2MASS (Skrutskie2006, ) and photometry and the colour- calibrations by (Alonso1999, ), which depend only weakly on metallicity. 2MASS colours were transformed into the CIT photometric system used by (Alonso1999, ) using the relations available in (Alonso1998, ) and (Carpenter2001, ).
We then compute luminosities using the Stefan-Boltzmann law: , where is the Stefan-Boltzmann constant. The distance modulus of each star is determined as , where is the de-reddened apparent 2MASS magnitude, and the absolute magnitude. The latter is obtained combining and the bolometric corrections from (Girardi05, ), which are based on Castelli & Kurucz 2005 ATLAS9 model atmospheres, for the range of and into consideration.
We take into account the effect of interstellar extinction on the magnitude and colour of each star using the 3D model of Galactic extinction in the band () by (Drimmel2003, ). The extinction in the and bandpasses were determined following (Fiorucci2003, ) assuming the spectral energy distribution of a K1 giant. Since the extinction is distance dependent, we iterate the procedure until the derived distance does not vary by more than . We choose to consider magnitudes in the near-IR to reduce the effect of interstellar reddening in both the determination of and apparent de-reddened magnitudes.
2 Data available and uncertainties on stellar properties
The CoRoT photometric time series used in this work were obtained in the so-called exofield during the first long CoRoT runs in the direction of the Galactic centre (LRc01) and in the opposite direction (LRa01). These long runs lasted approximately 140 days, providing us with a frequency resolution of about 0.08 Hz. A first analysis of these data was made by (DeRidder09, ), (Hekker09, ) and (Kallinger2010, ). Solar-like oscillations were detected in 435 and 1626 giants belonging to LRa01 and LRc01, respectively. To derive ,, and distance we use the values (and uncertainties) of and as determined by (Mosser2010, ). The typical uncertainty on and for the 150-d long CoRoT observations is of the order of 2.4 % and 0.6 %, respectively.
The uncertainties on the stellar properties are estimated using Monte Carlo simulations adopting the following constraints:
-
•
Apparent magnitudes: uncertainties on and are taken from the 2MASS photometry available in the EXODAT (Deleuil2009, ) catalogue (the median uncertainty is 0.02 mag).
-
•
Extinction/reddening: a random error in of 0.3 mag was considered both in determining photometrically and in de-reddening apparent magnitudes.
-
•
: for each star we considered two sources of uncertainty. The first (100 K) due to uncertainties on the colour- calibration itself (Alonso1999, ). The second one due to uncertainties on reddening. This results in a median combined uncertainty on of K (calibration+reddening).
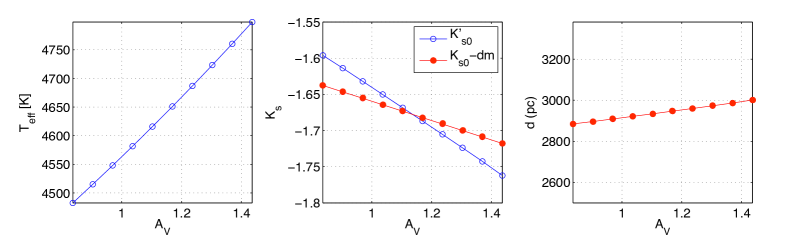
We notice that, when determining the distance, the effect of reddening affects not only the de-reddened apparent bolometric magnitude, but also the determination of (mostly via ). A higher increases the estimated , hence , but it also increases the apparent de-reddened luminosity . Since , the overall effect of reddening on the distance itself is partly reduced (see Fig 1).
By performing 500 realisations of the data assuming the uncertainties described above to be Gaussian, we find a median intrinsic uncertainty of 5 % in distance, 3.6 % in radius, and 10 % in mass.
To explore the effect of possible systematic offsets in the scale, we increased/decreased by 100 K, and found that the distance estimate is affected by (the radius by 1 % and the mass by 3 %). These uncertainties may be further reduced when spectroscopic constraints will be available, however, since the estimates of and are based upon seismic scaling relations, care has to be taken on possible systematic uncertainties which are not taken into account in the estimates presented so far. Scaling relations for and are based on simplifying assumptions that need to be independently verified, and supported with empirical tests.
2.1 Independent verification of the asteroseismic radius/distance and mass determination
In addition to preliminary investigations with stellar models (see e.g. (Stello2009a, ; White2011, ), the Supporting Online Material of (Chaplin2011, ), (Miglio2012, )), empirical tests of the asteroseismic radius determination are now available for:
-
•
27 nearby dwarf and giant stars with precise Hipparcos parallaxes and asteroseismic constraints obtained with CoRoT data or ground-based spectroscopic campaigns. As shown in (Miglio2012, ) for this set of targets the mean difference between seismic radii and those estimated by classical constraints is , with a standard deviation of .
-
•
22 dwarfs with available Kepler asteroseismic data and precise Hipparcos parallaxes (see (SilvaAguirre2012, )). The comparison shows that there is an overall agreement within between the distance obtained using the asteroseismic radii and the Hipparcos one. Additional stringent tests were carried out by (Huber2012, ), including interferometric constraints on angular radii, showing that estimates of asteroseismic radii for main-sequence stars are accurate to better than 5 %.
-
•
Giants belonging to the old-open cluster NGC6791. There is a remarkable agreement between the distance determination based on eclipsing binaries (Brogaard2011, ) and the one based on the radius determination of RGB stars (see (Basu2011, ; Miglio2012, )). While the seismic and “classical”111Determined using distance modulus derived from eclipsing binaries, apparent magnitudes, bolometric corrections and radii agree within 5 %, evidence for a small () but significant discrepancy between the two determinations of radii was found for red-clump stars.
-
•
Detailed modelling of individual frequencies available so far for two RGB giants (DiMauro2011, ; Jiang2011, ) leads to radii and masses which agree within (i.e. and , respectively) with those derived combining , , and .
-
•
The radius distribution of stars in the observed CoRoT populations is dominated by an isolated peak at R⊙ which is in agreement with the theoretically predicted radius of red-clump stars. Moreover, as reported (Miglio2012b, ), the peak in the distribution of the absolute magnitudes of pulsating giants in the CoRoT fields is in agreement with the mean absolute magnitude of Hipparcos red-clump giants (Groenewegen08, ; Laney2012, ). This agreement represents a further argument in support of the seismically derived distances, since in old composite populations the absolute magnitude of clump stars is expected to depend little on the details of the population itself (see Girardi01, ).
Based on the tests reported above, we consider a 5 % systematic uncertainty on the radius determination. This leads to an overall uncertainty on the distance of 5 % (random) + 5 % (systematic due to radius determination via scaling relations) + 2.5 % (systematic due to the scale).
Independent tests of the mass determined using seismic scaling relations are less numerous and stringent: precise estimates of stellar mass are typically available only for visual/eclipsing binaries or via model-dependent estimates (e.g. isochrone fitting in clusters):
-
•
Direct mass measurements are available only for a handful of dwarfs with detected solar-like oscillations (see Bedding2011b, ; Miglio2012c, ). Self-consistency checks of the mass determination were performed in (Miglio2012c, ) combining or alone with independent radii determinations, but given the large uncertainties in the data used, these comparisons could not test the consistency of the mass determination (using or ) to better than 15-20 %.
-
•
As recalled above, (DiMauro2011, ) and (Jiang2011, ) showed that, in the two cases analysed, detailed modelling of individual frequencies in (low-luminosity) giants leads to masses which are within 5 % those determined using scaling relations. These tests should be performed for a much wider set of targets, encompassing stars of different mass, metallicity, and evolutionary state.
-
•
The strongest constraints are provided by giants in clusters. Independent radius estimates of stars in NGC6791 were used in (Miglio2012, ) to check consistency of the mass determination using the scaling relation for or alone. While no significant systematic effect was found on the RGB, (Miglio2012, ) suggested that a relative correction to the scaling relation should be considered between RC and RGB stars, affecting the mass determination of clump stars by .
By combining constraints from near-turnoff eclipsing binaries and stellar models, (Brogaard2012, ) determined precisely the mass of stars on the lower RGB of NGC6719. Their value agrees within with the average mass of RGB stars determined by (Basu2011, ) and (Miglio2012, ). The difference is however significant given the quoted uncertainties, and further work is needed to understand the origin of the discrepancy.
-
•
Finally, the mass of giants in NGC6819 derived from seismology (Basu2011, ; Miglio2012, ) is also in good agreement () with the one estimated from isochrone fitting (Kalirai2004, ; Hole2009, ), but the uncertainties and model-dependence of the latter method do not provide a stringent test to the seismically determined mass.
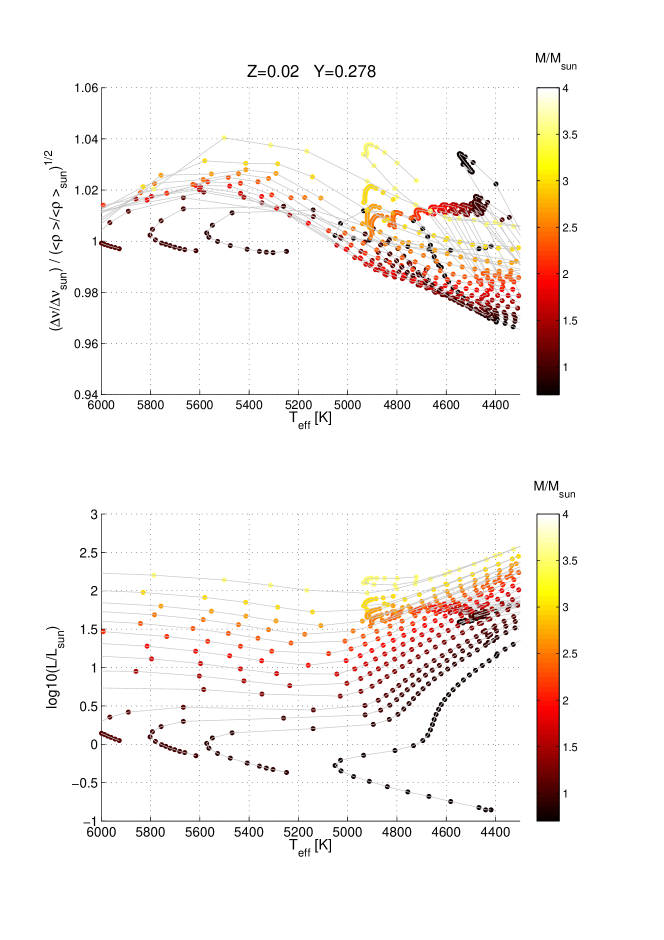
It is clear that additional tests against independent estimates of mass and radius are needed, and in particular for metal-poor stars, which are under-represented in the above-mentioned tests. In addition to these empirical tests, computed from model frequencies may be used to correct, or at least investigate, possible shortcomings in the scaling relation. Work in this direction was already presented in White2011 and extended, although for a specific case only, to He-burning stars in Miglio2012 . This approach captures both the deviation from the asymptotic expression due to the varying radial order of the observed modes, as well as to the different sound-speed distribution, hence acoustic radius, of stars with same mean density. In Fig. 2 we present an example of such model-predicted correction, which extend tests presented in White2011 to stars in the the core-He burning phase. More detailed results will be presented in a forthcoming work.
Because we have much less confidence in theoretical computations of – which rely on the complicated excitation and damping processes – than we do in theoretical predictions of the oscillation frequencies, model-computed have so far not been used in stellar properties estimation. More work is needed to understand the observed scaling, and theoretical studies have made progress on the problem (e.g., see Belkacem2011 ).
3 Comparison between populations observed in LRa01 and in LRc01
Before comparing populations of giants observed in the two fields, we check whether different biases were introduced in the target selection in LRa01 and LRc01.
3.1 CoRoT target selection
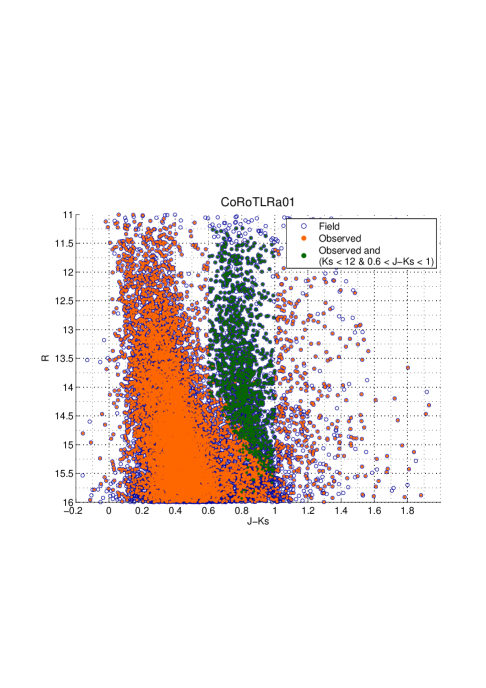
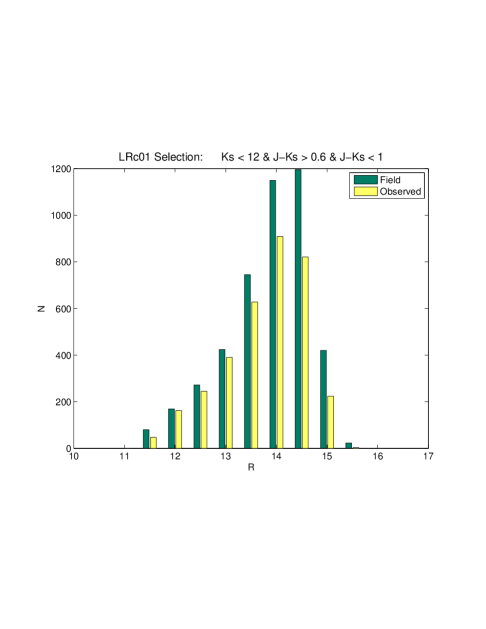
We retrieved from EXODAT (Deleuil2009, ) photometric information on all the stars in the field, as well as the targets observed. As shown in Fig. 3, targets within each field of view were selected largely on the basis of colour-magnitude criteria. Within the observed targets, solar-like oscillations were searched for in stars belonging to a limited colour-magnitude domain: and (see Mosser2010, ). Restricting to this domain, we find no significant difference in the target selection bias applied to LRc01 compared to LRa01.


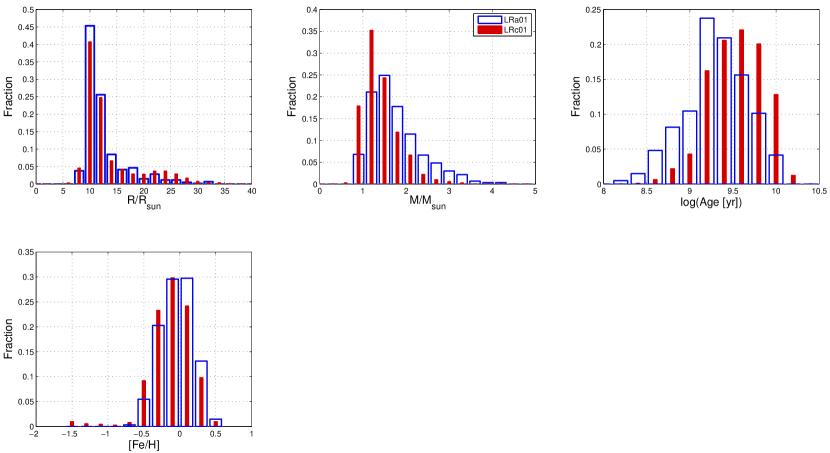
3.2 Distributions of radius and mass
Among the 435 (1626) giants with detected solar-like oscillations in LRa01 (LRc01), 198 (678) have SNR high enough not only to detect and but also to have a detailed characterisation of the envelope corresponding to the oscillation power excess (see Sec. 2.2 in (Mosser2010, )). In what follows we shall refer to these two samples as N2 and N3, following the notation introduced in Mosser2010 .
We now compare the distributions of radius and mass of stars in LRa01 and LRc01. Since scaling relations were not tested at high luminosities we excluded from the sample the few stars with L⊙, and stars with no 2MASS photometry available. The fraction of targets excluded represents of the whole sample of N3 data.
As described in Miglio2013a , we applied the Kolmogorov-Smirnov (K-S) test to the distributions of mass and radius to quantify differences between the two populations. We considered both N2 and N3 sets of data, including stars of all radii, or restricting to giants with R⊙. When comparing radii, the null hypothesis (LRa01 and LRc01 samples are drawn from the same parent distribution) cannot be rejected, or the difference between the two populations is marginally significant at best. On the other hand, we find the difference between the mass distribution of the two populations highly significant (K-S probability higher than 99.9 %), with stars in LRc01 having a lower average mass than those in LRa01.
To test the impact of statistical uncertainties on mass and radius on the K-S test, we perturbed the observed radii and masses adding a random offset drawn from a Gaussian distribution having a standard deviation equal to the estimated uncertainty on the mass / radius. We generated 1000 realisations of such distributions and performed a K-S test on each realisation. The distribution of results from the 1000 K-S tests confirms that while comparing radius the null hypothesis cannot be rejected, the difference in the mass distribution is significant (in 95 % of the realisations the K-S probabilities are higher than 99 %) .
4 Comparison with synthetic stellar populations
For a meaningful comparison between observed and synthetic populations, we apply to the synthetic population the same selection criteria based on colour and magnitude adopted in the target selection. Moreover, as discussed in detail in (Mosser2010, ), since no significant bias in the distribution of the targets is present in the range between 6 Hz and 80 Hz, we shall only consider observed and simulated stars with in this frequency range.
.
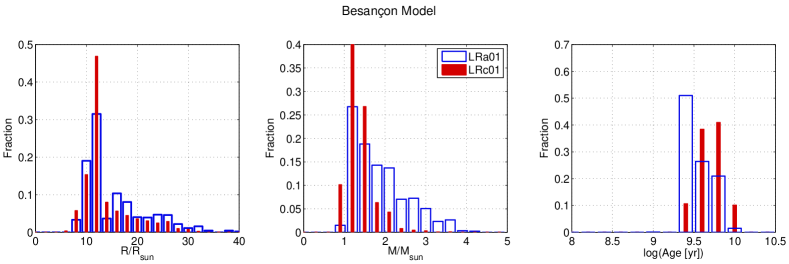
We consider synthetic populations computed with two codes: the Besançon Model of the Milky Way (see e.g. Robin03, ; Robin2012, , for a detailed description), and with TRILEGAL (Girardi05, ; Girardi2012, ). TRILEGAL builds a geometric model for the Milky Way (MW), including main components such as the thin and thick disks, halo and bulge, each one containing a particular stellar population. The latter are defined by means of a star formation rate and age-metallicity relation. The main geometric parameters of the MW components are then calibrated using wide-area data for several lines-of-sight and for magnitudes at which the reddening is small and at magnitudes for which problems such as photometric incompleteness and star/galaxy separation are not an issue. Then, this simple model is applied everywhere in the MW, for different filters, and at deeper magnitudes, making the implicit assumption that the several MW components (but for the interstellar dust) are smoothly distributed and quite uniform in their distributions of ages/metallicities.
Simulations with both TRILEGAL and the Besançon Model (see Fig. 4 and 5) show that, although a similar distribution of radius is expected in LRa01 and LRc01, the age (hence mass) distribution of the two populations of giants is expected to differ. Stars in LRc01 are expected to be older -on average- than those in LRa01.
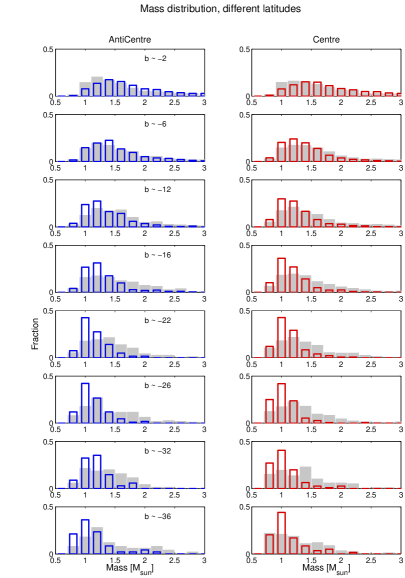
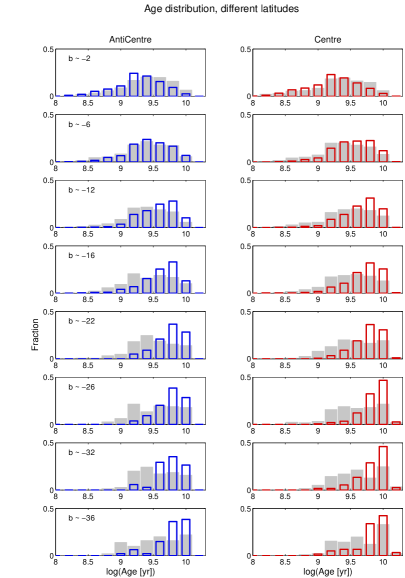
To check whether in the synthetic populations the difference between LRc01 and LRa01 is due to a different latitude, we simulated with TRILEGAL CoRoT fields at decreasing latitudes, and fixing the longitude to that of LRa01 and LRc01 (see Fig. 6). The expected distribution of mass and age are presented in Figure 7. In the magnitude range observed by CoRoT, while a broad spectrum of age / mass is expected for giants in low-latitude fields, only old stars are expected to populate high-latitude fields. In these models the difference in the mass distribution of stars in LRc01 () and LRa01 () is dominated by the different latitudes (hence different average height below the plane).
Our aim here is not to find the synthetic population that best matches the data, but to show that the difference we see in the observed distribution is in qualitative agreement with the simulations which include an increase of the disk scale height with age. To check the effect of this assumption on the predicted distributions of mass and age, we computed with TRILEGAL synthetic populations imposing an age-independent vertical scale height of the disk, and setting the latter to 300 pc. As shown in Fig. 7 in this case we do not expect to see a clear mass / age gradient with latitude.
TRILEGAL simulations also suggest that the sample observed in the two fields is dominated by thin disk stars, with a combined fraction of thick disk and halo stars . The bulge component, while obviously absent in LRa01, contributes by to the population in LRc01.

5 Grid based method: age estimates
The age of RGB and red-clump stars is largely determined by their main-sequence lifetime and hence, to a first approximation, by their mass. To estimate the age of giants in the two observed populations we use PARAM, a Bayesian stellar parameter estimation method described in detail in (DaSilva2006, ). PARAM is largely inspired by the method developed in (Joergensen2005, ), which is designed to avoid statistical biases and to take error estimates of all observed quantities into consideration. For this work we adapted PARAM to include as additional observational constraints , , and, when available, the evolutionary status of the star (core- Helium or hydrogen-shell burning phase), as determined by the period spacing of gravity-dominated modes (see Mosser2011 ). Having knowledge of the evolutionary status is particularly useful in the age determination of stars with an estimated radius typical of RC giants. Since the mass of core-He burning stars is likely to be affected by mass loss, the age-mass relation in red-clump stars may be different from that of RGB stars (see e.g. Fig. 1 in Miglio2012 ). This extended version of PARAM will be made available, via an interactive web form, at the URL http://stev.oapd.inaf.it/param.
The main assumptions of the method are: a maximum value for the age, which we set to 10 Gyr, a prior that all ages are equally likely and, given that no information on the metallicity of these stars is available, a broad gaussian distribution is assumed as prior for the metallicity. The gaussian distribution is centred at [Fe/H]=-0.5, has a standard deviation , and ranges from [Fe/H] to [Fe/H] . Finally, an implicit hypothesis of the method is that theoretical models provide a reliable description of the way stars of different mass, metallicity, and evolutionary stage distribute along the red-giant phase.
We apply this parameter estimation method to the sample of giants observed in LRc01 and LRa01. The uncertainty on the age as estimated using PARAM is of the order of 30-40 %. The results obtained with a model-based approach support the interpretation that the differences between the observed population in LRa01 and LRc01 are due to a different mass, hence age, distribution. By performing K-S tests on 1000 realisations of the populations taking into account Gaussian uncertainties in the age determination, we find the difference between the age distributions of the two populations highly significant.
The precision of the age determination will significantly improve when constraints on the photospheric chemical composition will be available. In this context, and perhaps even more relevant, are tests to be performed on the accuracy of the age (and mass) estimates obtained assuming scaling relations for and (as discussed at the end of Sec. 2.1). Making use of the full set of seismic constraints (individual frequencies of both acoustic and gravity-dominated modes) will possibly provide more stringent estimates of systematic uncertainties. We consider this our next, high-priority, step in this line of work.
Acknowledgements.
AM is thankful to the organisers of the conference for financial support. TM acknowledges financial support from Belspo for contract PRODEX GAIA-DPAC. JM and MV acknowledge financial support from Belspo for contract PRODEX COROT.References
- (1) A. Miglio, Chiappini, C., T. Morel, W.J. Barbieri, M. Chaplin, L. Girardi, J. Montalbán, M. Valentini, B. Mosser, F. Baudin, L. Casagrande et al., MNRAS(2013), in press, arXiv:astro-ph/1211.0146
- (2) M.F. Skrutskie, R.M. Cutri, R. Stiening, M.D. Weinberg, S. Schneider, J.M. Carpenter, C. Beichman, R. Capps, T. Chester, J. Elias et al., AJ131, 1163 (2006)
- (3) A. Alonso, S. Arribas, C. Martínez-Roger, A&AS140, 261 (1999)
- (4) A. Alonso, S. Arribas, C. Martinez-Roger, A&AS131, 209 (1998)
- (5) J.M. Carpenter, AJ121, 2851 (2001)
- (6) L. Girardi, M.A.T. Groenewegen, E. Hatziminaoglou, L. da Costa, A&A436, 895 (2005)
- (7) R. Drimmel, A. Cabrera-Lavers, M. López-Corredoira, A&A409, 205 (2003)
- (8) M. Fiorucci, U. Munari, A&A401, 781 (2003)
- (9) J. De Ridder, C. Barban, F. Baudin, F. Carrier, A.P. Hatzes, S. Hekker, T. Kallinger, W.W. Weiss, A. Baglin, M. Auvergne et al., Nature459, 398 (2009)
- (10) S. Hekker, T. Kallinger, F. Baudin, J. De Ridder, C. Barban, F. Carrier, A.P. Hatzes, W.W. Weiss, A. Baglin, A&A506, 465 (2009)
- (11) T. Kallinger, W.W. Weiss, C. Barban, F. Baudin, C. Cameron, F. Carrier, J. De Ridder, M.J. Goupil, M. Gruberbauer, A. Hatzes et al., A&A509, A77 (2010)
- (12) B. Mosser, K. Belkacem, M.J. Goupil, A. Miglio, T. Morel, C. Barban, F. Baudin, S. Hekker, R. Samadi, J. De Ridder et al., A&A517, A22 (2010)
- (13) M. Deleuil, J.C. Meunier, C. Moutou, C. Surace, H.J. Deeg, M. Barbieri, J. Debosscher, J.M. Almenara, F. Agneray, Y. Granet et al., AJ138, 649 (2009)
- (14) D. Stello, W.J. Chaplin, S. Basu, Y. Elsworth, T.R. Bedding, MNRAS400, L80 (2009), 0909.5193
- (15) T.R. White, T.R. Bedding, D. Stello, J. Christensen-Dalsgaard, D. Huber, H. Kjeldsen, ApJ743, 161 (2011)
- (16) W.J. Chaplin, H. Kjeldsen, J. Christensen-Dalsgaard, S. Basu, A. Miglio, T. Appourchaux, T.R. Bedding, Y. Elsworth, R.A. García, R.L. Gilliland et al., Science 332, 213 (2011)
- (17) A. Miglio, K. Brogaard, D. Stello, W.J. Chaplin, F. D’Antona, J. Montalbán, S. Basu, A. Bressan, F. Grundahl, M. Pinsonneault et al., MNRAS419, 2077 (2012)
- (18) V. Silva Aguirre, L. Casagrande, S. Basu, T.L. Campante, W.J. Chaplin, D. Huber, A. Miglio, A.M. Serenelli, J. Ballot, T.R. Bedding et al., ApJ757, 99 (2012)
- (19) D. Huber, M.J. Ireland, T.R. Bedding, I.M. Brandão, L. Piau, V. Maestro, T.R. White, H. Bruntt, L. Casagrande, J. Molenda-Żakowicz et al., ApJ760, 32 (2012)
- (20) K. Brogaard, H. Bruntt, F. Grundahl, J.V. Clausen, S. Frandsen, D.A. Vandenberg, L.R. Bedin, A&A525, A2 (2011)
- (21) S. Basu, F. Grundahl, D. Stello, T. Kallinger, S. Hekker, B. Mosser, R.A. García, S. Mathur, K. Brogaard, H. Bruntt et al., ApJ729, L10 (2011)
- (22) M.P. Di Mauro, D. Cardini, G. Catanzaro, R. Ventura, C. Barban, T.R. Bedding, J. Christensen-Dalsgaard, J. De Ridder, S. Hekker, D. Huber et al., MNRAS415, 3783 (2011)
- (23) C. Jiang, B.W. Jiang, J. Christensen-Dalsgaard, T.R. Bedding, D. Stello, D. Huber, S. Frandsen, H. Kjeldsen, C. Karoff, B. Mosser et al., ApJ742, 120 (2011)
- (24) A. Miglio, T. Morel, M. Barbieri, B. Mosser, L. Girardi, J. Montalbán, M. Valentini, Assembling the Puzzle of the Milky Way, Le Grand-Bornand, France, Edited by C. Reylé; A. Robin; M. Schultheis; EPJ Web of Conferences, Volume 19, id.05012 19, 05012 (2012)
- (25) M.A.T. Groenewegen, A&A488, 935 (2008)
- (26) C.D. Laney, M.D. Joner, G. Pietrzyński, MNRAS419, 1637 (2012)
- (27) L. Girardi, M. Salaris, MNRAS323, 109 (2001)
- (28) T.R. Bedding, ArXiv e-prints (2011), arxiv:astro-ph/1107.1723
- (29) A. Miglio, Asteroseismology of red giants as a tool for studying stellar populations: first steps, in Red Giants as Probes of the Structure and Evolution of the Milky Way, edited by A. Miglio, J. Montalbán, A. Noels (2012), ApSS Proceedings
- (30) K. Brogaard, D.A. VandenBerg, H. Bruntt, F. Grundahl, S. Frandsen, L.R. Bedin, A.P. Milone, A. Dotter, G.A. Feiden, P.B. Stetson et al., A&A543, A106 (2012)
- (31) J.S. Kalirai, M. Tosi, MNRAS351, 649 (2004)
- (32) K.T. Hole, A.M. Geller, R.D. Mathieu, I. Platais, S. Meibom, D.W. Latham, AJ138, 159 (2009)
- (33) K. Belkacem, M.J. Goupil, M.A. Dupret, R. Samadi, F. Baudin, A. Noels, B. Mosser, A&A530, A142 (2011)
- (34) P. Ventura, F. D’Antona, I. Mazzitelli, Ap&SS316, 93 (2008)
- (35) R. Scuflaire, S. Théado, J. Montalbán, A. Miglio, P.O. Bourge, M. Godart, A. Thoul, A. Noels, Ap&SS316, 83 (2008), 0712.3471
- (36) J. Montalbán, A. Miglio, A. Noels, R. Scuflaire, P. Ventura, ApJ721, L182 (2010), 1009.1754
- (37) J. Montalbán, A. Miglio, A. Noels, M.A. Dupret, R. Scuflaire, P. Ventura, ApJ(2012), submitted
- (38) A. Robin, C. Reylé, D. Marshall, M. Shultheis, The Besancon Model of stellar Population synthesis of the Galaxy, in Red Giants as Probes of the Structure and Evolution of the Milky Way, edited by A. Miglio, J. Montalbán, A. Noels (2012), ApSS Proceedings
- (39) A.C. Robin, C. Reylé, S. Derrière, S. Picaud, A&A409, 523 (2003)
- (40) L. Girardi, M. Barbieri, M. Groenewegen, P. Marigo, A. Bressan, H. Rocha-Pinto, B. Santiago, J. Camargo, L. da Costa, TRILEGAL, a TRIdimensional modeL of thE GALaxy: status and future, in Red Giants as Probes of the Structure and Evolution of the Milky Way, edited by A. Miglio, J. Montalbán, A. Noels (2012), ApSS Proceedings
- (41) L. da Silva, L. Girardi, L. Pasquini, J. Setiawan, O. von der Lühe, J.R. de Medeiros, A. Hatzes, M.P. Döllinger, A. Weiss, A&A458, 609 (2006)
- (42) B.R. Jørgensen, L. Lindegren, A&A436, 127 (2005)
- (43) B. Mosser, C. Barban, J. Montalbán, P.G. Beck, A. Miglio, K. Belkacem, M.J. Goupil, S. Hekker, J. De Ridder, M.A. Dupret et al., A&A532, A86 (2011)