The Milky Way halo as a QSO absorption-line system
of Galactic high-velocity clouds
We use archival UV absorption-line data from HST/STIS to statistically analyse the absorption characteristics of the high-velocity clouds (HVCs) in the Galactic halo towards more than 40 extragalactic background sources. We determine absorption covering fractions of low- and intermediate ions (O i, C ii, Si ii, Mg ii, Fe ii, Si iii, C iv, and Si iv) in the range . For detailed analysis we concentrate on Si ii absorption components in HVCs, for which we investigate the distribution of column densities, -values, and radial velocities. Combining information for Si ii and Mg ii, and using a geometrical HVC model we investigate the contribution of HVCs to the absorption cross section of strong Mg ii absorbers in the local Universe. We estimate that the Galactic HVCs would contribute on average percent to the total strong Mg ii cross section of the Milky Way, if our Galaxy were to be observed from an exterior vantage point. We further estimate that the mean projected covering fraction of strong Mg ii absorption in the Milky Way halo and disc from an exterior vantage point is for a halo radius of kpc. These numbers, together with the observed number density of strong Mg ii absorbers at low redshift, indicate that the contribution of infalling gas clouds (i.e., HVC analogues) in the halos of Milky Way-type galaxies to the cross section of strong Mg ii absorbers is percent. These findings are in line with the idea that outflowing gas (e.g., produced by galactic winds) in the halos of more actively star-forming galaxies dominate the absorption-cross section of strong Mg ii absorbers in the local Universe.
Key Words.:
Galaxy: halo - galaxies: halos - ISM: structure1 Introduction
The so-called high-velocity clouds (HVCs) in the halo of the Milky Way are believed to represent an important phenomenon related to the ongoing formation and evolution of galaxies at . HVCs (in their original definition) represent neutral gas clouds seen in H i 21cm emission that are circulating with high radial velocities through the inner and outer regions of the Galactic halo. HVCs in the Milky Way and other galaxies are assumed to connect the central regions of galaxies with the surrounding intergalactic medium (IGM). Following the usual classification scheme, HVCs in the Milky Way have radial velocities of km s-1 compared to the local standard of rest (LSR). Such high velocities are not in agreement with a standard Galactic disc rotation model. In the velocity range km s km s-1 there are the so-called intermediate velocity clouds (IVCs), which complete the classification of Galactic halo clouds. Since their discovery more than 40 years ago (Muller et al. (1966)), a lot of progress has been made in understanding the distribution, origin, and physical properties of HVCs and IVCs (see the reviews by Richter (2006) and Wakker et al. (1998)). QSO absorption-line measurements have shown that HVCs span a relatively large range in metallicities from to solar (e.g., Wakker et al. (1999); Richter et al. (1999); Richter et al. (2001); Wakker (2001); Gibson et al. (2001); Tripp et al. (2003); Collins et al. (2003); Richter et al. (2005); Richter et al. (2009); Shull et al. (2011)), indicating that HVCs and IVCs have various origins. Some HVCs, in particular the “Magellanic Stream” (MS), most likely originate from gas of smaller satellite galaxies that are being accreted by the Milky Way. Other HVCs possibly represent metal-deficient gas that is infalling from the intergalactic medium. The most likely origin for the IVCs (which predominantly have nearly solar metallicities) is the “galactic fountain” (Shapiro & Field (1976); Houck & Bregman (1990)). In the galactic fountain model hot gas is ejected out of the Galactic disc by supernova explosions. The gas then cools and (partly) falls back towards the disc in the form of condensed, neutral gas clouds.
Recent distance estimates of several IVCs and HVCs indicate that most of the IVCs appear to be located within 2 kpc from the Galactic disc, in accordance with the scenario that IVCs represent gas structures related to the galactic fountain (Wakker et al. (2008); Smoker et al. (2011)). Most of the HVCs appear to be located at distances kpc (Wakker et al. (2007); Thom et al. (2006), Thom et al. (2008)), with the prominent exception of the MS, which most likely is located as far as 50 kpc (Gardiner & Noguchi (1996)). These distances indicate that HVCs do not represent Local Group (LG) objects that are related to the missing dark-matter (DM) halos in the LG (Blitz et al. (1999)), but rather indicate gas circulation processes in the immediate environment ( kpc) of the Milky Way. Yet, with a total H i mass of M⊙, HVCs contribute yr-1 to the Milky Way’s gas-accretion rate (Richter (2012);Wakker (2004)). Clearly, detailed studies of IVCs and HVCs are of fundamental importance for our understanding of the past and present evolution of our Galaxy.
H i 21cm observations of nearby spirals (e.g., M31, NGC 891) indicate that the IVC/HVC phenomenon is not restricted to the Milky Way, but reflects gas-circulation processes at large scales that are characteristic of low-redshift galaxies in general (Thilker et al. (2004); Oosterloo et al. (2007); Fraternali et al. (2007)). However, because of the limited sensitivity and beam size of 21cm observations of more distant galaxies it is currently impossible to spatially resolve individual gas clouds in the halos of galaxies beyond the Local Group. As an alternative method, QSO absorption spectroscopy has turned out to be a powerful technique to trace neutral and ionized gas in the extended halos of galaxies at low and at high redshift. For this, absorption lines from low and high ionization metals, such as Mg ii and C iv in intervening absorbers, have been analysed extensively (Bergeron & Boissé (1991); Charlton & Churchill (1998); Steidel et al. (2002); Nestor et al. (2005); Kacprzak et al. (2010)). However, since most of the ion transitions of interest are located in the ultraviolet (UV), QSO absorption spectroscopy of gaseous structures in and around galaxies and in the intergalactic medium (IGM) at requires spectroscopic data from space-based UV observatories, such as the Hubble Space Telescope (HST) and the Far Ultraviolet Spectroscopic Explorer (FUSE). As a consequence, the amount and the quality (in terms of signal-to-noise, S/N) of absorption-line data of intervening metal absorbers rising in the halos of low-redshift galaxies is relatively limited.
Generally, QSO absorption-line measurements indicate that the circumgalactic environment of galaxies is characterized by a complex spatial distribution of multiphase gas that reflects both, the gas accretion processes of galaxies from the intergalactic medium and from merger events and the outflow of gaseous material from galactic winds (e.g., Fangano et al. (2007); Bouché et al. (2012)). Yet, the exact morphological relation between intervening metal absorbers and the Galactic HVC population has not really been established.
In this paper, we reanalyse HVC absorption lines from archival UV spectral data obtained with the Space Telescope Imaging Spectrograph (STIS) on HST and compare the absorption characteristics (absorption cross section, column-density distribution function) of several ions with that of intervening metal absorption systems at low redshift. We focus on the absorption properties of Si ii and Mg ii in HVCs and QSO absorbers, as these two ions have very similar ionization potentials and thus are particularly well suited for such a comparison. From this comparison we derive information on the relation between Galactic HVCs and QSO absorbers and provide an estimate for the cross section of neutral and ionized gas structures in the halos of galaxies (see also Richter (2012); Richter et al. (2011)).
Many of the HVC sightlines studied in this paper have been analysed in great detail by various different groups (e.g., Wakker et al. (1999); Sembach et al. (2001); Richter et al. (2001); Gibson et al. (2001); Tripp et al. (2003); Collins et al. (2003); Fox et al. (2004); Richter et al. (2009); Collins et al. (2009); Shull et al. (2009)) using HST/STIS data. These groups used various different spectral analysis techniques (apparent optical depth method, AOD; curve-of-growth; profile fitting) to derive column densities and Doppler-parameters from their data. In addition, some of these studies (but not all) have incorporated supplementary spectral data from lower-resolution instruments (e.g., from FUSE) and from 21cm studies of neutral hydrogen, but the strategies of how to use these supplementary data to derive column densities and other parameters are quite different among the above listed studies. As a result, there currently does not exist an homogeneous and coherent sample of HVC absorption-line parameters (column densities, Doppler parameters) for important ions obtained by multi-component Voigt profile fitting based on the same fitting criteria for all HVC sightlines. A coherent absorption-line sample is desired, however, to provide a meaningful comparison between Galactic HVC absorbers and intervening QSO absorbers. This motivated us to reanalyse HST/STIS data of Galactic HVCs using the profile-fitting technique for all HVC absorption features detected.
| Grating | Ion | |
|---|---|---|
| E140M | 45,800 | Si ii, Si iii, Si iv, O i, C ii, |
| C iv, Al ii | ||
| E230M | 30,000 | Fe ii, Mg ii |
2 Data aquisition and analysis method
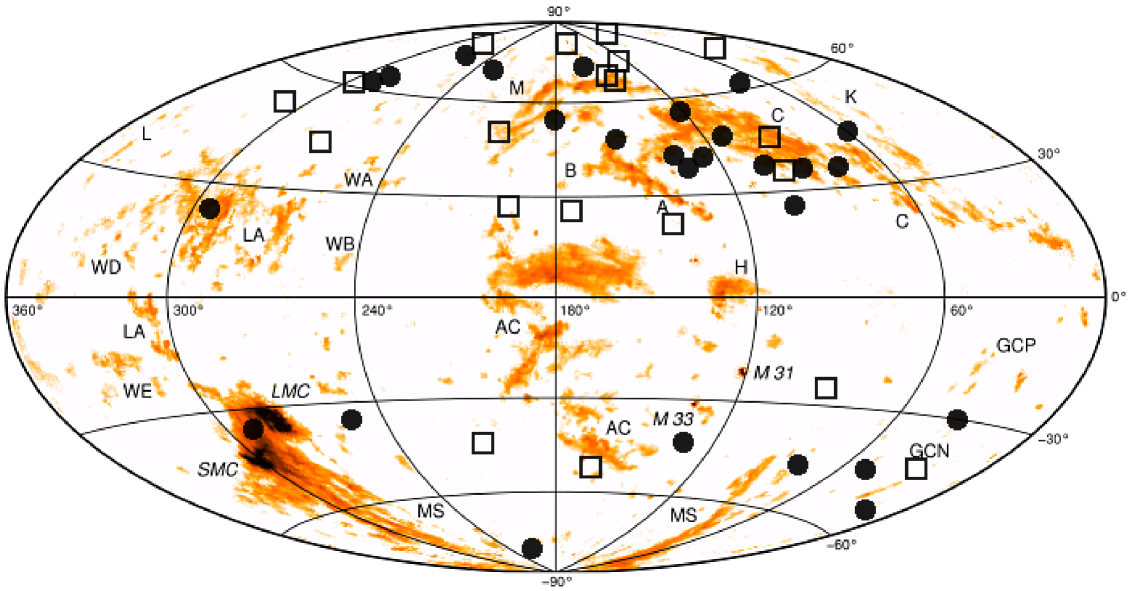
Our HST/STIS data set contains 47 sightlines through the Galactic halo towards QSOs and other AGNs. All spectra are publicly available in the Mikulski Archive for Space Telescope (MAST). Fig. 1 shows the sky distribution of the 47 sightlines plotted on a H i 21cm map of the Galactic HVCs from the Leiden/Argentine/Bonn (LAB) all-sky survey (Kalberla & Haud (2006)). From an inspection of the original observing proposals we conclude that more than 70 percent of the 47 selected AGN were selected because of their ultraviolet (UV) brightness and/or because of the known presence of intervening metal-absorption systems, as indicated by previous UV data from earlier HST spectrographs with lower spectral resolution. We therefore can assume that the 47 sightlines are not biased towards particular HVCs or HVC regions. Fig. 1 indicates, however, that there is a clear overabundance of QSO sightlines in the northern sky at deg with both detections and non-detections of high-velocity halo gas in the STIS data. This non-uniform sky distribution of the QSOs in our sample is further discussed in Sect. 3.
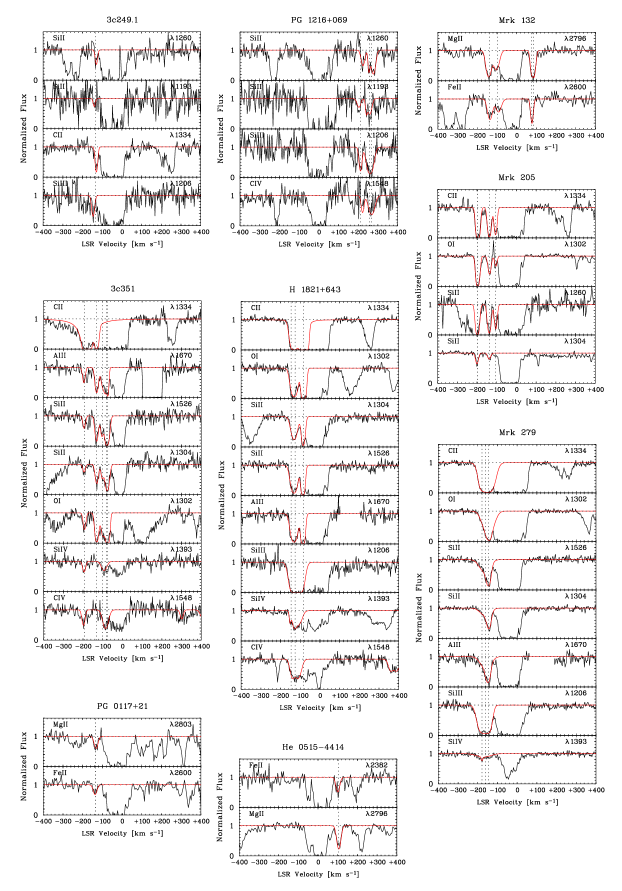
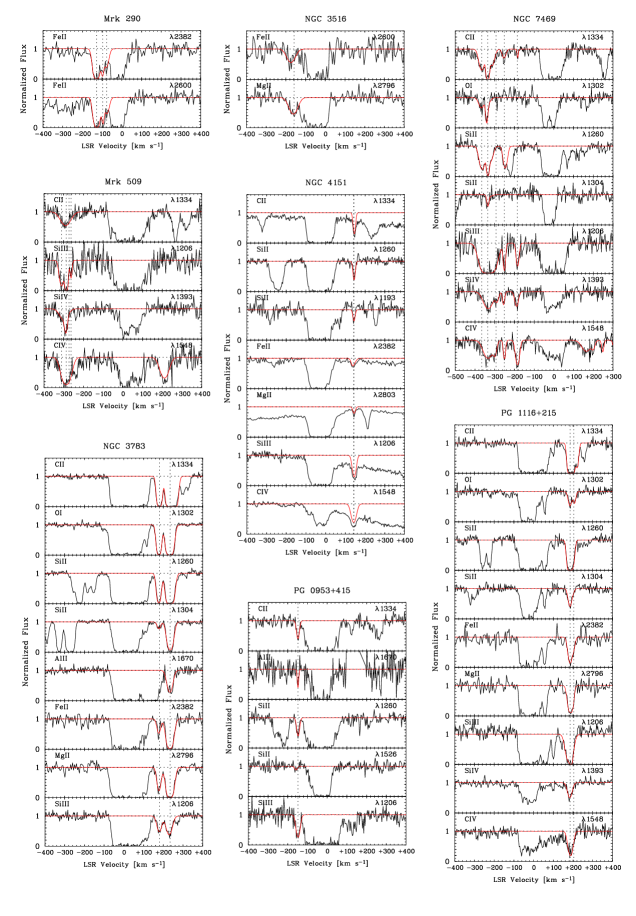
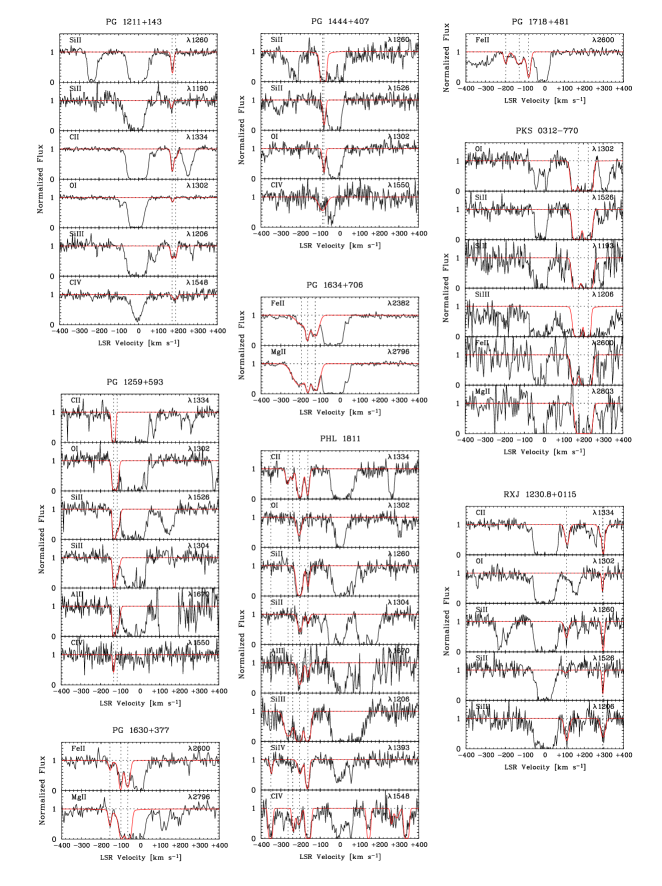
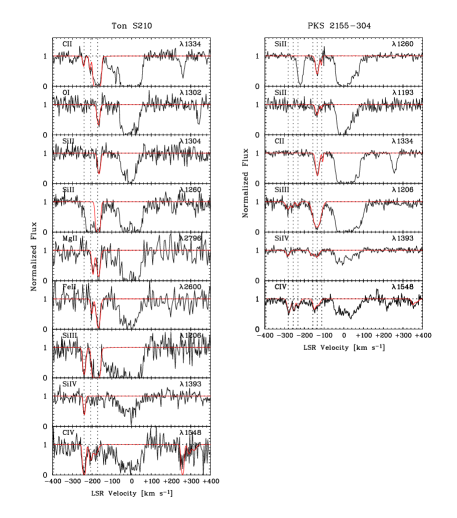
All STIS spectra considered in this paper were recorded using the E140M ( Å) and the E230M ( Å) high-resolution Echelle gratings of STIS. These instruments provide a spectral resolution of (E140M) and (E230M), corresponding to a velocity resolution of km s-1 and km s-1 FWHM, respectively. The STIS data were reduced using the standard STIS reduction pipeline (Brown (2002)). Separate exposures were combined following the procedures described by Narayanan et al. (2008). Table 1 lists prominent ions in the two wavelength ranges that can be used to study the absorption properties of Galactic HVCs. The ion transitions considered in this study include C ii , C iv , O i , Si ii , Si iii , Si iv , Mg ii , Fe ii , and Al ii . Laboratory wavelengths and oscillator strengths have been taken from the compilation of Morton (2003).
For our study we consider only HVCs, i.e., absorption features that have radial velocities km s-1, but not the IVCs. All in all, 28 out of the 47 sightlines observed with STIS exhibit significant HVC absorption features in at least one of the ions listed above. Table 2 provides a summary of the HVC detections in our STIS QSO sample. This overall detection rate is affected by the strongly varying S/N ratios in the spectra and the resulting differing detection limits for the individual ion lines (see also Sect. 3).
The HVC spectral features have been fitted by multi-component Voigt profiles, from which we obtain column densities and Doppler-parameters (-values) for the individual HVC absorption components. For the fitting process we have used the fitlyman routine implemented in the ESO-MIDAS software package (Fontana & Ballester (1995)). After an initial inspection of the velocity structure in each HVC we have simultaneously fitted all low ions (neutral species and singly-ionized species; e.g., O i, Si ii) in each velocity component with a single -value. This approach is justified, as the low ions are expected to reside in the same gas phase in HVCs where is dominated by turbulence (i.e., the thermal contribution to is expected to be negligible). The absorption components of intermediate ions (e.g., Si iii) and high ions (e.g., Si iv, C iv) were fitted independently of the low ions (leading to other -values for these ions), as these ions most likely trace a gas phase different from that traced by the low ions.
Because many spectra have relatively low S/N, not all HVC velocity components can be resolved with the current HST data set. Moreover, high-resolution, high-S/N optical spectra of HVC sightlines indicate that there often are a large number of velocity sub-components in HVCs whose identification would require a spectral resolution much higher than currently provided by space-based UV spectrographs (e.g.Welty et al. (1999)). This systematic uncertainty is, however, not restricted to HVCs but is relevant also for the analysis of intervening metal absorbers at low using UV data with limited S/N and spectral resolution (e.g., Richter et al. (2004); Ribaudo et al. (2011)). For the Voigt profile fitting presented in this paper our strategy was to find the minimum number of velocity components (Voigt components) that are required to obtain a satisfying fit to the STIS HVC absoption profiles. This allows us to compare our results to studies of intervening absorbers, for which similar fitting strategies were chosen (e.g. Churchill et al. (2003)).
All HVC fitting results are listed in Tables B.1B.5 of the Appendix.
| QSO Name | HVC status | HVC velocity range | HVC name | Relevant STIS grating | Detected ions | |||
|---|---|---|---|---|---|---|---|---|
| (deg) | (deg) | (yes/no) | (km s-1) | (if known) | ||||
| PKS 2155304 | 0.117 | 18 | 52 | yes | 138…190 | … | E140M | Si ii, C ii, Si iii, Si iv, C iv |
| NGC 5548 | 0.020 | 32 | 71 | no | - | - | E140M, E230M | - |
| B 21211757 | 0.110 | 33 | 42 | no | - | - | E140M | - |
| Mrk 509 | 0.034 | 36 | 30 | yes | 295…310 | GCN | E140M, E230M | C ii, Si iii, Si iv, C iv |
| CSO 873 | 1.010 | 38 | 84 | no | - | - | E230M | - |
| PHL 1811 | 0.192 | 47 | 45 | yes | 130…270 | GCN | E140M | Si ii, C ii, O i, Al ii, Si iii, Si iv, C iv |
| PG 1630+377 | 1.480 | 60 | 43 | yes | 160…60 | - | E230M | Mg ii, Fe ii |
| PG 1444+407 | 0.270 | 70 | 63 | yes | … | - | E140M | Si ii, C ii, O i, C iv |
| PG 1718+481 | 1.083 | 74 | 35 | yes | … | C Extension | E230M | Fe ii |
| NGC 7469 | 0.016 | 83 | 45 | yes | 190…400 | MS | E140M | Si ii, C ii, O i, Si iii, Si iv, C iv |
| 3c351 | 0.372 | 90 | 36 | yes | 130…230 | Complex C | E140M | Si ii, C ii, O i, Al ii, Si iii, Si iv, C iv |
| Mrk 290 | 0.030 | 91 | 48 | yes | 128 | Complex C | E230M | Fe ii |
| Akn 564 | 0.030 | 92 | 25 | no | - | - | E140M | - |
| H 1821+643 | 0.297 | 94 | 27 | yes | 130…170 | Outer Arm | E140M | Si ii, C ii, O i, Al ii, Si iii, Si iv, C iv |
| HS 1700+6416 | 2.740 | 94 | 36 | no | - | - | E140M | - |
| PG 1634+706 | 1.337 | 103 | 37 | yes | 100…215 | Complex C | E230M | Fe ii |
| Mrk 279 | 0.031 | 115 | 47 | yes | 150…200 | Complex C south | E140M | Si ii, C ii, O i, Al ii, Si iii, Si iv |
| PG 1259+593 | 0.472 | 121 | 58 | yes | 120…145 | Complex C III | E140M | Si ii, C ii, O i, Al ii, Si iii, C iv |
| PG 1248+401 | 1.030 | 123 | 77 | no | - | - | E230M | - |
| Mrk 205 | 0.071 | 125 | 42 | yes | 110…230 | Complex C south | E140M | Si ii, C ii, O i, Al ii |
| 3c249.1 | 0.310 | 130 | 39 | yes | - | E140M | Si ii, C ii, Si iii | |
| PG 0117+21 | 1.500 | 132 | 41 | yes | 134 | - | E230M | Mg ii, Fe ii |
| NGC 3516 | 0.009 | 133 | 42 | yes | 160…170 | - | E140M, E230M | Si ii, C ii, Fe ii, Mg ii, Si iii |
| PG 1206+459 | 1.160 | 145 | 70 | no | - | - | E230M | - |
| HS 0624+6907 | 0.370 | 146 | 23 | no | - | - | E140M | - |
| NGC 4051 | 0.002 | 149 | 70 | no | - | - | E140M | - |
| NGC 4151 | 0.003 | 155 | 75 | yes | 120…145 | … | E140M | Si ii, C ii, Si iii, C iv, Fe ii, Mg ii |
| Mrk 132 | 1.760 | 159 | 49 | yes | 140…80 | - | E230M | Mg ii, Fe ii |
| NGC 4395 | 0.001 | 162 | 82 | no | - | - | E140M, E 230M | - |
| PKS 0232-04 | 1.440 | 174 | 56 | no | - | - | E230M | - |
| HS 0747+4259 | 1.900 | 177 | 29 | no | - | - | E230M | - |
| PG 0953+415 | 0.239 | 180 | 52 | yes | Complex M | E140M | Si ii, C ii, Si iii, Al ii | |
| HS 0810+2554 | 1.510 | 197 | 29 | no | - | - | E230M | - |
| Ton 28 | 0.330 | 200 | 53 | no | - | - | E140M | - |
| PKS 0405123 | 0.570 | 205 | 42 | no | - | - | E140M | - |
| PG 1116+215 | 0.177 | 223 | 68 | yes | 180…190 | - | E140M, E230M | Si ii, C ii, O i, Fe ii, Mg ii, Si iii, Si iv, C iv |
| Ton S210 | 0.117 | 225 | 83 | yes | 150…235 | CHVC 224.083.4197 | E140M, E230M | Si ii, C ii, O i, Si iii, Si iv, C iv |
| HE 05154414 | 1.713 | 250 | 35 | yes | 120…230 | - | E230M | Mg ii, Fe ii |
| PG 1211+143 | 0.081 | 268 | 74 | yes | 169…184 | … | E140M | Si ii, C ii, O i, Si iii, C iv |
| PKS 1127145 | 1.187 | 275 | 44 | no | - | - | E230M | - |
| PG 1216+069 | 0.330 | 281 | 68 | yes | … | … | E140M | Si ii, Si iii, C iv |
| NGC 3783 | 0.010 | 287 | 23 | yes | 180…250 | Leading Arm (MS) | E140M, E230M | Si ii, C ii, O i, Al ii, Fe ii, Mg ii, Si iii |
| 3c273 | 0.160 | 290 | 64 | no | - | EPn | E140M | - |
| RXJ 1230.8+0115 | 0.117 | 291 | 63 | yes | 216…310 | … | E140M | Si ii, C ii, O i, Si iii, Si iv |
| PKS 0312770 | 0.223 | 293 | 38 | yes | 160…240 | MB | E140M, E230M | Si ii, C ii, O i, Fe ii, Mg ii, Si iii |
| PG 1241+176 | 1.280 | 293 | 80 | no | - | - | E230M | - |
| PKS 1302102 | 0.290 | 309 | 52 | no | - | … | E140M | - |
3 Results
3.1 Covering fractions of individual ions
The physical conditions in the gas, in particular the ionization conditions, are known to vary substantially among the Galactic HVC population. HVCs span a large range in temperatures and gas densities, they are subject to thermal instabilities, ram-pressure stripping, photoionization from the Galactic disc and from the extragalactic UV background, collisional ionization from hot material ejected by supernova explosions in the disc, gas mixing processes, and other related phenomena. As a result, the characteristic absorption patterns of HVCs (i.e, the observed absorption frequency of metal ions and their relative strengths) can be used to constrain the physical conditions in HVCs.
All in all, we fit 67 individual high-velocity absorption components (Voigt components; see above) in our data set. Of these, 47 components have velocity separations km s-1 from neighbouring HVC absorption components and thus can be regarded as individual entities, hereafter refered to as absorption systems.
An important parameter that characterizes the distribution of neutral and ionized HVC gas in the Milky Way halo is the covering fraction, , for each ion that is considered. As indicated in Table 3, we define the covering fraction as the number of sightlines that exhibit significant HVC absorption in the ion divided by the total number of sightlines along which HVC absorption above the limiting column density threshold (log ) could be detected. The column density threshold for each ion was calculated from the relevant ion transitions in the STIS wavelength range (see Sect. 2) together with the local S/N ratio.
Table 3 shows the values of for the ions O i, C ii, Si ii, Mg ii, Fe ii, Si iii, Si iv, and C iv, together with the limiting column densities, log , as determined from our line-fitting analysis. In this way we obtain covering fractions for the above-listed ions between (Si iv) and (C ii, Si iii). Assuming that the sightlines and the HVCs are randomly distributed over the sky with , and considering Poisson-like statistics, the total sky covering fraction of HVC absorption in our data is . This HVC covering fraction is in excellent agreement with the value of derived by Lehner et al. (2012), based on a much larger combined COS/STIS data set. The good agreement with the Lehner et al. results indicates that the non-uniform sky distribution of the QSOs (as mentioned in Sect. 2) has no significant influence on the determination of the HVC covering fraction from our STIS QSO sample.
Note that we do not consider absorption by Al ii in our statistical analysis, because for the Al ii line (the only detectable Al ii line in our data) there is a gap between km s km s-1 at the red end of the Echelle grating. To compare the covering fractions of the individual ions with each other, and to relate them to H i sky-covering fractions determined from 21cm all-sky surveys, one needs to consider the relative abundances of the elements (C, O, Si, Mg, and Fe) in HVCs. The ionization conditions and dust-depletion properties of the absorbing gas can also affect the interpretation of the covering fractions. These factors will be considered in the subsequent sections.
| Ion | log | ||
|---|---|---|---|
| C ii | 13.20 | ||
| C iv | 13.00 | ||
| O i | 13.65 | ||
| Si ii | 12.25 | ||
| Si iii | 12.15 | ||
| Si iv | 12.90 | ||
| Mg ii | 12.70 | ||
| Fe ii | 12.90 |
Number of HVC detections above column-density
threshold/total number of sightlines;
covering fraction;
minimum column density threshold considered.
3.2 Si ii absorption
In our statistical analysis, we focus on Si ii absorption in HVCs. The STIS E140M data contain five Si ii transitions (at , , , , and ) that span a large range in oscillator strengths ( for Si ii and for Si ii ; Morton (2003)). Our simultaneous fitting of these lines therefore provides particularly reliable values for (Si ii) and (Si ii) in both strong and weak HVC absorption components. The ionization potential of Si ii ( eV) is very similar to that of Mg ii ( eV), suggesting that both ions trace the same gas phase in HVCs. In addition, the cosmic abundances of Si and Mg are almost identical (log (Si/H and log (Mg/H, assuming solar relative abundances from Asplund et al. (2005)). Because Mg ii is the most commonly used ion to study circumgalactic gas at low and intermediate redshift in optical quasar spectra (e.g., Kacprzak et al. (2008); Bouché et al. (2012)), the absorption properties of Si ii and Mg ii in HVCs can be directly compared to the statisitical properties of intervening Mg ii absorbers at low redshift (see Sect. 4.4).
The covering fraction for HVC Si ii absorption in the halo is (Si ii for log (Si ii (see previous section; Table 3). For comparison, the filling factor of H i in HVCs derived from 21cm surveys is (H i for log (H i and (H i for log (H i (Wakker (2004). The higher detection rate of Si ii absorption compared to H i emission suggests that more than half () of the high-velocity Si ii absorbers trace neutral and ionized gas in the halo below the typical detection limit of current 21cm observations at log (H i.
HVCs that are detected in metal absorption without having an H i 21cm counterpart commonly are referred to as “low-column density HVCs” (LCDHVCs; Richter et al. (2009)).
3.2.1 Radial velocities
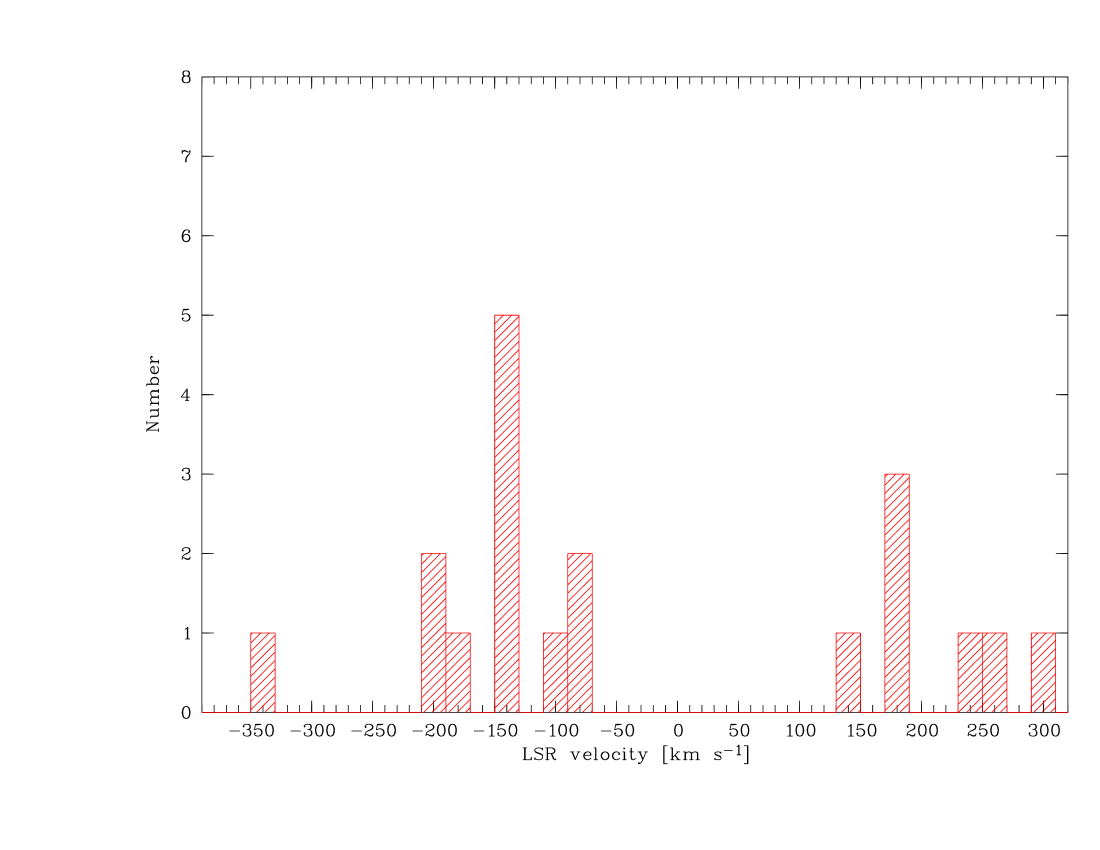
In Fig. 2 we show the distribution of LSR velocities of the 19 HVCs for which Si ii absorption was detected and accurately measured (only high-velocity Si ii absorption towards NGC 3516 is not considered here because of the low data quality). Absolute values for range between and km s-1. The highest velocity absorber is found towards NGC 7469 and is related to the Magellanic Stream (Table 2). Note that the region between to km s-1 (i.e., the IVC velocity regime) is not considered in this study.
Out of these 19 sightlines, 12 (63 percent) show absorption at negative velocities. One may argue that large HVC complexes at negative velocities (such as Complex C) together with the limited sample size leads to an observational bias towards negative velocities. However, optical observations of Ca ii absorption in HVCs, based on a ten-times larger data sample of randomly distributed QSO sightlines, also indicate that the majority of the neutral HVC absorbers exhibit negative radial velocities (Ben Bekhti et al. (2008), Ben Bekhti et al. (2012)). This velocity distribution suggests a net infall of high-velocity neutral and weakly ionized gas towards the Milky Way disc. High ions such as O vi, in contrast, show an equal distribution of positive and negative velocities in the Galactic halo (Sembach et al. (2003)), supporting the idea that they trace both infalling and outflowing gas that is highly ionized.
3.2.2 Column densities
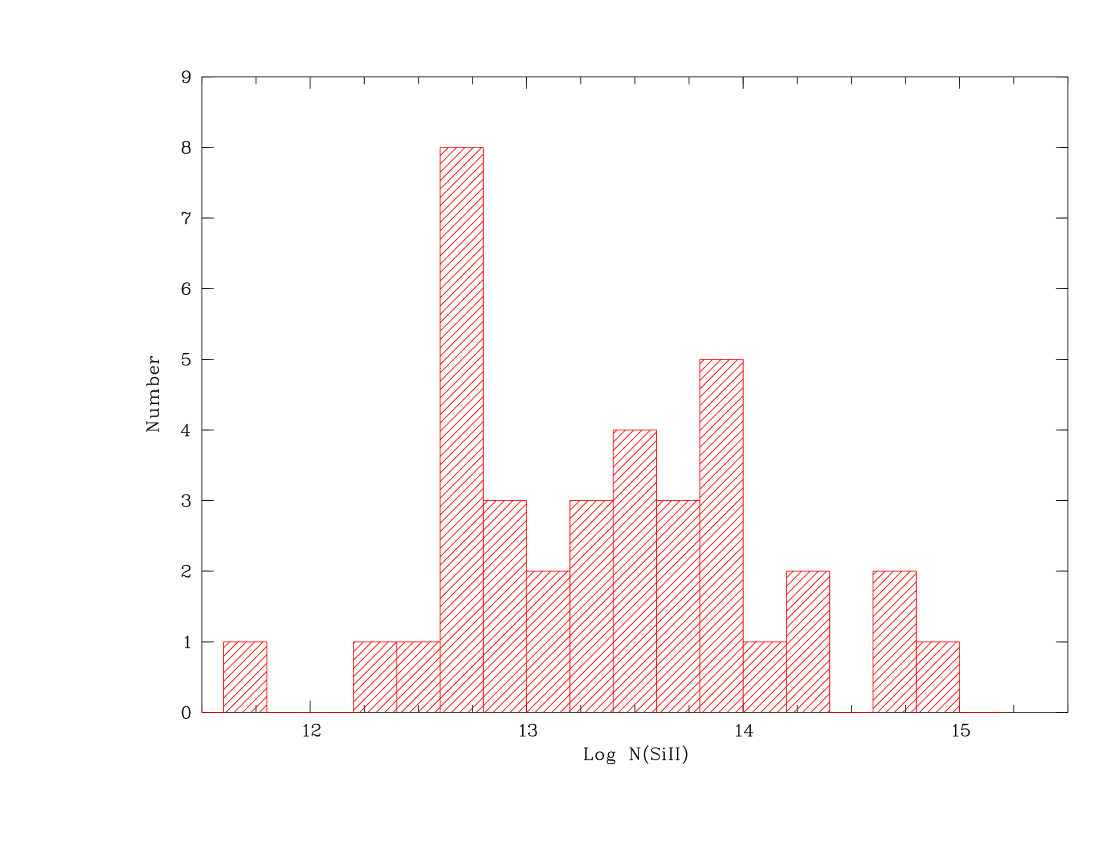
From our line-fitting analysis we find that the 19 HVCs that are detected and accurately measured in Si ii absorption are composed of 38 individual absorption components. For these components we obtain typical Si ii column densities in the range log (Si ii (see Tables B.1B.5). A histogram showing the distribution of the Si ii column densities is presented in Fig. 3. The median logarithmic column density is log (Si ii.
Fig. 3 indicates a widespread, inhomogeneous distribution of the Si ii column densities in HVC absorption components with a prominent peak near log (Si ii and another maximum near log (Si ii. Most ( or percent) of the HVC absorption components have log (Si ii.
Tables B.1B.5 show that only some of the Si ii absorption components with log (Si ii represent satellite components of stronger HVC absorbers. There exist a distinct population of isolated, weak HVC absorbers with relatively low column densities of Si ii and other low ions (e.g., towards PG 1211143, PKS 2155304, NGC 4151). These absorbers belong to the class of highly-ionized high-velocity clouds (e.g., Sembach et al. (1999), Sembach et al. (2003)) and to the low-column-density HVCs (Richter et al. (2009)). This suggests that the inhomogeneous distribution in Fig. 3 reflects the actual physical properties of neutral and weakly-ionized gas structures in the Galactic halo, and is not an artifact from our analysis.
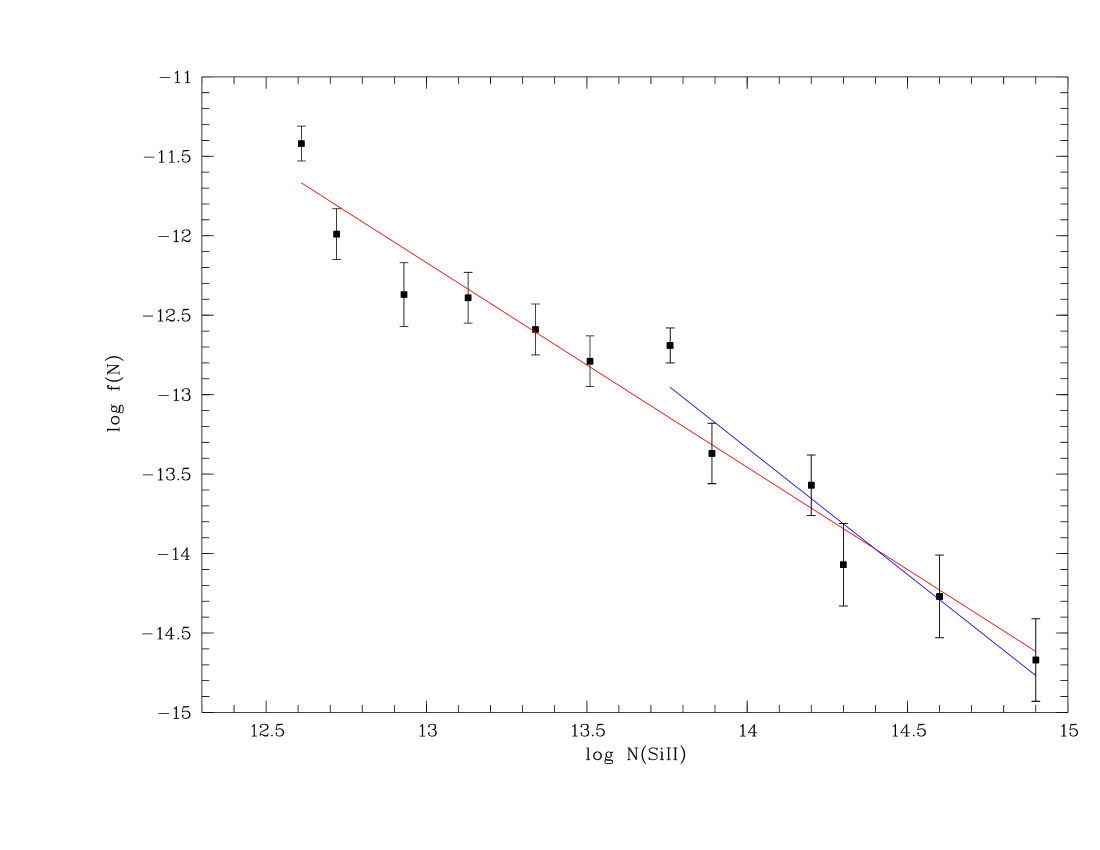
Based on the Si ii column densities shown in Fig. 3 we have constructed a column-density distribution function (CDDF) of HVC Si ii absorption components (Fig. 4). The CDDF can be defined as , where is the number of absorbers in the column-density bin . The CDDF is usually approximated by a power law in the form , where for H i in HVCs, as derived from 21cm observations (e.g., Lockman et al. (2002)). As can be seen in Fig. 4, the CDDF of Si ii HVC absorption components deviates from a simple power law, showing instead a plateau at log (Si ii. The shape of the CDDF thus reflects the inhomogeneous distribution of Si ii column densities in HVC absorption components shown in Fig. 3. If we force a power-law fit with a single slope to the Si ii CDDF for column densities log (Si ii, we obtain and log (Fig. 4, red solid line). This slope is somewhat shallower than the canonical value of derived from H i 21cm observations of Galactic HVCs (e.g., Lockman et al. (2002)). If we instead restrict our fit to the range log (Si ii, we obtain much steeper slope of and log (Fig. 4, blue solid line). This slope fits better to the slope derived for H i, but is substantially smaller than the slope derived for optical Ca ii absorption in IVCs and HVCs (; Ben Bekhti et al. (2008), Ben Bekhti et al. (2012)). The steeper slope of Ca ii compared to Si ii most likely is a result of the strong depletion of Ca into dust grains, because high-column density clouds tend to have higher depletion values than low-column density clouds (see also discussion in Ben Bekhti et al. (2012)). Note that if some of the HVC absorption components would be composed of several, unresolved velocity components, the slope of the CDDF would be steeper, too.
3.2.3 Doppler parameters
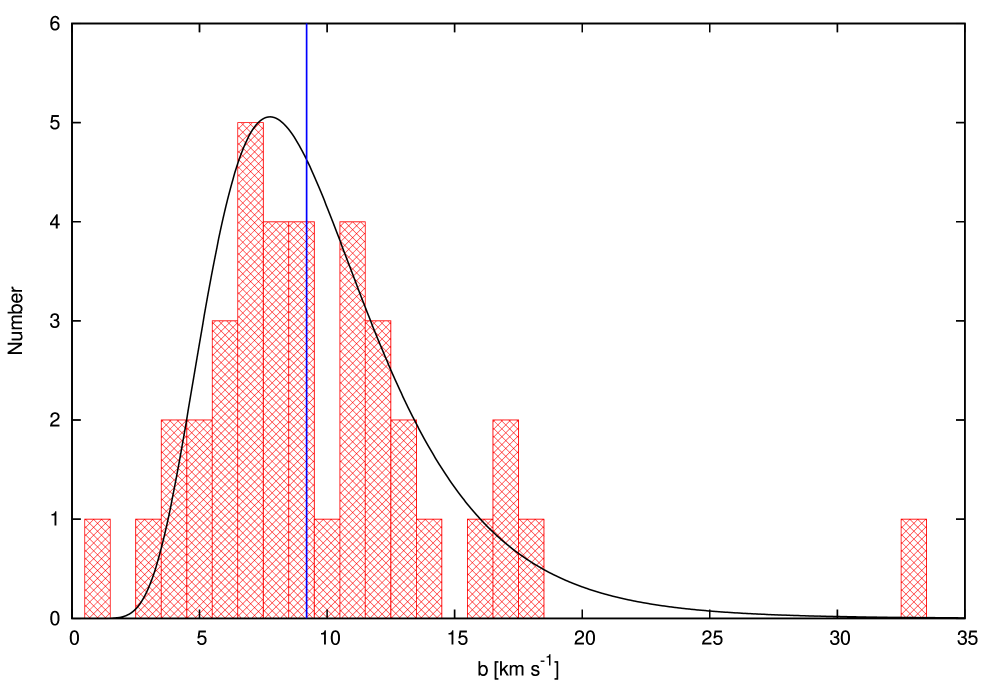
In Fig. 5 we show the distribution of Si ii Doppler parameters (-values) in HVCs, based on the Voigt-profile fitting of the 38 Si ii absorption components. The measured -values range from to km s-1 with a median value of km s-1. The distribution can be fitted by a log-normal function (solid line in Fig. 5), which peaks at km s-1. The median value is km s-1. Note that Si ii -values that are smaller than the instrumental resolution in the E140M grating ( km s-1) can be reliably determined since we are fitting simultaneously several Si ii lines with different oscillator strengths (i.e., the corresponding curve-of-growth is well-defined).
It is commonly assumed that the Doppler parameter of an absorber is composed of a thermal component () and a non-thermal component (), so that . The thermal component depends on the temperature of the gas, , and the atomic weight () of the absorbing ion: [K] km s-1. The non-thermal component may include turbulent motions in the gas and unresolved velocity structure in the lines.
Since Si is a relatively heavy element (), it is expected that for neutral and partly ionized HVCs gas with K (e.g., Ben Bekhti et al. (2012); their Fig. 15) the thermal contribution to (Si ii is km s-1. This implies that the observed line widths of most of the Si ii HVC absorption features are subject to broadening mechanisms other than thermal broadening, such as macroscopic turbulence and gas flows. Moreover, it is very likely that many of the Si ii absorption components seen in the STIS data are composed of smaller (unresolved) substructures. In fact, optical absorption-line studies of IVCs and HVCs at very high spectral resolution and high S/N clearly indicate that there exists substantial velocity-structure in neutral halo clouds at a level of a few km s-1 (see, e.g., the IVC and HVC in the direction of the Magellanic Clouds; Welty et al. (1999)).
3.2.4 Sub-component structure
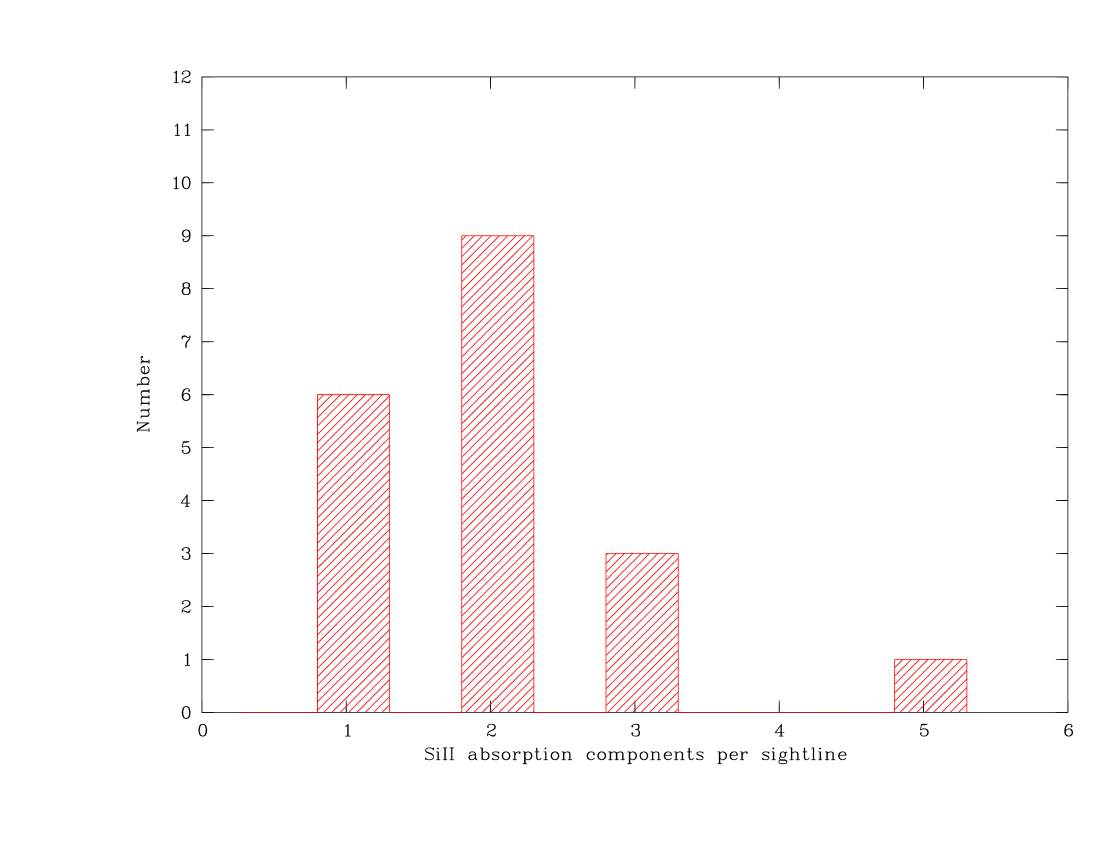
While the smallest substructures in the HVC absorbers obviously are not resolved in the STIS data, most of the detected Si ii absorption features do show several individual velocity subcomponents that are separated from each other by km s-1, typically, and that we have fitted as individual absorption components. Since for intervening QSO absorbers the velocity spread of the detected absorption feature often is used as an observational parameter to constrain the characteristic environment of the absorber host (e.g., Charlton & Churchill (1998)), it is interesting to study the velocity structure of Galactic HVCs and compare it to the absorption properties of intervening systems, in particular weak and strong Mg ii absorbers.
In Fig. 6 we show the number distribution of Si ii absorption components per HVC for all spectra in which HVC gas is detected in Si ii. About 80 percent of the measured HVCs have one or two velocity components that can be resolved with the STIS data (one component: 32 percent; two components: 47 percent). For comparison, Ben Bekhti et al. (2012) find for optical Ca ii absorption in IVCs and HVCs that more than 70 percent of the Ca ii absorbers are seen as single-component systems, while the fraction of two-component absorbers is less than 20 percent. This difference is not surprising, however, since Ca ii in IVCs and HVCs is expected to trace relatively confined neutral gas regions in the halo clouds, whereas Si ii traces both neutral and weakly ionized gas regions (i.e., multi-phase gas regions) that are spatially more extended.
On a first look, the distribution of absorption components in HVCs appears to be very similar to the distribution found for strong intervening Mg ii absorbers (Prochter et al. (2006); one component: percent; two components: percent). However, because intervening Mg ii absorbers trace gas in discs and halos of galaxies (and thus often are fully saturated over a large velocity range) and because the spectral resolution of the Mg ii SDSS data used by Prochter et al. (2006) is very low (), this similarity does not provide any clues to the connection between strong Mg ii systems and HVCs. Using high-resolution optical spectra, Churchill et al. (2003) indeed find a much larger number of absorption components per absorption systems for strong Mg ii absorbers with H i column densities below that expected for neutral gas discs, but similar to those in Galactic HVCs.
Even if one considers the longer absorption path length through a galaxy halo from an exterior vantage point (Churchill et al. study) compared to the path length through the Milky Way halo from the position of the Sun (our study), the four-times higher number of absorption components per system clearly indicates that the majority of the strong Mg ii absorbers with log (H i studied by Churchill et al. (2003) trace gaseous structures in halos the are kinematically more complex than the Galactic HVC population. As we will see later, this scenario is supported by the very large absorption cross section of strong Mg ii absorbers that are both more common and spatially more extended (Sect. 4).
3.3 Remarks on other ions
3.3.1 O i
O i is an excellent tracer of H i, because both atoms have the same ionization potential and they are coupled by a strong charge-exchange reaction. There is only one (strong) transition of O i available in the STIS E140M wavelength range (at Å). Thus, (O i) can be determined from the STIS data alone, only under the assumption that (O i(Si ii).
There are several studies on HVCs that have combined STIS E140M data with FUV data from FUSE (e.g., Richter et al. (2001); Sembach et al. (2004b)) to make use of several other (weaker) O i transitions at Å. However, only for a few lines of sight in our sample there are FUSE data of sufficient quality to determine (O i) at an accuracy similar to that of (Si ii); in this study, we therefore do not consider any available FUSE data.
The covering fraction of HVC O i absorption ((O i) is smaller than that of Si ii, but the column-density limit above which (O i) is considered is 1.4 dex higher than that of Si ii (Table 3). The relative solar abundance of O compared to Si is log (O/Si) (Asplund et al. (2005)), so that for an HVC with solar relative abundances of O and Si (and with 100 percent of these elements in the gas phase) our STIS data are slightly ( dex) more sensitive for Si ii absorption in HVCs than for absorption by O i. On the one hand, the Si ii column density in HVCs may be reduced by the depletion of Si into dust grains (e.g., Richter et al. (2001); Richter & de Boer (2004)); on the other hand, Si ii traces neutral and weakly-ionized gas, so that Si ii/O i may be higher than (O/Si)☉. Consequently, these effects (dust depletion and ionization) are opposite and may even cancel each other out. To estimate whether or not this is the case in an HVC one would need to know the local dust properties and ionization conditions in the gas, which are difficult to determine.
The five sightlines, along which high-velocity Si ii is detected without associated O i absorption (see Table 2), exhibit relatively weak HVC absorption in Si ii, suggesting that for some of these clouds O i may be just below the detection limit (see also Richter et al. (2009)).
3.3.2 C ii
With an ionization potential of eV singly-ionized carbon traces neutral and mildly ionized gas in HVCs. The only available C ii transition in the STIS E140M wavelength range is located at Å. To derive (C ii) from the (mostly fully saturated) line one needs to assume that (C ii) is similar to the Doppler parameter derived for Si ii (or other low or intermediate ions). However, in view of the higher ionization potential of C ii compared to Si ii, C ii absorption may arise in a somewhat different (possibly more extended) gas phase, so that this assumption may be invalid for most of the HVC absorbers. As a consequence, the C ii column densities derived for our HVC sample are possibly afflicted with large systematic uncertainties that we cannot account for.
From our data we derive a covering fraction of (C ii; Table 3), which is insignificantly higher than that of Si ii. The column density threshold is log , which is dex higher than that of Si ii (see Table 3). This difference compensates the expected abundance difference between these two elements, if solar relative abundances are assumed (log (C/Si)). Therefore, the C ii and Si ii transitions in the STIS data provide roughly the same sensitivity to neutral and weakly ionized gas in HVCs.
3.3.3 Mg ii
The Mg ii doublet near 2800 Å is observed only with the STIS E230M grating, so that there are only 19 sightlines along which high-velocity Mg ii can be studied in our data sample at intermediate spectral resolution (FWHM km s-1).
As mentioned above, Mg ii and Si ii are expected to trace a similar gas phase in HVCs and both ions are expected to have very similar column densities. The Mg ii filling factor in HVCs is (Mg ii (Table 3), which is somewhat lower than that of Si ii. This is not surprising, however, since the Mg ii column density threshold (log ) is dex higher than that of Si ii. In Sect. 4 we will combine the E230M data for Mg ii and the E140M data for Si ii to compare the absorption statistics of HVCs with that of intervening Mg ii absorbers.
3.3.4 Fe ii
The ionization potential of Fe ii ( eV) is very similar to that of Si ii and Mg ii, so these three ions are expected to arise in the same gas phase (neutral and weakly ionized gas). In the E230M wavelength band there are several Fe ii transitions available including the two relatively strong transitions at and Å. Also the E140M band contains a number of (weaker) Fe ii transitions.
The covering fraction of HVC Fe ii absorption is (Fe ii (for log ), thus very similar to that of Mg ii (see above). This is expected, since the threshold column density is dex higher than for Mg ii, while the solar abundance of Fe is dex lower (log (Fe/H; Asplund et al. (2005)). In summary, both ions are equally sensitive to trace predominantly neutral and weakly-ionized gas in HVCs. There are two sightlines that show Fe ii absorption at high velocities, while these two sightlines are not covered in Mg ii (Table 3).
3.3.5 Si iii
Si iii has one very strong transition at Å; with an ionization potential of eV this ion traces diffuse ionized gas in HVCs and their (more or less) extended gaseous envelopes. As for C ii and O i the determination of a reliable column density for Si iii is basically impossible, as the Si iii line is often heavily saturated and the assumption that (Si iii(Si ii) may be invalid for most cases.
We find (Si iii, which is identical to the value derived for C ii (i.e., all HVCs that are reliably detected in Si iii in our sample are also detected in C ii). The column density threshold considered for this estimate is log (Si iii (compared to log (C ii; see above). Since (C/Si) (Asplund et al. (2005)) it follows that Si iii and C ii trace the same physical regions in HVCs at roughly the same sensitivity. The covering fraction of (Si iii) is lower than that derived by Collins et al. (2009; for log (Si iii) based on the same STIS data. The reason for this discrepancy is that these authors also include very weak (and also spurious) absorption features in their statistics that we do not consider as secure HVC Si iii detections. In addition, for our analysis we take into account only those HVC components that are (in velocity space) well separated from lower-velocity material (i.e., IVCs). Our value of (Si iii) is, however, in excellent agreement with the covering fraction of of UV-selected HVCs based on a much larger STIS/COS data sample recently presented by Lehner et al. (2012).
3.3.6 C iv and Si iv
The high ions C iv and Si iv are known to trace a gas phase in HVCs that is different from that traced by low ions such as O i, C ii, Si ii, Mg ii, and Fe ii. High-velocity C iv and Si iv absorption sometimes is associated with common 21cm HVCs (e.g., Fox et al. (2009)), or with low-column density HVCs (Richter et al. (2009)), where it is thought to arise in the interface regions between neutral HVC gas and the hot coronal gas. In addition, there exists a population of highly-ionized HVCs (e.g., Sembach et al. (1999); Sembach et al. (2003)) that probably represent low-density, gas structures in the halo and that most likely are photoionized. These structures may arise in diffuse gaseous material that originates in the IGM and that is being accreted by the Milky Way (“warm accretion”), or that results from the break-up of more massive HVCs as they interact with the coronal gas in the halo (one prominent example is the HVC Complex GCN, which is detected in C iv and Si iv towards PKS 2155304 and Mrk 509 ; see Winkel et al. (2011)).
As covering fractions we derive (C iv for log (C iv and (Si iv for log (Si iv. These covering fractions are smaller than the one derived for O vi in the Milky Way halo ((O vi); Sembach et al. (2003)), implying that O vi is more sensitive for detecting highly-ionized halo gas and/or the O vi absorbing gas phase is spatially more extended than the C iv and Si iv absorbing phase.
4 HVCs as intervening metal-line absorbers
Deep H i 21cm observations of M31 and other nearby spiral galaxies (e.g., NGC 891) clearly show that the HVC phenomenon is not restricted to the Milky Way, but represents an ubiquitous component of spiral galaxies in the local Universe. It indicates the various gas-circulation processes in the inner and outer halos of star-forming galaxies (Thilker et al. (2004); Oosterloo et al. (2007); Fraternali et al. (2007); Richter (2012)). Our results on the covering fraction of the different ions in the Milky Way HVCs, together with statistics of intervening metal-line absorbers in QSO spectra, now can be used to investigate the absorption-cross section of HVC analogues in the local Universe and to provide an estimate of the contribution of HVCs to the number density of intervening metal absorbers at low redshift.
In the following, we will first briefly discuss the general relation between the number density of intervening metal absorbers and the absorption-cross section of galaxies and their halos. As a second step, we will then combine the observed sky covering fractions of Si ii and Mg ii in the Milky Way HVCs with statistics on intervening Mg ii absorbers to study the the spatial distribution of neutral and weakly ionized gas in the halos of Milky Way-type galaxies (see also Richter et al. (2011); Richter (2012)).
4.1 Absorption-cross section of galaxies and their halos
Let us define as the absorber number density of QSO metal-line aborbers per unit redshift measured for a given ion , as the space density of galaxies at , as the (mean) galaxy halo radius (within which metal absorption takes place), and as the mean covering fraction of the ion in the disc/halo gas for radii . Number density and geometric cross section of the gas in and around galaxies are directly related to each other (e.g., Kacprzak et al. (2008)), so that for
| (1) |
The space density of galaxies can also be expressed as , where is the number density of galaxies. is the incomplete Gamma function in which , where is the slope at the faint end of the Schechter galaxy luminosity function. The parameter is defined as , where is the minimum luminosity of galaxies contributing to the population of absorbing gas halos. Therefore, if is known for a given luminosity range and and are measured for a given ion, equation (1) allows us to estimate the characteristic size () of the absorbing region around galaxies. For a more detailed discussion of these parameters see Richter (2012).
4.2 Covering fraction of strong Mg ii absorption in the Milky Way halo
For the study of the physical properties and absorption cross section of gas in and around galaxies at low and high redshift via QSO absorption-line spectroscopy the Mg ii ion plays a crucial role. The so-called strong Mg ii systems are intervening metal-absorption systems that have Mg ii equivalent widths Å; they usually are associated with luminous galaxies () at impact parameters kpc (e.g., Bergeron & Boissé (1991); Steidel et al. (2002); Kacprzak et al. (2010)). These absorbers are expected to trace neutral and ionized gas in the discs of galaxies and their gaeous halos (including HVCs). The so-called weak Mg ii systems have Å; they appear to be less tightly associated with galaxies and are typically found at larger distances from luminous galaxies, in the range kpc (Milutinović et al. (2006); Rigby et al. (2002)).
From the LCDHVC survey by Richter et al. (2009) and from this study it is expected that only the most massive HVCs (HVCs with neutral column densities log (H i) display the absorption charcterisitics of strong Mg ii absorbers, while there exists a population of HVCs with H i column densities log (H i that would appear as weak Mg ii absorbers if seen as QSO absorption-line system. The high-velocity absorbers towards Ton S210 and NGC 4151 represent examples for this class of low-column density HVCs. Note that by definition all HVCs that have Å would be classified as strong Mg ii systems if seen as QSO absorbers from far away. However, since all HVCs in the Milky Way halo have log (H i one would expect that HVC analogues in the halos of Milky Way-type galaxies contribute to the population of strong Mg ii absorbers predominantly in the range Å Å while the strongest of the intervening Mg ii absorbers with Å are related to discs, disc-halo interfaces, and galactic winds (e.g., Bouché et al. (2012)). In the usual QSO absorber classification scheme, HVCs would appear as sub-damped Lyman systems (sub-DLAs) and Lyman-limit systems (LLS; see Richter (2012)).
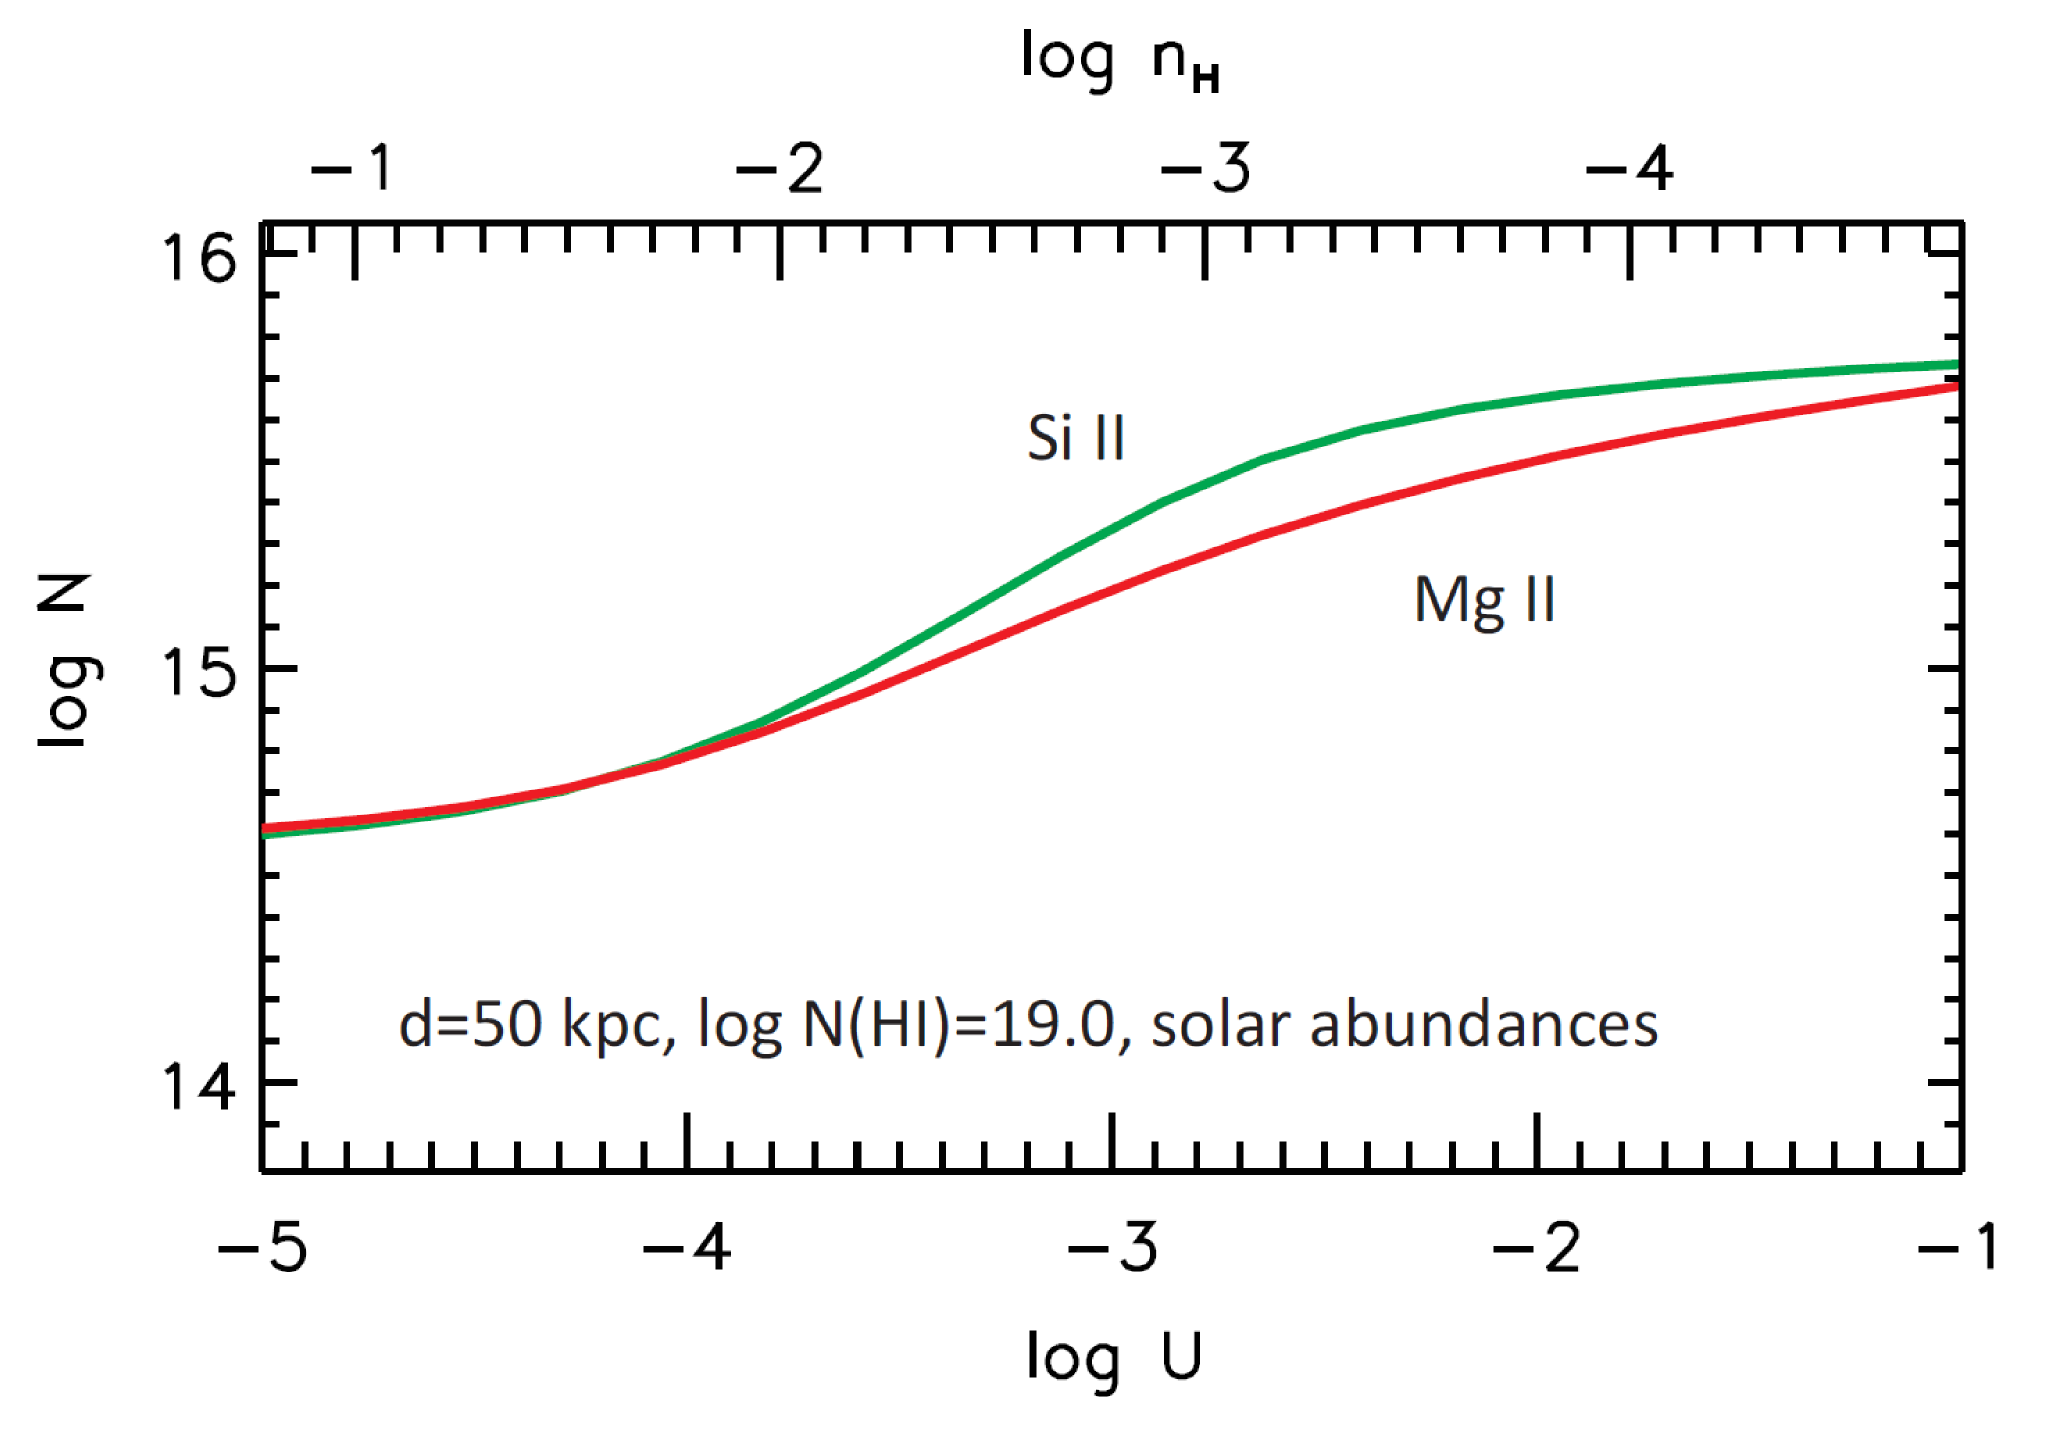
In Table 4, sixth row, we show the measured Mg ii equivalent widths for the eleven (out of 19 possible) HVCs in which Mg ii absorption has been detected. Strong Mg ii absorption with Å is measured for six HVCs, suggesting that the covering fraction of HVCs with strong Mg ii absorption is . Because of the limited statistical relevance of this result, we also consider Si ii as a proxy for Mg ii. As mentioned earlier, Si ii and Mg ii have very similar ionization potentials and solar abundances, so that it is expected that both ions trace the same gas phase in HVCs and they have very similar column densites. To demonstrate the expected similarity of the Si ii and Mg ii column densities in HVCs we show in Fig. 7 an example of a CLOUDY photoionization model of a Galactic HVC with an H i column density of cm-2, a distance to the Galactic disc of 50 kpc, and with solar abundances of Si and Mg (model from Richter et al. (2009)). In this figure, (Si ii) and (Mg ii) are plotted against the ionization parameter () and the gas density (). Over a large range of densities and ionization parameters the expected column densities of Si ii and Mg ii lie within 0.2 dex of each other, demonstrating that these two ions indeed trace the same gas phase in HVCs with almost identical column densities.
To transform the measured Si ii equivalent widths along the 19 suited E140M sightlines into Mg ii equivalent widths, we consider Si ii , which is the strongest Si ii transition covered by our STIS data (Table 4, fifth row). From atomic data it follows that ( (Morton (2003)).
For a typical HVC Doppler parameter range of km s-1 with one or two absorption components and under the above discussed assumption that (Si ii(Mg ii) an equivalent width of 300 mÅ in the Mg ii line corresponds to an equivalent width of mÅ in the Si ii line (see also Narayanan et al. (2008)). We here use the lower threshold of mÅ to separate strong and weak Mg ii absorbers in HVCs in an indirect manner. The observed HVC Si ii/Mg ii absorption strengths towards PG 1116+215 and Ton S210 are in excellent agreement with this conversion scheme (see Table 4).
Based on this method, we find that 12 of the 20 Si ii HVC absorbers listed in Table 4 represent strong Mg ii systems. Combining this result with our direct Mg ii measurements outlined above we have 6 relevant Mg ii plus 8 relevant Si ii detections along 41 independent sightlines, so that the total covering fraction of strong Mg ii absorption in Galactic HVCs is estimated as . This covering fraction for strong Mg ii absorption is identical to the observed covering fraction of H i in HVCs with log (H i, based on 21cm HVC surveys (see Wakker (2004)), and references therein). It is also very similar to the covering fraction of Ca ii absorption in HVCs with log (Ca ii, as derived from a large sample of optical QSO spectra (Ben Bekhti et al. (2008), Ben Bekhti et al. (2012)). Ca ii traces predominantly neutral gas in HVCs with H i column densities log (H i (Richter et al. (2011); Ben Bekhti et al. (2012)). Therefore, the similar absorption cross sections imply that Ca ii and strong Mg ii trace the same type of halo clouds, namely massive HVCs that are optically thick in H i; only these clouds would be seen as strong Mg ii absorbers if the Milky Way halo would be observed as a QSO absorption-line system from an exterior vantage point.
| Sightline | HVC velocity range | S/N | S/N | EWSiII,1260 | EWMgII,2796 |
| (km s-1) | [mÅ] | [mÅ] | |||
| PG 1211+143 | 169…184 | 15 | … | 464 | … |
| PKS 2155+304 | 138…190 | 20 | … | 593 | … |
| Mrk 279 | 159…200 | 23 | … | 2523 | … |
| PG 1116+215 | 180…190 | 12 | 6 | 1846 | 34134 |
| NGC 3783 | 180…250 | 26 | 10 | 3564 | 66828 |
| NGC 4151 | 120…145 | 18 | 30 | 445 | 433 |
| PKS 0312770 | 160…240 | 7 | 3 | 50713 | 119190 |
| HE 05154414 | 120…230 | … | 11 | … | 17315 |
| PG 1634+706 | 100…215 | … | 25 | … | 102812 |
| NGC 3516 | 160…170 | 3 | 7 | 20325 | |
| Mrk 205 | 110…230 | 5 | … | 25318 | … |
| PHL 1811 | 130…270 | 7 | … | 22411 | … |
| PG 0953+415 | 150 | 8 | … | 426 | … |
| RXJ 1230.8+0115 | 216…310 | 6 | … | 10410 | … |
| PG 1259+593 | 120…145 | 7 | … | 1107 | … |
| Ton S210 | 150…235 | 6 | 4 | 14810 | 3056 |
| 3c351 | 130…230 | 5 | … | 38917 | … |
| H 1821+643 | 130…170 | 12 | … | 2736 | … |
| NGC 7469 | 190…400 | 10 | … | 2368 | … |
| Mrk 132 | 140…80 | … | 10 | … | 25116 |
| PG 0117+21 | 134 | … | 6 | … | 8321 |
| PG 1630+377 | 160…60 | … | 8 | … | 65330 |
| PG 1216+069 | 210…270 | 8 | … | 16811 | … |
| PG 1444+407 | 80…90 | 8 | … | 17512 | … |
| 3c249 | 135 | 8 | … | 2711 | … |
| Mrk 290 | 128 | … | … | … | … |
a S/N per 3.17 km s-1 wide pixel element
b S/N per 4.83 km s-1 wide pixel element
4.3 On the covering fraction of strong Mg ii in the halos of Milky Way-type galaxies
Being located within the Milky Way disc, we see the distribution and covering fraction of HVCs in the Galaxy halo from the inside-out perspective (interior view). For a spherical halo with radius the absorption path-length through the halo is always and the observed sky-covering fraction, , of HVC gas reflects the spatial distribution of gas integrated from the inner to the outer regions of the Milky Way halo. If a galaxy and its halo is seen from an exterior view point, the absorption path length through the halo (and disc, eventually) depends on the impact parameter of the sightline, while the observed covering fraction depends on the path length and the radial gas distribution in the halo. Therefore, if we want to put into relation the covering fraction of Mg ii/Si ii in the Milky Way halo with the observed number density of intervening Mg ii/Si ii absorbers at low redshift (equation 1), the different vantage points need to be considered. In addition, one needs to consider the absorption cross section of gaseous discs, as intervening absorbers passes both disc and halo components of galaxies. This important aspect will be discussed in Sect. 4.4.
To investigate the radial distribution of gas in the halos of galaxies and the resulting covering fractions, H i 21cm studies of nearby galaxies are of crucial importance. However, only for a few nearby spiral galaxies (e.g., M31 and NGC 891; Thilker et al. (2004); Oosterloo et al. (2007)) are the 21cm observations deep enough to provide meaningful constraints on the distribution of neutral gas in their halos. In a recent study, Richter (2012) has demonstrated that the projected covering fraction of 21cm HVCs around M31 strongly decreases with radius and can be fitted by an exponential in the form
| (2) |
where is the projected radius in [kpc] and kpc is the scale height for H i in HVCs. An exponential decline of the covering fraction of neutral/ionized gas in the halos of Milky Way-type galaxies is further supported by high-resolution hydrodynamical simulations of galaxies (Fernández et al. (2012)).
Richter (2012) developed the numerical code halopath that can be used to calculate the covering fraction of neutral and ionized halo gas from any given vantage point inside and outside the halo sphere. The halopath code assumes that the neutral and ionized gas in galaxy halos is distributed spherically around the neutral gas discs of these galaxies. Instead of modeling individual halo clouds or halo-gas structures (which would require knowledge about the size distribution of such structures), the code uses the volume filling factor of a given gas phase (e.g., neutral or ionized gas) as a function of galactocentric distance, , as main input parameter. The function can be parametrized for an individual galaxy or for a population of galaxies. A corresponding model for the gas discs can also be included. The code then delivers the absorption cross section for each gas phase as a function of galaxy impact parameter and the total area covered by gas in the discs and halos of the modeled galaxies from an exterior vantage point. The code also calculates the sky covering fraction of each gas phase if a vantage point inside the sphere is chosen; it thus allows us to link the distribution of Milky Way HVCs with the frequency of intervening QSO absorbers. For more details on the code and its application to gaseous galaxy halos see Richter (2012). One important result from the study by Richter (2012) is that the observed sky covering fraction of HVCs in the Milky Way halo (interior view) is fully consistent with the projected covering fraction of H i clouds in the halo of M31 (exterior view). This suggests that the distribution of neutral gas in the halos of both galaxies is similar (in a statistical sense) and that basically all HVCs lie within kpc from the discs.
We now use the code halopath to estimate the total absorption cross section and mean covering fraction of strong Mg ii in HVC analogues around Milky Way/M31 type galaxies from an external vantage point. As model input we adopt the observed sky covering fraction of of strong Mg ii in the Milky Way from the interior vantage point. We further assume that the observed sky covering fraction of strong Mg ii absorption in the Milky Way HVCs (interior view) is representative for non-star forming disc galaxies of similar mass and further assume that the projected covering fraction of halo Mg ii (exterior view) declines expontially (i.e., declines in same way as ; see equation 2).
Under these assumptions, we find (using the halopath code) that the projected covering fraction of strong Mg ii from HVCs in the halos of Milky Way-type galaxies as seen from an external vantage point is for a halo radius of kpc 111We define as the halo radius beyond which the projected covering fraction of strong Mg ii falls below the 3 percent level.. The projected halo area covered by strong Mg ii in HVCs around Milky Way-type galaxies then turns out to be kpc2.
4.4 On the contribution of HVCs to the absorber density of strong Mg ii absorbers
Our STIS measurements imply that HVCs and their distant analogues have a non-negligable absorption cross section in low- and intermediate ions such as Si ii and Mg ii, and thus these objects are expected to contribute to the observed number density of strong Mg ii absorbers. However, for a quantitative estimate of the contribution of HVCs to (Mg ii) one also needs to consider the the absorption cross section of gaseous discs, as intervening absorbers passes both disc and halo components of galaxies. While a detailed discussion of the absorption cross section of gaseous galaxy discs is beyond the scope of this paper, we provide some simple estimates that help to evaluate the relevance of HVCs for the absorption cross section of strong Mg ii absorbers.
For the Mg ii-absorbing disc component in our Milky Way/M31 model galaxy we assume a radius of kpc (for log (H i), based on the M31 21cm data of Braun et al. (2009), and a covering fraction of . The mean absorption cross section for strong Mg ii of a sample of randomly inclined gas discs with these properties then is kpc2, which is percent of the cross section of the surrounding HVC population (see previous section). Since the areas covered by discs and halo clouds are overlapping from an exterior vantage point, projection effects need to be taken into account. Using the halopath code we calculate that the absorption cross section of strong Mg ii of gas discs plus HVCs is kpc2, thus a factor of higher than the cross section of gas discs without a population of surrounding Milky-Way type HVCs. Our calculations therefore imply that, from an exterior vantage point, percent () of the cross section of strong Mg ii absorption in the Milky Way and M31 comes from the HVC population in their halos. Finally, the mean covering fraction of strong Mg ii from the disc plus HVCs in our model halo with radius kpc, as seen from an exterior vantage point, is .
While the Milky Way and M31 show very similar properties in their HVC populations, it is unclear whether these two galaxies are representative for the local galaxy population with respect to their halo-gas distribution. Nearby spiral galaxies do show extended H i halos and extraplanar gas features that may be regarded as distant HVC analogues (Oosterloo et al. (2007); Sancisi et al. (2008)), but with only few galaxies observed at sufficient 21cm sensitivity no meaningful conclusions can be drawn. Yet, coherent H i structures at relatively large galactocentric distances kpc, such as tidal features like the Magellanic Stream (MS), appear to be rare. Note that the MS accounts for a substantial fraction of the neutral gas mass and H i covering fraction in the Milky Way halo (see Richter (2012); their Table 1). Many of the high-velocity absorption features in the southern sky (Fig. 1) may be associated with gas originating in the Magellanic Stream. Therefore, the absorption cross section of gaseous halos of galaxies, that are not surrounded by tidal gas streams, could be substantially smaller. Our STIS sample is not large enough to investigate the absorption cross section of the Milky Way HVCs in different quadrants of the Galaxy on a statistically secure basis to further study this effect in detail. However, using the quickly growing COS data archive, we will address this interesting aspect in a subsequent paper.
Even if one assumes that Milky Way-type HVCs (including the MS) are common in low-redshift galaxies, they cannot dominate the number density of strong Mg ii absorbers at : Richter (2012) estimate that the contribution of Milky-Way type HVCs to the number density of intervening absorbers is , assuming that the HVC distribution around the Milky Way and M31 is typical for the local galaxy population. This number density is percent of the expected value for intervening strong Mg ii absorbers at ((Mg ii; Nestor et al. (2005)).
The contribution of gas discs to the Mg ii cross section is expected to be even smaller. From 21cm studies of the H i mass function of nearby galaxies (e.g., Zwaan et al. (2005)) follows that neutral gas discs with log (H i contribute with only to the local population of strong Mg ii absorbers, a number density that is one order of magnitude smaller than that of strong Mg ii systems. At this H i column density limit, intervening absorbers would be identified as Damped Ly systems (DLAs) in the common classification scheme for QSO absorption-line systems. One may argue that the radial extent and cross section of strong Mg ii absorbing gas discs extends is much larger for column densities below the DLA column density limit. There is, however, no compelling observational evidence for the presence of extended H i discs beyond the DLA column density limit. On the contrary, recent 21cm studies of the radial extent of the H i discs of low-redshift galaxies indicate that gas discs typically are radially truncated with a sharp drop in H i column density at the disc edge from cm-2 down to cm-2 (Braun et al. (2009); Oosterloo et al. (2007); Portas et al. (2009)). From the composite radial H i disc profile of the galaxies in the THINGS survey (Portas et al. (2009); their Fig. 5) it follows that the disc radius (disc area) for log (H i is only () percent larger than for log (H i, so that the contribution of extended gas discs to the observend number density of intervening absorbers is is limited to , which is percent of (Mg ii) at .
In conclusion, neither the discs of Milky Way-type galaxies nor the HVCs in their halos provide enough cross section in Mg ii to explain the large number density of intervening strong Mg ii absorbers. Other phenomena that transport neutral and ionized gas outside of galaxies appear to dominate the absorption cross section of Mg ii in the local Universe. This conclusion is supported by direct estimates of the absorption cross section of Mg ii absorbing galaxies. For intermediate redshifts, Kacprzak et al. (2008) derived a larger mean covering fraction of and larger halo radii for Milky-Way size galaxies in their galaxy sample. Based on observations at low , Bouché et al. (2012) argued that galaxy outflows and winds must dominate the total cross section of strong Mg ii absorption in the local Universe. This, in turn, is in line with our scenario that “quiescent” galaxies (i.e., galaxies that do not drive extended winds and outflows), such as the Milky Way and M31, contribute relatively little to the observed number density of strong Mg ii absorption at low redshift. Moreover, Mg ii absorption in the halos of such galaxies predominantly indicates material that is infalling rather than outflowing.
4.5 On the contribution of HVCs to the absorber density of weak Mg ii absorbers
Intervening Mg ii absorbers with equivalent widths mÅ in the Mg ii line are commonly referred to as weak Mg ii absorbers. With a number density of at for rest-frame equivalent widths mÅ these systems have a similarly high absorption cross section as the strong Mg ii absorbers (Narayanan et al. (2008)). However, compared to strong Mg ii systems, weak Mg ii absorbers probably are located at larger distances from the galaxies, i.e., in their circumgalactic environment (Milutinović et al. (2006)).
Richter et al. (2009) have speculated that some of the weak high-velocity O i/Si ii/Mg ii absorbers in the STIS spectra, that have no associated H i 21cm emission, may be located at larger distances ( kpc) than the more massive 21cm HVCs and thus possibly represent the local analogues of the intervening weak Mg ii absorbers found at low and high redshift. From our study we infer a covering fraction of for weak Mg ii absorption at high-velocities for equivalent widths mÅ; this covering fraction is slightly lower than that of strong Mg ii absorption.
For the same line of arguments outlined in the previous section, the contribution of the 21cm HVCs at kpc to the number density of weak Mg ii absorbers must be small. If, however, low-column density Mg ii/Si ii absorbers in the Milky Way halo were typically located within at distances kpc (as proposed by Richter et al. (2009)), then the absorption cross section of such objects from an exterior vantage point and their contribution to would be increased substantially (since ; equation 1). The ongoing COS observations of weak Mg ii/Si ii absorbers along sightlines that pass the inner and outer halos of nearby galaxies (e.g., Ribaudo et al. (2011)) will help to further explore this scenario.
5 Summary
In this paper, we have used archival UV absorption-line data
from HST/STIS to statistically analyse the absorption
properties of metal ions such as
O i, C ii, Si ii, Mg ii,
Fe ii, Si iii, C iv, and Si iv
in high-velocity clouds (HVCs) in the
Galactic halo towards more than 40 extragalactic background
sources. Our main results are the following:
1) UV absorption features related to HVC gas is detected along 28
sightlines out of 47. The absorption covering fraction, ,
for the different ions vary between 0.20 (Si iv) and 0.70
(C ii, Si iii) for the column density thresholds
chosen for our data (Table 2).
2) We identify Si ii with its five detectable transitions
in the STIS wavelength band as the best-suited ion to statistically
study the UV absorption characterisitics of neutral and weakly ionized
gas in HVCs.
We find that the absorption covering fraction of Si ii in HVC
gas is (Si ii for log (Si ii. This is a factor of two higher than the filling factor
of H i in HVCs for log (H i. Therefore,
Si ii is a sensitive tracer for neutral and partly ionized halo
gas with H i column densities below the detection limit of
H i 21cm HVC surveys.
3) About 70 percent of the high-velocity Si ii absorption is detected
at negative radial velocities (albeit at relatively low significance),
pointing towards a net infall of neutral
and weakly ionized gas traced by Si ii. Most of these
HVC absorbers are composed of velocity subcomponents that
have Doppler-parameters in the range km s-1.
Non-thermal line broadening mechanisms dominate the observed
Si ii -values in HVCs.
4) For the 38 individual Si ii absorption components in HVCs
we obtain typical column densities in the range log (Si ii)
. The Si ii column densities show an irregular
distribution with an apparent deficiency of absorbers with
log (Si ii. As a result, the column-density
distribution function of HVC Si ii absorption
components is not well described by a single-slope
power law in the form . If we,
however, force a fit to such a power law we obtain
and log . This slope
is mildly shallower than the slope of
for H i in HVCs obtained from 21cm observtions.
5) Because Si ii and Mg ii have similar ionization
potentials and both elements have similar cosmic abundances, we
combine the information from Si ii and Mg ii absorption
in the Galactic HVCs to investigate the covering fraction of
strong Mg ii absorption (with equivalent widths Å)
in the Milky Way halo. We find that the covering fraction of
strong Mg ii absorption in the Galactic halo is
from our position within the
Milky Way disc. This value is similar to the covering fraction
of H i in HVCs at column densities log (H i.
Our analysis implies that only the most massive Galactic HVCs would represent
strong Mg ii absorbers if seen as intervening absorbers
from an external vantage point.
6) We combine our results with the geometrical
Milky Way/M31 halo model
by Richter (2012) to estimate the cross section of
strong Mg ii absorption in the Milky Way HVCs if
they would be seen as a QSO absorber from an exterior vantage point.
For disc and halo components together we obtain a
mean covering fraction of strong Mg ii absorption
of for a halo radius
of kpc. From this follows that percent
of the cross section of strong Mg ii
absorption in the Milky Way comes from the HVC
population in the Galactic halo.
7) Our results, together with the Richter (2012) HVC model,
indicate that the contribution of HVCs to the number density
() of strong Mg ii absorbers at
is small, but not negligable ( percent).
These findings are in line with the idea that most of the
intervening strong Mg ii absorbers are related
to gaseous outflows and galactic winds arising in the extended
halos of more actively star-forming galaxies.
For the future, we are planning to continue our studies on the
UV absorption chararacteristics of Galactic HVCs and their relation
to intervening QSO absorbers using the HST/COS data archive
that is quickly filling with fresh UV absorption-line spectra of
low-redshift QSOs.
Acknowledgements.
P.H. and P.R. acknowledge financial support by the German Deutsche Forschungsgemeinschaft, DFG, through grant Ri 1124/.References
- Asplund et al. (2005) Asplund, M., Grevesse, N., & Sauval, A. J. 2005, in Astronomical Society of the Pacific Conference Series, Vol. 336, Cosmic Abundances as Records of Stellar Evolution and Nucleosynthesis, ed. T. G. Barnes III & F. N. Bash, 25
- Ben Bekhti et al. (2008) Ben Bekhti, N., Richter, P., Westmeier, T., & Murphy, M. T. 2008, A&A, 487, 583
- Ben Bekhti et al. (2012) Ben Bekhti, N., Winkel, B., Richter, P., et al. 2012, A&A, 542, A110
- Bergeron & Boissé (1991) Bergeron, J. & Boissé, P. 1991, A&A, 243, 344
- Blitz et al. (1999) Blitz, L., Spergel, D. N., Teuben, P. J., & Hartman, D. 1999, ApJ, 514, 818
- Bouché et al. (2012) Bouché, N., Murphy, M. T., Péroux, C., et al. 2012, MNRAS, 419, 2
- Braun et al. (2009) Braun, R., Thilker, D. A., Walterbos, R. A. M., & Corbelli, E. 2009, ApJ, 695, 937
- Brown (2002) Brown, T. 2002, in HST/STIS Data Handbook; Version 4.0
- Charlton & Churchill (1998) Charlton, J. C. & Churchill, C. W. 1998, ApJ, 499, 181
- Churchill et al. (2003) Churchill, C. W., Vogt, S. S., & Charlton, J. C. 2003, AJ, 125, 98
- Collins et al. (2003) Collins, J. A., Shull, J. M., & Giroux, M. L. 2003, ApJ, 585, 336
- Collins et al. (2004) Collins, J. A., Shull, J. M., & Giroux, M. L. 2004, ApJ, 605, 216
- Collins et al. (2005) Collins, J. A., Shull, J. M., & Giroux, M. L. 2005, ApJ, 623, 196
- Collins et al. (2007) Collins, J. A., Shull, J. M., & Giroux, M. L. 2007, ApJ, 657, 271
- Collins et al. (2009) Collins, J. A., Shull, J. M., & Giroux, M. L. 2009, ApJ, 705, 962
- de Heij et al. (2002) de Heij, V., Braun, R., & Burton, W. B. 2002, A&A, 391, 67
- Fabian et al. (2000) Fabian, D., Savage, B. D., Tripp, T. M., Sembach, K. R., & FUSE Science Team. 2000, in Bulletin of the American Astronomical Society, Vol. 32, American Astronomical Society Meeting Abstracts #196, 711
- Fangano et al. (2007) Fangano, A. P. M., Ferrara, A., & Richter, P. 2007, MNRAS, 381, 469
- Fernández et al. (2012) Fernández, X., Joung, M. R., & Putman, M. E. 2012, ApJ, 749, 181
- Fontana & Ballester (1995) Fontana, A. & Ballester, P. 1995, The Messenger, 80, 37
- Fox et al. (2009) Fox, A. J., Petitjean, P., Ledoux, C., & Srianand, R. 2009, Ap&SS, 320, 27
- Fox et al. (2006) Fox, A. J., Savage, B. D., & Wakker, B. P. 2006, ApJS, 165, 229
- Fox et al. (2004) Fox, A. J., Savage, B. D., Wakker, B. P., et al. 2004, ApJ, 602, 738
- Fox et al. (2010) Fox, A. J., Wakker, B. P., Smoker, J. V., et al. 2010, ApJ, 718, 1046
- Fraternali et al. (2007) Fraternali, F., Binney, J., Oosterloo, T., & Sancisi, R. 2007, New A Rev., 51, 95
- Ganguly et al. (2005) Ganguly, R., Sembach, K. R., Tripp, T. M., & Savage, B. D. 2005, ApJS, 157, 251
- Gardiner & Noguchi (1996) Gardiner, L. T. & Noguchi, M. 1996, MNRAS, 278, 191
- Gibson et al. (2001) Gibson, B. K., Giroux, M. L., Penton, S. V., et al. 2001, AJ, 122, 3280
- Harries et al. (2003) Harries, T. J., Hilditch, R. W., & Howarth, I. D. 2003, MNRAS, 339, 157
- Hindman et al. (1963) Hindman, J. V., McGee, R. X., Carter, A. W. L., Holmes, E. C. J., & Beard, M. 1963, Australian Journal of Physics, 16, 552
- Houck & Bregman (1990) Houck, J. C. & Bregman, J. N. 1990, ApJ, 352, 506
- Kacprzak et al. (2010) Kacprzak, G. G., Churchill, C. W., Ceverino, D., et al. 2010, ApJ, 711, 533
- Kacprzak et al. (2008) Kacprzak, G. G., Churchill, C. W., Steidel, C. C., & Murphy, M. T. 2008, AJ, 135, 922
- Kalberla (2003) Kalberla, P. M. W. 2003, ApJ, 588, 805
- Kalberla et al. (2005) Kalberla, P. M. W., Burton, W. B., Hartmann, D., et al. 2005, A&A, 440, 775
- Kalberla & Haud (2006) Kalberla, P. M. W. & Haud, U. 2006, A&A, 455, 481
- Lehner et al. (2012) Lehner, N., Howk, J. C., Thom, C., et al. 2012, MNRAS, 424, 2896
- Lockman et al. (2002) Lockman, F. J., Murphy, E. M., Petty-Powell, S., & Urick, V. J. 2002, ApJS, 140, 331
- Lu et al. (1998) Lu, L., Sargent, W. L. W., Savage, B. D., et al. 1998, AJ, 115, 162
- Milutinović et al. (2006) Milutinović, N., Rigby, J. R., Masiero, J. R., et al. 2006, ApJ, 641, 190
- Misawa et al. (2009) Misawa, T., Charlton, J. C., Kobulnicky, H. A., Wakker, B. P., & Bland-Hawthorn, J. 2009, ApJ, 695, 1382
- Morton (2003) Morton, D. C. 2003, ApJS, 149, 205
- Muller et al. (1966) Muller, C. A., Raimond, E., Schwarz, U. J., & Tolbert, C. R. 1966, Bulletin of the Astronomical Institutes of the Netherlands Supplement Series, 1, 213
- Narayanan et al. (2008) Narayanan, A., Charlton, J., Misawa, T., Green, R., & Kim, T.-S. 2008, ApJ, 689, 782
- Nestor et al. (2005) Nestor, D. B., Turnshek, D. A., & Rao, S. M. 2005, ApJ, 628, 637
- Oosterloo et al. (2007) Oosterloo, T., Fraternali, F., & Sancisi, R. 2007, AJ, 134, 1019
- Portas et al. (2009) Portas, A., Brinks, E., Usero, A., et al. 2009, in IAU Symposium, Vol. 254, IAU Symposium, ed. J. Andersen, J. Bland-Hawthorn, & B. Nordström, 52P
- Prochter et al. (2006) Prochter, G. E., Prochaska, J. X., & Burles, S. M. 2006, ApJ, 639, 766
- Putman et al. (2002) Putman, M. E., de Heij, V., Staveley-Smith, L., et al. 2002, AJ, 123, 873
- Ribaudo et al. (2011) Ribaudo, J., Lehner, N., Howk, J. C., et al. 2011, ApJ, 743, 207
- Richter (2006) Richter, P. 2006, in Reviews in Modern Astronomy, Vol. 19, Reviews in Modern Astronomy, ed. S. Roeser, 31
- Richter (2012) Richter, P. 2012, ApJ, 750, 165
- Richter et al. (2009) Richter, P., Charlton, J. C., Fangano, A. P. M., Bekhti, N. B., & Masiero, J. R. 2009, ApJ, 695, 1631
- Richter & de Boer (2004) Richter, P. & de Boer, K. S. 2004, in Astrophysics and Space Science Library, Vol. 312, High Velocity Clouds, ed. H. van Woerden, B. P. Wakker, U. J. Schwarz, & K. S. de Boer , 183
- Richter et al. (1999) Richter, P., de Boer, K. S., Widmann, H., et al. 1999, Nature, 402, 386
- Richter et al. (2011) Richter, P., Krause, F., Fechner, C., Charlton, J. C., & Murphy, M. T. 2011, A&A, 528, A12
- Richter et al. (2004) Richter, P., Savage, B. D., Tripp, T. M., & Sembach, K. R. 2004, ApJS, 153, 165
- Richter et al. (2001) Richter, P., Sembach, K. R., Wakker, B. P., et al. 2001, ApJ, 559, 318
- Richter et al. (2005) Richter, P., Westmeier, T., & Brüns, C. 2005, A&A, 442, L49
- Rigby et al. (2002) Rigby, J. R., Charlton, J. C., & Churchill, C. W. 2002, ApJ, 565, 743
- Sancisi et al. (2008) Sancisi, R., Fraternali, F., Oosterloo, T., & van der Hulst, T. 2008, A&A Rev., 15, 189
- Sembach et al. (2002) Sembach, K. R., Gibson, B. K., Fenner, Y., & Putman, M. E. 2002, ApJ, 572, 178
- Sembach et al. (2001) Sembach, K. R., Howk, J. C., Savage, B. D., & Shull, J. M. 2001, AJ, 121, 992
- Sembach et al. (1999) Sembach, K. R., Savage, B. D., Lu, L., & Murphy, E. M. 1999, ApJ, 515, 108
- Sembach et al. (2004a) Sembach, K. R., Tripp, T. M., Savage, B. D., & Richter, P. 2004a, ApJS, 155, 351
- Sembach et al. (2003) Sembach, K. R., Wakker, B. P., Savage, B. D., et al. 2003, ApJS, 146, 165
- Sembach et al. (2004b) Sembach, K. R., Wakker, B. P., Tripp, T. M., et al. 2004b, ApJS, 150, 387
- Shapiro & Field (1976) Shapiro, P. R. & Field, G. B. 1976, ApJ, 205, 762
- Shull et al. (2009) Shull, J. M., Jones, J. R., Danforth, C. W., & Collins, J. A. 2009, ApJ, 699, 754
- Shull et al. (2011) Shull, J. M., Stevans, M., Danforth, C., et al. 2011, ApJ, 739, 105
- Smoker et al. (2011) Smoker, J. V., Fox, A. J., & Keenan, F. P. 2011, MNRAS, 415, 1105
- Steidel et al. (2002) Steidel, C. C., Kollmeier, J. A., Shapley, A. E., et al. 2002, ApJ, 570, 526
- Thilker et al. (2004) Thilker, D. A., Braun, R., Walterbos, R. A. M., et al. 2004, ApJ, 601, L39
- Thom et al. (2008) Thom, C., Peek, J. E. G., Putman, M. E., et al. 2008, ApJ, 684, 364
- Thom et al. (2006) Thom, C., Putman, M. E., Gibson, B. K., et al. 2006, ApJ, 638, L97
- Tripp et al. (2003) Tripp, T. M., Wakker, B. P., Jenkins, E. B., et al. 2003, AJ, 125, 3122
- Wakker et al. (1998) Wakker, B., van Woerden, H., de Boer, K. S., & Kalberla, P. 1998, ApJ, 493, 762
- Wakker (2001) Wakker, B. P. 2001, ApJS, 136, 463
- Wakker (2004) Wakker, B. P. 2004, in Astrophysics and Space Science Library, Vol. 312, High Velocity Clouds, ed. H. van Woerden, B. P. Wakker, U. J. Schwarz, & K. S. de Boer, 25
- Wakker et al. (1999) Wakker, B. P., Howk, J. C., Savage, B. D., et al. 1999, Nature, 402, 388
- Wakker et al. (2011) Wakker, B. P., Lockman, F. J., & Brown, J. M. 2011, ApJ, 728, 159
- Wakker et al. (2007) Wakker, B. P., York, D. G., Howk, J. C., et al. 2007, ApJ, 670, L113
- Wakker et al. (2008) Wakker, B. P., York, D. G., Wilhelm, R., et al. 2008, ApJ, 672, 298
- Welty et al. (1999) Welty, D. E., Frisch, P. C., Sonneborn, G., & York, D. G. 1999, ApJ, 512, 636
- Winkel et al. (2011) Winkel, B., Ben Bekhti, N., Darmstädter, V., et al. 2011, A&A, 533, A105
- Zwaan et al. (2005) Zwaan, M. A., van der Hulst, J. M., Briggs, F. H., Verheijen, M. A. W., & Ryan-Weber, E. V. 2005, MNRAS, 364, 1467
Appendix A Discussion on individual HVC sightlines
In the following we shortly discuss the HVC absorption properties individually for each line of sight and summarize the results from previous studies. The sightlines are sorted by Galactic longitude.
PKS 2155304. The PKS 2155304 sightline is located at , ; it thus passes the outer edge of HVC Complex GCN. HVC absorption is seen at high negative velocities. Only E140M data are available for this sightline. The data have good quality with a S/N of per km s-1-wide pixel element at 1300 Å. HVC absorption is split into two groups (see Fig. B.4; Table B.4). The first group near km s-1 is detected in C ii, Si ii, Si iii, Si iv and C iv and has three subcomponents at and km s-1. The second group is centred near km s-1 and is detected only in Si iii, Si iv and C iv. It has three subcomponents at and km s-1. Detailed analyses of the PKS 2155304 sightline are presented by Sembach et al. (1999) and Collins et al. (2004). This sightline is also discussed in Sembach et al. (2003), Fox et al. (2006), Collins et al. (2009), and Winkel et al. (2011).
Mrk 509. The Mrk 509 sightline is located at , and passes through highly-ionized HVC gas at very high negative velocities. This HVC is associated with Complex GCN (see Winkel et al. (2011)). Both E140M and E230M data are available for this sightline, but the S/N in the data is relatively low ( per km s-1-wide pixel element at 1300 Å). Absorption is detected in four components at , and km s-1 in the lines of C ii, Si iii, Si iv and C iv (see Fig. B.2; Table B.5). Detailed studies of this HVC are presented in Sembach et al. (2004b) and Collins et al. (2004). Other studies that discuss this sightline are Sembach et al. (2003) and Winkel et al. (2011).
PHL 1811. The line of sight towards the Seyfert 1 galaxy PHL 1811 (, ) passes the outskirts of HVC Complex GCN and shows a complex HVC absorption pattern in the LSR veocity range between and km s-1 (see Fig. B.3; Table B.2). Only E140M data are available for this sightline; the S/N is per km s-1-wide pixel element at 1300 Å. Five absorption components are identified at velocities of , and km s-1 in the lines of C ii, O i, Si ii, Al ii, Si iii, Si iv, and C iv. The large number of components suggests a complex spatial distribution of HVC gas in Complex GCN in this direction (see also Winkel et al. (2011)). A detailed study of the Complex GCN absorption towards PHL 1811 is presented in Richter et al. (2009). Other studies of relevance in this context are the ones by Fox et al. (2006), Ben Bekhti et al. (2008), Collins et al. (2009), and Winkel et al. (2011).
PG 1630377. For the line of sight towards the quasar PG 1630377 (, ) only STIS data from the E230M grating are available (see Fig. B.3; Table B.3). HVC absorption is detected in Mg ii and Fe ii in three individual components at negative velocities at , and km s-1. With a S/N of 8 per km s-1 wide pixel element at 2796 Å the data quality is rather low. For the two absorption components near km s-1 the Mg ii absorption is saturated. We did not find any previous studies that discuss HVC absorption along this line of sight.
PG 1444407. Along the line of sight towards the Seyfert 1 galaxy PG 1444407 at and we identify one double-component high-velocity absorber at km s-1 in the lines of Si ii, O i, C ii, and C iv (see Fig. B.3; Table B.3). The C iv component seems to be shifted to more negative velocities and the C ii absorption is strongly saturated. This indicates a two-phase HVC structure with an inner core that is surrounded by an ionized envelope. The data have a S/N per km s-1-wide pixel element at 1260 Å. This HVC absorber is located at the outer edge of Complex C. For further information see the sample of Wakker et al. (2011) and Shull et al. (2009).
PG 1718481. The line of sight towards the QSO PG 1718481 is located at , ; it therefore pierces the outer environments of the HVC Complexes C and K. Unfortunately, only Fe ii is covered by the E230M data, while E140 data are not available. The E230M data have a good S/N of per km s-1-wide pixel element at 2600 Å. The Fe ii line shows three well-defined HVC components at radial velocities of , and km s-1 (see Fig. B.3; Table B.2). We did not find any previous paper that discusses the HVC absorption towards PG 1718481.
NGC 7469. The line of sight towards NGC 7469 passes directly through the Magellanic Stream at , . Consequently, the STIS data show a complex absorption pattern at high negative velocities in the range to km s-1. For this sightline only E140M data are available. The S/N in the data is per km s-1-wide pixel element at 1300 Å. We fit five individual absorption components to the data at , and km s-1 (Fig. B.2; Table B.4). A detailed analysis of this sightline is presented in Fox et al. (2010).
3C 351. The 3C 351 sightline passes the HVC Complexes C and K at , . Only E140 M data are available for this sightline. The S/N in the data is relatively low ( per km s-1-wide pixel element at 1500 Å). A complex absorption pattern at high negative velocities is visible in the absorption lines of C ii, Al ii, Si ii, O i, Si iii, Si iv, and C iv (see Fig. B.1; Table B.1). We identify five absorption components at LSR velocities of , , , , and km s-1. HVC absorption in Complex C and Complex K has been studied in detail by Tripp et al. (2003) and Collins et al. (2007).
Mrk 290. The line of sight towards Mrk 290 (, ) is known to pass through Complex C. Unfortunately there is only E230M data available to us, and only the two Fe ii lines are covered. We find HVC absorption near km s-1 in three absorption components, but because of the low S/N ( per km s-1-wide pixel element at 2600 Å) and the saturation of the Fe ii lines a reliable measurement is not possible (see Fig. B.2; Table B.5). HVC absorption along this sightline is discussed also in Shull et al. (2011).
H1821643. The H1821643 sightline at , is known to pass through the Outer Arm and the HVC Complexes C and K. Thus, the available E140M STIS spectrum shows a complex absorption pattern of high-velocity gas components in the velocity range to km s-1. The E140M data are of good quality with a S/N of per km s-1-wide pixel element at 1300 Å. We identify three distinct absorption components at , and km s-1 in the lines of C ii, O i, Si ii, Al ii, Si iii, Si iv, C iv, and others (see Fig. B.1; Table B.2). A detailed analysis of the HVCs towards H1821643 is presented in Tripp et al. (2003). Other studies that discuss HVC absorption along this sightline are the ones by Sembach et al. (2003) and Collins et al. (2009).
PG 1634706. The PG 1634706 sightline passes HVC Complex C at , . Only E230M data are available for this sightline, so that Complex C absorption is detected only in the lines of Fe ii and Mg ii at LSR velocities in the range to km s-1 (see Fig. B.3; Table B.2). The E230M data have a high S/N of per km s-1-wide pixel element at 2800 Å. Three major absorption components are identified at , and km s-1. The latter component appears to be very broad in Mg ii and possibly is composed of several (unresolved) sub-components. We did not find any previous study in the literature that analyses the HVC absorption in the STIS E230M data towards PG 1634706.
Mrk 279. The line of sight towards Mrk 279 pierces HVC Complex C at , . The available E140M data show strong HVC absorption at negative velocities in the range to km s-1 in the lines of C ii, Si ii, O i, Al ii, Si iii and Si iv. The data have good quality with a S/N of per km s-1-wide pixel element at 1500 Å. Three individual components at , and km s-1 are fitted to the data (see Fig. B.1; Table B.5). There exist a number of detailed studies of the Complex C absorption towards Mrk 279 based on different spectral data (e.g., Gibson et al. (2001); Tripp et al. (2003); Collins et al. (2003), Collins et al. (2007)).
PG 1259593. The line of sight towards the QSO PG 1259593 (, ) passes HVC Complex C at negative LSR velocities; it represents one of the best-studied HVC sightlines in the literature. Because PG 1259593 is relatively faint ( mag) the existing E140M data (obtained with more than ksec integration time; see Sembach et al. (2003)) has only an intermediate S/N of per km s-1-wide pixel element at 1500 Å. Strong HVC absorption associated with Complex C is seen in two distinct absorption components at km s-1 and km s-1 in the lines of Si ii, C ii, Al ii, O i, Si iii, and many other ions (see Fig. B.3; Table B.2; also Richter et al. (2001), their Fig. 2). Detailed studies of HVC Complex C towards PG 1259593 are presented in Richter et al. (2001), Sembach et al. (2003), Collins et al. (2003), and Fox et al. (2004).
Mrk 205. The sightline towards the Seyfert 1 galaxy Mrk 205 passes high-velocity gas at negative velocities at , , associated with HVC Complex C. The available E140M data have a very good S/N of per km s-1-wide pixel element at 1300 Å. Three absorption components at , and km s-1 are identified in the lines of Si ii, C ii and O i (Fig. B.1; Table B.4). For a more detailed study of this sightline see Collins et al. (2007).
3C 249.1. The sightline towards the Seyfert 1 galaxy 3C 249.1 (, ) passes the outskirts of Complex C. With a S/N of per km s-1-wide pixel element at 1260 Å the quality of the available E140M data is relatively low. We identify one HVC absorption component at km s-1 in the lines of Si ii, C ii, and Si iii (see Fig. B.1; Table B.1). HVC absorption along this sightline is mentioned by Collins et al. (2009).
PG 011721. For the line of sight towards the quasar PG 011721 (, ) only E230M data are available. We identify one weak HVC absorber at km s-1 in the lines of Mg ii and Fe ii (see Fig. B.1; Table B.3). The S/N of the data is low ( per km s-1- wide pixel element at 2796 Å). The HVC towards PG 011721 apparently is not connected with any large HVC complexes. We are not aware of any previous study that discusses the PG 011721 sightline with respect to HVC absorption.
NGC 3516. The line of sight toward NGC 3516 (, ) passes through the outskirts of HVC Complex C. For this sightline E140M and E230M data are available, but only the E230M data have sufficient quality to measure HVC absorption features (S/N per km s-1-wide pixel element at 2800 Å.) One single absorption component is detetected at typical Complex C velocities of km s-1 in the lines of Mg ii and Fe ii (see Fig. B.2; Table B.3). HVC absorption towards NGC 3516 is mentioned in the papers from Collins et al. (2009) and Shull et al. (2009).
NGC 4151. Along the sightline towards NGC 4151 (, ) weak HVC absorption is observed at high positive radial velocities in the lines of C ii, Si ii, Fe ii, Mg ii, Si iii, and C iv in a single absorption component centred at km s-1 (Fig. B.2; Table B.3). Both the available E140M and E230M data have good S/N ( per km s-1-wide pixel element at 1300 Å). This HVC appears to be isolated without being connected to any known large HVC complex. A detailed study of this HVC is presented in Richter et al. (2009).
Mrk 132. The line of sight towards Mrk 132 is located at , , located between the two HVC Complexes B and C. Only E230M data are available to us. We find high-velocity absorption at negative velocities ( km s-1 and km s-1), as well as absorption at positive velocities ( km s-1) in the lines of Mg ii and Fe ii (see Fig. B.1; Table B.4). The best fit for the positive-velocity absorption yields two components blending each other. With a S/N of per km s-1- wide pixel element at 2796 Å the data are of medium quality. We are not away of any previous paper that discusses the properties of the HVCs towards Mrk 132.
PG 0953415. The line of sight towards the Seifert 1 galaxy PG 0953415 is located at and and passes high-velocity halo gas that possibly is related to HVC Complex M. For this sightline only E140 M data with intermediate S/N ( per km s-1-wide pixel element at 1300 Å) are available. We identify one HVC component at km s-1 in the lines of C ii, Al ii, Si ii, and Si iii (see Fig. B.2; Table B.1). No previous study exists that analyses in detail the low-ion absorption near km s-1, but the sightline has been studied by several authors to investigate highly-ionized gas in the Milky Way halo at positive radial velocities (Collins et al. (2005), Collins et al. (2009); Fox et al. (2009); Shull et al. (2009); Fabian et al. (2000)).
PG 1116215. High-velocity absorption towards PG 1116215 () is seen at positive LSR velocities between and km s-1 in the lines of Si ii, C ii, O i, Fe ii, Mg ii, Si iii, C iv, and Si iv (see Fig. B.2; Table B.1). This multi-phase absorber is relatively isolated, but possibly is associated with the Magellanic Stream. For this sightline both E140M and E230M data with relatively good S/N ( per km s-1-wide pixel element at 1300 Å) are available. Two absorption components at and km s-1 can be fitted to the data. The HVC absorption towards PG 1116215 was studied in detail by Ganguly et al. (2005) and Richter et al. (2009). Other studies that discuss the HVC absorption along this sightlines are Sembach et al. (2004a), Collins et al. (2005), Collins et al. (2009) and Fox et al. (2006).
Ton S210. Along the line of sight towards Ton S210 (, ) high-velocity absorption is seen at high negative velocities between and km s-1. Absorption near km s-1 is related to the compact high-velocity cloud CHVC (Putman et al. (2002)), while the absorption at higher velocities is of unknown origin. Both E140M and E230M data are available, but the S/N is low (S/N per km s-1-wide pixel element at 1500 Å). Three individual absorption components at , and km s-1 are identified in the lines of C ii, O i, Si ii, Mg ii, Fe ii, Si iii, Si iv and C iv (see Fig. B.4; Table B.5). A detailed analysis of the high-velocity gas towards Ton S210 is presented in Sembach et al. (2002) and Richter et al. (2009).
HE 05154414. The sightline towards HE 05154414 is located at , and passes through a region with some scattered H i clouds that possibly are connected to the Magellanic Stream. Only E230M data are available for this sightline, and the data have a low S/N of per km s-1-wide pixel element at 2400 Å. We identify one HVC absorption component at km s-1 in the lines of Mg ii and Fe ii. Additional HVC absorption components possibly are present near km s-1, but are blended with intergalactic absorption features (Fig. B.1; Table B.4). We did not find any previous paper that discusses the HVC absorption towards HE 05154414.
PG 1211143. Relatively weak weak absorption at positive LSR velocities near km s-1 is seen along the line of sight towards the Seyfert 1 galaxy PG 1211143 (, ) in the lines of Si ii, C ii, O i, Si iii, and C iv (see Fig. B.3; Table B.3). For this line of sight, only E140M data are available. The S/N in the data is good ( per km s-1-wide pixel element at 1300 Å). Two distinct absorption components are observed at km s-1 and km s-1; the latter component is seen predominantly in the intermediate and high ions. This HVC is isolated, but possibly is associated with a compact high-velocity cloud (CHVC) deg away (de Heij et al. (2002)). A detailed study of this absorber is presented in Richter et al. (2009); other studies that mention this HVC are Fox et al. (2006) and Collins et al. (2009).
PG 1216069. The Seyfert 1 galaxy PG 1216069 is located at , . We find HVC absorption in the lines of Si ii, Si iii, and C iv in three individual components at high LSR-velocities of km s-1 in the available E140M data (see Fig. B.1; Table B.3). The detected absorbers seem to be unrelated to any known large HVC complex. The data quality is relatively low (S/N per km s-1- wide pixel element at 1260 Å). HVC absorption towards PG 1216069 is also discussed in Shull et al. (2009).
NGC 3783. The line of sight towards the Seyfert 1 galaxy NGC 3783 at , is a well-studied HVC sightline that passes through the Leading Arm (LA) of the Magellanic Stream with strong absorption features at high positive velocities. For this sightline both E140M and E230M data are available. The data have superb quality with a S/N of per km s-1-wide pixel element at 1300 Å. Very strong disc and halo absorption from local disc and halo gas is seen in a single absorption trough in many lines in the velocity range between and km s-1. This absorption component is not further considered in this paper. Absorption from the LA is seen in two strong components at and km s-1 in the lines of Si ii, O i, Mg ii, Fe ii, Al ii, C ii, and Si iii (see Fig. B.2; Table B.3). There are several detailed studies of the LA absorption towards NGC 3783 (e.g., Lu et al. (1998); Sembach et al. (2001)).
RXJ 1230.80115. In the direction of RXJ 1230.80115 (, ) weak HVC absorption in the lines of Si ii, C ii, O i and Si iii is observed in two individual clouds at high positive velocities near and km s-1 (only E140M data are available; Fig. B.27; Table B.3). The data are of intermediate quality with a S/N of per km s-1-wide pixel element at 1300 Å. For each of the two clouds, the HVC absorption can be fitted with a single absorption component centred at and km s-1, respectively (for C ii we add another component at km s-1). Both HVCs do not appear to be associated with any prominent HVC complex, but obviously respresent isolated gaseous halo strucures. A recent study of this HVC sightline is presented by Richter et al. (2009).
PKS 0312770. The line of sight towards the Seyfert 1 galaxy PKS 0312770 (, ) is known to pass the so-called “Magellanic Bridge” (MB), an extended gaseous structure that connects the Large Magellanic Cloud (LMC) and the Small Magellanic Cloud (SMC; see Hindman et al. (1963)). The MB is believed to be locted at a distance of kpc (Harries et al. (2003)). Thus, the MB does not represent a “classical” Galactic HVC but rather is a tidal feature and gas component of the Magellanic system. For this sightline both E140M and E230M spectra are available, but the average S/N is relatively low (S/N per km s-1-wide pixel element at 1500 Å). Strong high-velocity absorption from gas in the MB is visible in the lines of C ii, O i, Si ii, Si iii, Fe ii, and Mg ii. The STIS data indicate two main absorption components centred at km s-1 and v km s-1 (see Fig. B.3; Table B.1). A detailed analysis of this sightline and the MB absorption is presented in Misawa et al. (2009).
Appendix B Supplementrary tables and figures
| Sightline | log | |||
|---|---|---|---|---|
| (km s-1) | Ion | ( in cm-2) | (km s-1) | |
| PKS 0312770 | Si ii | 14.920.95 | 14.25.9 | |
| C ii | 13.821.06 | 14.25.9 | ||
| O i | 14.990.14 | 14.25.9 | ||
| Fe ii | 13.970.26 | 14.25.9 | ||
| Mg ii | 15.220.34 | 14.25.9 | ||
| Si iii | … | … | ||
| Si ii | 14.730.33 | 16.63.1 | ||
| O i | 14.761.02 | 16.63.1 | ||
| Mg ii | 15.080.29 | 16.63.1 | ||
| Fe ii | 15.050.41 | 16.63.1 | ||
| Si iii | … | … | ||
| PG 0953415 | Si ii | 12.600.06 | 8.51.5 | |
| C ii | 13.520.07 | 8.51.5 | ||
| Si iii | 12.770.09 | 11.92.5 | ||
| 3c249.1 | Si ii | 12.370.08 | 6.61.7 | |
| C ii | 13.750.07 | 6.61.7 | ||
| Si iii | 12.590.18 | 8.65.4 | ||
| 3c351 | Si ii | 13.200.06 | 7.91.3 | |
| C ii | … | … | ||
| O i | 13.890.05 | 7.91.3 | ||
| Al ii | 12.170.07 | 7.91.3 | ||
| Si iii | 14.520.59 | 8.61.2 | ||
| Si iv | 12.620.10 | 9.53.7 | ||
| C iv | 13.230.08 | 9.53.7 | ||
| Si ii | 13.800.05 | 9.40.9 | ||
| C ii | 14.310.26 | 9.40.9 | ||
| O i | 14.580.07 | 9.40.9 | ||
| Al ii | 12.640.06 | 9.40.9 | ||
| Si ii | 14.190.06 | 11.61.0 | ||
| O i | 14.300.07 | 11.61.0 | ||
| Al ii | 12.490.07 | 11.61.0 | ||
| Si ii | 13.510.10 | 7.81.3 | ||
| Al ii | 12.540.12 | 7.81.3 | ||
| O i | 15.140.26 | 7.81.3 | ||
| Si iv | 12.790.07 | 17.80.8 | ||
| C iv | 13.600.06 | 17.80.8 | ||
| Al ii | 12.730.41 | 4.01.3 | ||
| PG 1116215 | Si ii | 13.800.03 | 11.30.7 | |
| C ii | 15.290.09 | 11.30.7 | ||
| O i | 13.910.05 | 11.30.7 | ||
| Fe ii | 13.360.19 | 11.30.7 | ||
| Mg ii | 12.990.24 | 11.30.7 | ||
| Si iii | 13.230.25 | 20.04.0 | ||
| Si iv | 12.990.05 | 14.62.3 | ||
| C iv | 13.760.07 | 14.62.3 | ||
| Si ii | 12.640.27 | 7.93.3 | ||
| C ii | 13.760.05 | 7.93.3 | ||
| O i | 13.660.07 | 7.93.3 | ||
| Fe ii | 12.570.48 | 7.93.3 | ||
| Mg ii | 12.740.41 | 7.93.3 | ||
| Si iii | 14.421.13 | 4.03.6 |
a We do not list column-density limits based on saturated lines.
| Sightline | log | |||
|---|---|---|---|---|
| (km s-1) | Ion | ( in cm-2) | (km s-1) | |
| PG 1259593 | Si ii | 14.600.56 | 5.61.6 | |
| C ii | 15.200.51 | 5.61.6 | ||
| Al ii | 13.440.44 | 5.61.6 | ||
| O i | 14.310.52 | 5.61.6 | ||
| Si ii | 13.720.16 | 10.83.7 | ||
| O i | 14.690.32 | 10.83.7 | ||
| Al ii | 12.580.12 | 10.83.7 | ||
| PG 1634706 | Fe ii | 13.190.05 | 41.12.3 | |
| Mg ii | 13.300.03 | 41.12.3 | ||
| Fe ii | 13.150.07 | 8.21.7 | ||
| Mg ii | 13.080.12 | 8.21.7 | ||
| Fe ii | 13.360.03 | 22.01.3 | ||
| Mg ii | 13.280.02 | 22.01.3 | ||
| PG 1718481 | Fe ii | 12.800.05 | 10.22.5 | |
| Fe ii | 13.170.04 | 25.43.7 | ||
| Fe ii | 13.370.05 | 9.71.0 | ||
| PHL 1811 | Si iii | … | … | |
| Si iv | 12.680.13 | 7.33.6 | ||
| C iv | 14.570.19 | 7.33.6 | ||
| C ii | 13.520.16 | 11.45.6 | ||
| Si iii | 13.140.07 | 22.93.3 | ||
| C ii | 13.130.37 | 6.94.3 | ||
| C iv | 13.430.11 | 6.94.3 | ||
| Si ii | 13.480.06 | 13.72.0 | ||
| C ii | 14.250.10 | 13.72.0 | ||
| O i | 14.150.05 | 13.72.0 | ||
| Al ii | 12.630.13 | 13.72.0 | ||
| C iv | 13.410.08 | 13.72.0 | ||
| Si iv | 12.920.09 | 13.72.0 | ||
| Si iii | 13.610.21 | 13.72.0 | ||
| Si ii | 12.700.09 | 8.71.6 | ||
| C ii | 13.920.10 | 8.71.6 | ||
| Al ii | 12.160.19 | 8.71.6 | ||
| Si iii | 13.390.23 | 13.53.5 | ||
| Si iv | 13.480.27 | 8.32.3 | ||
| C iv | 15.000.17 | 8.32.3 | ||
| H 1821643 | Si iv | 12.400.13 | 3.81.6 | |
| Si ii | 14.210.02 | 18.50.9 | ||
| C ii | 14.620.03 | 18.50.9 | ||
| O i | 14.780.04 | 18.50.9 | ||
| Al ii | 13.090.04 | 18.50.9 | ||
| Si iii | … | … | ||
| C iv | 13.470.06 | 14.24.8 | ||
| Si iv | 13.030.06 | 14.24.8 | ||
| Si ii | 14.280.08 | 9.41.0 | ||
| C ii | … | … | ||
| O i | 15.330.25 | 9.41.0 | ||
| Al ii | 13.240.20 | 9.41.0 |
a We do not list column-density limits based on saturated lines.
| Sightline | log | |||
|---|---|---|---|---|
| (km s-1) | Ion | ( in cm-2) | (km s-1) | |
| PG 011721 | Mg ii | 12.720.06 | 11.12.1 | |
| Fe ii | 12.730.10 | 11.12.1 | ||
| PG 1211143 | Si ii | 12.640.04 | 6.70.8 | |
| C ii | 13.610.03 | 6.70.8 | ||
| O i | 13.140.06 | 6.70.8 | ||
| Si iii | 12.280.14 | 9.23.5 | ||
| C iv | 12.810.13 | 14.36.0 | ||
| Si iii | 12.110.19 | 6.53.2 | ||
| C ii | 13.240.07 | 11.62.1 | ||
| PG 1216069 | Si ii | 12.980.08 | 12.72.6 | |
| Si ii | 12.600.17 | 4.82.5 | ||
| Si iii | 13.160.09 | 19.22.9 | ||
| C iv | 13.650.11 | 19.16.1 | ||
| Si ii | 12.600.09 | 11.33.1 | ||
| Si iii | 12.690.13 | 8.12.5 | ||
| C iv | 13.230.14 | 8.12.5 | ||
| PG 1444407 | C iv | 13.820.12 | 24.38.3 | |
| Si ii | 13.690.25 | 7.52.4 | ||
| C ii | … | … | ||
| O i | 14.160.05 | 7.52.4 | ||
| PG 1630377 | Fe ii | 12.600.15 | 7.52.3 | |
| Mg ii | 12.470.09 | 7.52.3 | ||
| Fe ii | … | … | ||
| Mg ii | … | … | ||
| Fe ii | 13.490.12 | 11.59.8 | ||
| Mg ii | 13.720.45 | 11.59.8 | ||
| RXJ 1230.80115 | Si ii | 12.660.07 | 12.62.9 | |
| C ii | 13.740.04 | 12.62.9 | ||
| Si iii | 12.770.10 | 12.62.9 | ||
| C ii | 13.600.10 | 18.65.0 | ||
| Si ii | 13.550.13 | 3.70.5 | ||
| C ii | 14.340.36 | 3.70.5 | ||
| O i | 13.770.12 | 3.70.5 | ||
| Si iii | 12.660.11 | 13.04.2 | ||
| NGC 3516 | Mg ii | 12.940.07 | 27.65.7 | |
| Fe ii | 13.250.07 | 27.65.7 | ||
| NGC 3783 | Si ii | 13.310.03 | 11.20.6 | |
| O i | 14.840.04 | 11.20.6 | ||
| Mg ii | 12.880.05 | 11.20.6 | ||
| Fe ii | 12.860.08 | 11.20.6 | ||
| C ii | 14.570.04 | 11.20.6 | ||
| Si iii | 12.600.04 | 15.22.0 | ||
| Si ii | 13.880.04 | 17.40.9 | ||
| C ii | … | … | ||
| Mg ii | 13.610.05 | 17.40.9 | ||
| Al ii | 12.720.04 | 17.40.9 | ||
| Fe ii | 13.840.06 | 17.40.9 | ||
| O i | 15.130.03 | 17.40.9 | ||
| Si iii | 12.810.03 | 19.01.8 | ||
| NGC 4151 | Si ii | 12.530.04 | 6.41.0 | |
| C ii | 13.560.04 | 6.41.0 | ||
| Mg ii | 12.230.04 | 6.41.0 | ||
| Fe ii | 12.000.04 | 6.41.0 | ||
| C iv | 13.560.06 | 16.22.5 | ||
| Si iii | 12.710.04 | 11.30.8 | ||
| Fe ii | 12.380.28 | 13.28.1 |
a We do not list column-density limits based on saturated lines.
| Sightline | log | |||
|---|---|---|---|---|
| (km s-1) | Ion | ( in cm-2) | (km s-1) | |
| NGC 7469 | Si ii | 13.070.05 | 17.01.8 | |
| C ii | 13.910.04 | 17.01.8 | ||
| O i | 13.890.09 | 17.01.8 | ||
| Si ii | 13.290.15 | 5.31.3 | ||
| C ii | 15.070.32 | 5.31.3 | ||
| O i | 14.110.17 | 5.31.3 | ||
| Si iii | … | … | ||
| Si iv | 13.370.06 | 30.15.5 | ||
| C iv | 13.800.04 | 30.15.5 | ||
| Si iii | … | … | ||
| Si iv | 12.550.23 | 10.14.3 | ||
| C iv | 13.120.14 | 10.14.3 | ||
| Si ii | 12.880.05 | 12.31.7 | ||
| C ii | 13.250.08 | 12.31.7 | ||
| Si iii | … | … | ||
| Si iv | 12.600.11 | 6.22.3 | ||
| C iv | 13.220.08 | 6.22.3 | ||
| C ii | 12.860.60 | 1.74.1 | ||
| Si iii | … | … | ||
| C iv | 13.670.06 | 11.52.5 | ||
| Si iv | 12.880.08 | 11.52.5 | ||
| HE 05154414 | Fe ii | 12.880.09 | 11.30.9 | |
| Mg ii | 12.880.03 | 11.30.9 | ||
| PKS 2155304 | Si iii | 12.120.12 | 13.14.6 | |
| Si iv | 12.360.07 | 10.51.4 | ||
| C iv | 13.190.04 | 10.51.4 | ||
| C iv | 12.890.09 | 5.51.7 | ||
| Si iii | 11.690.21 | 6.23.3 | ||
| C iv | 12.880.11 | 10.83.8 | ||
| Si iii | 11.670.22 | 9.35.0 | ||
| Si iv | 12.210.12 | 8.43.4 | ||
| C iv | 12.910.26 | 8.43.4 | ||
| Si iv | 12.540.07 | 13.86.8 | ||
| C iv | 12.880.27 | 13.86.8 | ||
| Si ii | 12.630.02 | 9.60.8 | ||
| C ii | 13.750.08 | 9.60.8 | ||
| Si iii | 13.150.05 | 21.72.0 | ||
| Si ii | 11.790.15 | 1.01.6 | ||
| C ii | 13.170.15 | 1.01.6 | ||
| Mrk 132 | Mg ii | 12.630.84 | 5.83.0 | |
| Fe ii | 13.280.12 | 5.83.0 | ||
| Mg ii | 12.950.45 | 8.24.5 | ||
| Mg ii | 13.100.08 | 14.12.5 | ||
| Fe ii | 13.280.07 | 14.12.5 | ||
| Mg ii | 12.870.11 | 17.56.9 | ||
| Fe ii | 13.050.08 | 17.56.9 | ||
| Mrk 205 | Si ii | 13.410.03 | 8.80.7 | |
| C ii | 14.590.08 | 8.80.7 | ||
| O i | 14.770.03 | 8.80.7 | ||
| Si ii | 13.130.04 | 9.30.9 | ||
| C ii | 14.140.06 | 9.30.9 | ||
| O i | 14.000.02 | 9.30.9 | ||
| Si ii | 12.810.11 | 7.42.1 | ||
| C ii | 13.900.07 | 7.42.1 | ||
| O i | 13.570.04 | 7.42.1 |
a We do not list column-density limits based on saturated lines.
| Sightline | log | |||
|---|---|---|---|---|
| (km s-1) | Ion | ( in cm-2) | (km s-1) | |
| Mrk 279 | Si iv | 11.870.19 | 3.33.5 | |
| Si iii | … | … | ||
| Si ii | 13.760.09 | 33.62.5 | ||
| Al ii | 12.590.16 | 33.62.5 | ||
| C ii | … | … | ||
| O i | 14.690.05 | 33.62.5 | ||
| Si iii | … | … | ||
| Si iv | 12.740.08 | 33.62.5 | ||
| Si ii | 13.890.06 | 13.11.4 | ||
| C ii | 13.590.20 | 13.11.4 | ||
| O i | 14.490.12 | 13.11.4 | ||
| Al ii | 12.690.15 | 13.11.4 | ||
| Si iii | … | … | ||
| Mrk 290 | Fe ii | … | … | |
| Fe ii | … | … | ||
| Fe ii | … | … | ||
| Mrk 509 | Si iii | 12.930.15 | 12.75.7 | |
| Si iii | 14.230.77 | 4.74.0 | ||
| Si iv | 13.010.16 | 7.62.1 | ||
| C ii | 13.900.06 | 27.14.3 | ||
| C iv | 14.160.04 | 27.15.8 | ||
| Si iv | 13.060.13 | 27.15.8 | ||
| Si iii | 12.310.21 | 5.23.2 | ||
| Ton S210 | Si iii | 12.830.16 | 7.52.1 | |
| C ii | 13.060.10 | 5.62.1 | ||
| Si iv | 12.810.10 | 5.61.9 | ||
| C iv | 14.350.33 | 5.61.9 | ||
| C ii | 13.160.19 | 4.52.8 | ||
| Mg ii | 12.850.35 | 4.52.8 | ||
| Fe ii | 12.790.25 | 4.52.8 | ||
| Si iii | 12.550.66 | 9.05.6 | ||
| C iv | 13.200.16 | 9.05.6 | ||
| Si ii | 13.810.08 | 8.31.3 | ||
| C ii | … | … | ||
| O i | 14.050.08 | 8.31.3 | ||
| Mg ii | 12.940.20 | 8.31.3 | ||
| Fe ii | 13.620.24 | 8.31.3 | ||
| Si iii | 13.540.44 | 14.411.1 | ||
| C iv | 13.150.16 | 14.411.1 |
a We do not list column-density limits based on saturated lines.