The Galactic Center Cloud G0.253+0.016:
A Massive Dense Cloud with
low Star Formation Potential
Abstract
We present the first interferometric molecular line and dust emission maps for the Galactic Center (GC) cloud G0.253+0.016, observed using the Combined Array for Research in Millimeter–wave Astronomy (CARMA) and the Submillimeter Array (SMA). This cloud is very dense, and concentrates a mass exceeding the Orion Molecular Cloud Complex () into a radius of only , but it is essentially starless. G0.253+0.016 therefore violates “star formation laws” presently used to explain trends in galactic and extragalactic star formation by a factor . Our observations show a lack of dense cores of significant mass and density, thus explaining the low star formation activity. Instead, cores with low densities and line widths —probably the narrowest lines reported for the GC region to date—are found. Evolution over several is needed before more massive cores, and possibly an Arches–like stellar cluster, could form. Given the disruptive dynamics of the GC region, and the potentially unbound nature of G0.253+0.016, it is not clear that this evolution will happen.
Subject headings:
stars: formation — ISM: clouds — Galaxy: center1. Introduction
It is generally understood that the level of ongoing star formation (SF) activity in a cloud correlates with the reservoir of dense gas. This concept first became important for extragalactic research (e.g., Gao & Solomon 2004), and has since been expanded to include the Milky Way (Wu et al., 2010; Lada et al., 2010; Heiderman et al., 2010; Gutermuth et al., 2011). Such work suggests that (i) the mass of dense gas and star formation rate are proportional, and that (ii) the proportionality constant is the same for all clouds near and far. These are the key results for efforts to understand Milky Way and extragalactic SF (Kennicutt & Evans, 2012).
It is thus interesting to study regions like the Galactic Center (GC) molecular cloud G0.253+0.016 (or M0.25+0.01: Guesten et al. 1981)—that is more massive and dense than the Orion A cloud ( in radius for G0.253+0.016; Lis et al. 1994; Longmore et al. 2012, hereafter L12), but does hardly form stars at all (Lis et al., 1994). An infrared luminosity of the entire cloud of , and the absence of embedded compact Hii regions in VLA maps, imply embedded stars earlier than B0 (Lis et al., 2001). Spitzer can provide more stringent limits, as it can detect SF at luminosities of a few out to distances (e.g., in Infrared Dark Clouds [IRDCs]; Zhang et al. 2009 and Pillai et al. 2011). However, this analysis is beyond the scope of the present paper. A faint maser has been detected in the cloud (Lis et al., 1994), but no other masers reside in the area (Caswell et al., 2010, 2011). G0.253+0.016 appears to be in a very extreme physical state, with gas kinetic temperatures exceeding dust temperatures (Guesten et al. 1981; Carey et al. 1998; Lis et al. 2001; L12). G0.253+0.016 forms part of the circumnuclear ring of clouds (Molinari et al., 2011) at distance (also see L12).
Dense GC clouds may play a key role in the mysterious formation of compact and massive stellar aggregates like the “Arches” cluster (Lis & Menten 1998; L12). For all these reasons, we present the first high–resolution interferometric line and dust emission data on G0.253+0.016, obtained using CARMA and the SMA.
2. Observations & Data Reduction
The Submillimeter Array (SMA111The Submillimeter Array is a joint project between the Smithsonian Astrophysical Observatory and the Academia Sinica Institute of Astronomy and Astrophysics, and is funded by the Smithsonian Institution and the Academia Sinica.) (3–2; resolution) and continuum observations near 280 GHz ( total bandwidth) were made with seven antennas in compact–north configuration in a single track in June 2009. Eleven positions separated at less than half a primary beam were observed. The 345 GHz receiver was tuned to the line in the LSB spectral band s4, using 256 channels per chunk and 24 chunks per sideband. The data were taken under good weather conditions at water vapor with characteristic system temperatures .
The Combined Array for Research in Millimeter–wave Astronomy (CARMA222Support for CARMA construction was derived from the Gordon and Betty Moore Foundation, the Kenneth T. and Eileen L. Norris Foundation, the James S. McDonnell Foundation, the Associates of the California Institute of Technology, the University of Chicago, the states of California, Illinois, and Maryland, and the National Science Foundation (NSF). Ongoing CARMA development and operations are supported by the NSF and the CARMA partner universities.) observations were executed in CARMA23 mode in November 2011 in a combined D and SH configuration. Four USB bands were used to observe spectral lines ( [1–0], [1–0], SiO [2–1]; resolution; is not analyzed here), and continuum (500 MHz bandwidth) for calibration purposes. Six positions, spaced at half the primary beam for the 10.4m–telescopes, were observed. We flagged 3.5m–telescope baselines to reduce sidelobes.
Calibration and imaging were done using MIR (an IDL–based SMA package), MIRIAD, and GILDAS. Flux calibrations using Titan and Uranus for the SMA, and Neptune for CARMA are expected to be accurate within 20%.
3. Results
3.1. SMA Dust Emission: No Compact Cores
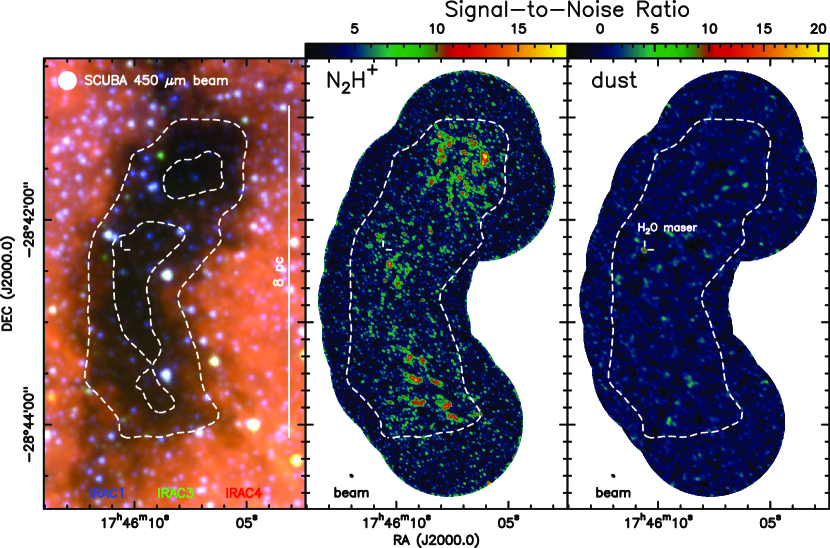
Figure 1 (right) presents the dust emission data, observed with a beam size of (PA ). A continuum peak of is detected within of the aforementioned maser position reported by Lis et al. (1994). The remaining part of the map is free of emission above the –noise–level of .
We adopt a dust temperature of , following Herschel–based estimates of – (L12), and Ossenkopf & Henning (1994) dust opacities scaled down by a factor 1.5 (; see Kauffmann et al. 2010a and Appendix A of Kauffmann et al. 2008). The –noise–level corresponds to an column density of . Towards the maser, the column density derived from the intensity is . This yields masses per beam of and , respectively, when integrating the column densities over the the half power beam width (of effective radius).
Note that L12 use Ossenkopf & Henning (1994) opacities. For consistency, we increase their Herschel–based mass measurement by a factor 1.5.
3.2. SMA Data: Gas Densities
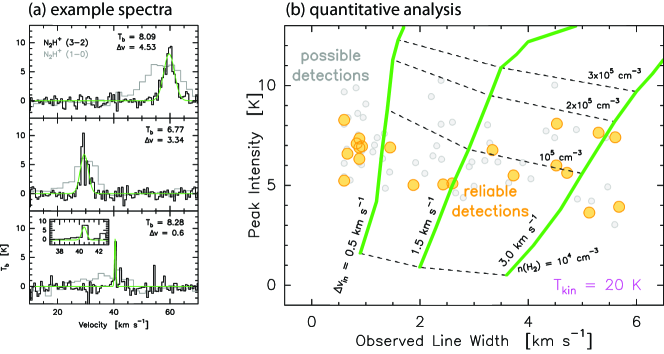
Figure 1 (middle) summarizes the SMA observations of the (3–2) line, observed with a beam size of (PA ). It presents a signal–to–noise ratio (SNR) map: at a given location, we divide the signal in the brightest velocity channel by the standard deviation obtained from channels known to be free of emission. Manual inspection reveals emission at velocities from , indicating channels free of emission at velocities –. Peak positions with an SNR are considered as potentially detected (i.e., 56 positions); detections are deemed reliable for FWHM diameters larger than two beams, permitting lower threshold peak SNRs (22 positions). Figure 1 (middle) illustrates these positions. These spectra are characterized using one–component Gaussian fits. This approach ignores hyperfine blending, which however is considered in the modeling below. Example spectra are shown in Fig. 2(a). Manual inspection always reveals one single significant velocity component per position.
We model the observations from Fig. 2(b) using the MOLLIE non–LTE hyperfine radiative transfer code in the hyperfine statistical equilibrium approximation (Keto & Rybicki, 2010). We adopt a relative abundance of per (e.g., Tafalla et al. 2006). Spherical density profiles are assumed, with the density vanishing for radii . The other free parameters—i.e. the non–thermal gas velocity dispersion, , expressed by intrinsic line widths ; and the kinetic temperature, —are assumed to be constant within the model sphere. We adopt , based on the L12 dust temperature, resulting in optically thick (3–2) lines. The (1–0) emission is not modelled here; it probes a larger spatial scale not focus of the present letter. For given density, higher abundances or temperatures imply higher intensities.
As shown in Fig. 2(b), the brightest (3–2) peaks can be modelled using densities . Integration of the implied density profiles thus yields masses within apertures of projected radius for the most massive structures.
Surprisingly, the continuum–detected –maser position is not detected in . The –maser position is probably less abundant in , and thus not detectable, as seen in some high–mass SF (HMSF) regions (Fontani et al., 2006; Zinchenko et al., 2009). Furthermore, all cores show no significant dust emission. These cores are probably starless and have abundances , as seen in IRDCs that resemble G0.253+0.016 in being relatively dense and starless (Ragan et al. 2006, Sakai et al. 2008, Vasyunina et al. 2011): for example, using MOLLIE to model cores with a higher abundance of and , the predicted (3–2) line intensity is , which is above the detection limit (Fig. 2[b]), even when the density is , which is an order of magnitude below that derived from the upper limit of the dust continuum flux ( within radius; Sec. 3.1).
3.3. CARMA Line Emission Maps:
Many Fragments
with large Velocity Differences
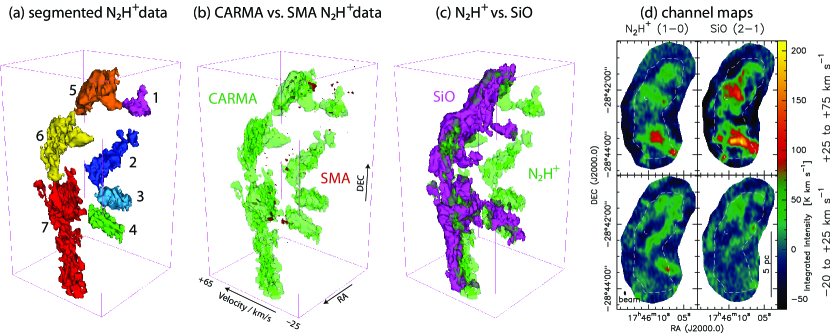
Figure 3(d) shows maps for (1–0) and SiO (2–1) observed with CARMA. The beam size is (PA ). We identify cloud fragments as continuous (1–0) emission structures in position–position–velocity space exceeding an intensity threshold of (noise is ). These fragments, numbered 1–7, are shown in Fig. 3(a). The threshold was chosen to yield a simple yet representative decomposition of the cloud structure. Segmentation was done using 3D Slicer3333D Slicer is available from http://www.slicer.org. See http://am.iic.harvard.edu on astronomical research with 3D Slicer. and CLUMPFIND (Williams et al., 1994), followed by manual removal of artifacts at map boundaries.
Fragment properties are listed in Table 1: from spectra integrated over each fragment, we calculate and as the intensity–weighted velocity mean and standard deviation calculated directly from the velocities and intensities per channel, and . Using intensity–weighted mean line–of–sight velocities calculated for every pixel, we also list the standard deviation among line–of–sight velocities within a given fragment, . Velocity gradients, characterized by , dominate the velocity dispersion, since . The effective radius, , is calculated from the CLUMPFIND–derived fragment area within the intensity surface, .
4. Analysis
4.1. Star Formation Law
The most striking feature of G0.253+0.016, noted by all previous papers on the cloud, is its low star formation rate. Here, we present the first quantitative comparison to recently proposed “star formation laws”.
Lada et al. (2010) suggest that molecular clouds typically contain one embedded YSO per of gas at column densities . Since G0.253+0.016 contains at column densities (L12, plus correction in Sec. 3.1), the cloud should contain YSOs.
Lada et al. (2010) consider, of course, YSOs bright enough to be detected. We assume that Lada et al. cannot sense YSOs of mass , and detect only 50% of stars with mass . For a typical stellar initial mass function (IMF), such as the case of Kroupa (2002), the total number of stars down to is equal to the Lada et al. YSO count times a factor 2.63.
Considering this IMF, a cluster of YSOs similar to the sources considered by Lada et al. would contain stars of mass . This contradicts radio continuum surveys for Hii regions, ruling out stars with mass in G0.253+0.016 (Lis et al., 1994). Assuming a maximum stellar mass , the Kroupa (2002) IMF, and the factor of 2.63 to account for YSOs too faint to be detected even in nearby clouds, the cloud should contain YSOs of the sort considered by Lada et al. (2010)—i.e., by a factor lesser than the YSOs predicted by the Lada et al. (2010) law. See Lis et al. (2001) for a similar IMF analysis. The Lada et al. (2010) law does thus not provide a universal description of the SF process, contrary to assumptions by Lada et al. (2012) to explain the extragalactic Gao & Solomon (2004) infrared–HCN luminosity correlation.
| Fragment | assuming | ||||
|---|---|---|---|---|---|
| pc | |||||
| 1 | 6.1 | 4.9 | 0.47 | 4.5 | |
| 2 | 6.4 | 5.4 | 4.6 | 0.70 | 2.3 |
| 3 | 14.8 | 4.3 | 2.0 | 0.68 | 1.5 |
| 4 | 32.2 | 5.9 | 5.0 | 0.63 | 3.1 |
| 5 | 31.5 | 5.2 | 4.8 | 1.06 | 1.4 |
| 6 | 44.2 | 8.4 | 8.1 | 1.16 | 3.4 |
| 7 | 42.7 | 13.9 | 13.5 | 1.62 | 6.8 |
4.2. Kinematics & Gravitational Binding
Stability against gravitational collapse can, e.g., be evaluated using the virial parameter, or
| (1) |
where is the one–dimensional velocity dispersion and is the constant of gravity. Slightly depending on the equation of state, collapse requires (Bertoldi & McKee, 1992; Ebert, 1955; Bonnor, 1956).
L12 derive within (after correction in Sec. 3.1), and a line width . This yields : the cloud should collapse. But L12 exclude a component at radial velocity, which our maps show to be part of the cloud morphology (i.e., fragments 1–3; Fig. 3). Inclusion of the component yields (Fig. 4 of L12), resulting in . G0.253+0.016 thus seems to be unbound. Fast motions are also suggested by widespread SiO shocks (Sec. 4.5).
Still, many interferometer–detected structures seem to be bound. Using Eq. (1), Table 1 reports for CARMA–detected cloud fragments, assuming column densities (Sec. 4.3). For the SMA–detected cores, we adopt , and the density structure from Sec. 3.2. To include thermal pressure, we substitute for in Eq. (1). For , , and (Fig. 2), is obtained.
4.3. Density Structure
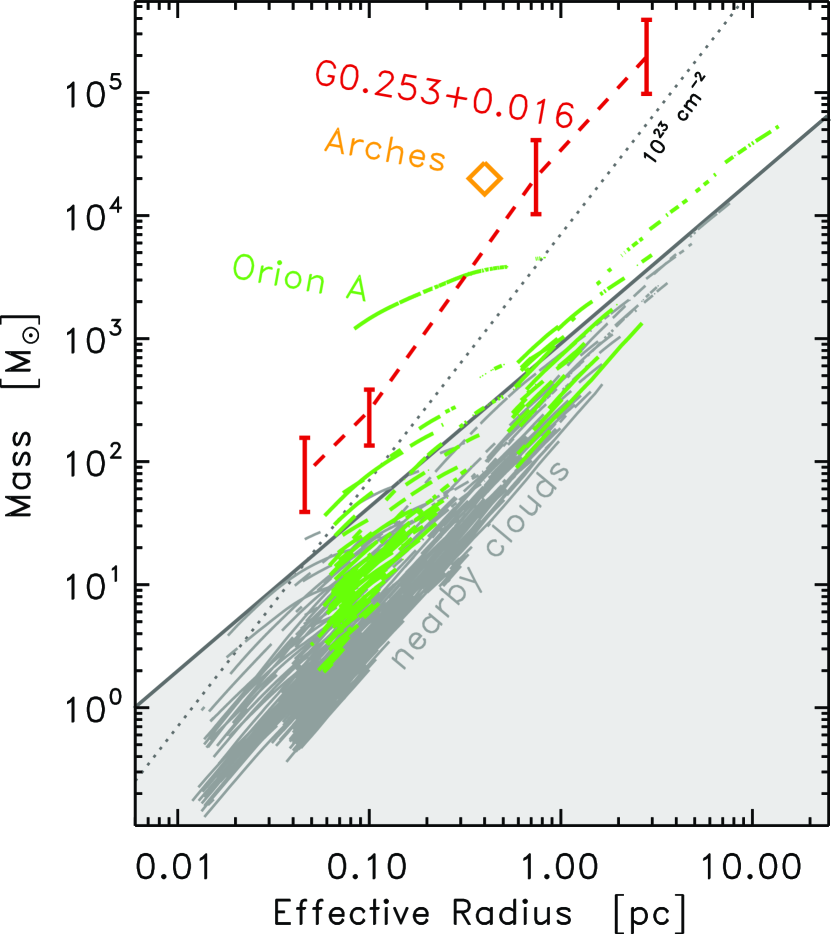
Figure 4 summarizes the density structure of G0.253+0.016. From L12, we take a mass of within radius, and include their peak column density of per beam at radius (; data scaled as explained in Sec. 3.1). Interferometer–based assessments ( and at 0.046 and radius, respectively) are from Secs. 3.1 and 3.2. For dust–based measurements, we adopt an opacity–induced uncertainty by a factor 2 (Kauffmann et al., 2008). Reference data on non–HMSF clouds are from Kauffmann et al. (2010b). Unpublished Bolocam maps444We are indebted to D. Li for providing the data, and A. Ginsburg for reducing it. (adopting dust temperature) and extinction data from Kainulainen et al. (2011) are used to characterize Orion A using methods from Kauffmann et al. (2010a, building on Rosolowsky et al. 2008b). Espinoza et al. (2009) characterize the Arches cluster. An approximate mass–size limit for HMSF is taken from Kauffmann & Pillai (2010),
| (2) |
At , G0.253+0.016 exceeds the mass of equal–sized structures in Orion A by a factor , and the Kauffmann & Pillai criterion by a factor 60. The mean volume and column densities are and , respectively. But at smaller spatial scales, G0.253+0.016 falls short of the masses of the Arches cluster and the most massive structures in Orion A by factors . At radius, the Kauffmann & Pillai criterion is exceeded by a modest factor .
The interferometer–derived masses are probably underestimated. Note, e.g., that the peak column densities from SMA and Herschel data are similar, i.e. vs. . This may result from two factors. First, interferometer–induced spatial filtering may reduce observed intensities. Second, the dust opacity law might be different than assumed. None of this affects our conclusion that little dense gas exist in G0.253+0.016. For example, if masses were higher by a factor 5, this would imply virial parameters for all SMA–detected cores with line widths . Such low values for are very unusual (Pillai et al., in prep.), and thus unlikely. This comparison suggests mass errors smaller than a factor 5.
4.4. Decay of Gas Motions & Accretion onto Cores
HMSF in G0.253+0.016 is still possible if structures in the cloud grow more dense over time. Growth is controlled by the flow crossing time for a spatial scale ,
| (3) | |||||
| (4) |
For the entire cloud, using and , . Undriven turbulence is expected to decay as (Mac Low & Klessen, 2004). Thus, global collapse would take several .
If observed velocity dispersions were reflecting pure inward motions of speed , structures of constant radius could ingest material from radii within the time . For the fragments listed in Table 1, . Adopting and (Fig. 2), holds for the SMA–detected structures.
These timescales control the structure evolution. Several must pass before cores as dense as those in Orion A can form.
4.5. Nature and Future of G0.253+0.016
The low SF rate for this compact and massive cloud indicates that G0.253+0.016 is in an extreme physical state (Sec. 4.1). Lis & Menten (1998) and Lis et al. (2001) take the existence of widespread SiO emission as evidence for an ongoing cloud–cloud collision. This molecule is believed to trace shocks unambiguously: Silicon is usually locked up in dust grains, and requires grain–grain collisions at velocities to be released (Guillet et al., 2009). Further gas phase reactions yield SiO in . Figure 3 shows for the first time that the SiO distribution is likely too smooth and extended to result from outflows associated with a population of embedded stars. Processes on larger spatial scales, such as cloud–cloud collisions, are a more probable origin. It thus seems plausible that G0.253+0.016 is a very young cloud that will soon dissipate internal motions and efficiently form stars in a few (Sec. 4.4).
However, the cloud may not be gravitationally bound and simply disperse (Sec. 4.2). Furthermore, G0.253+0.016 is subject to the disruptive GC environment: as already mentioned by L12, following the GC orbit proposed by Molinari et al. (2011), G0.253+0.016 will arrive at the present location of Sgr B2 in . The latter cloud essentially represents a standing shock, where gas clouds on different GC orbit families collide (e.g., Bally et al. 2010). Given the disturbed nature of the Sgr B2 region, it is not clear whether G0.253+0.016 will then be disrupted or be pushed into collapse.
5. Conclusion
G0.253+0.016 deviates from current “star formation laws” (e.g., Lada et al. 2010) by a factor (Sec. 4.1). The scarcity of significant dust and cores in our SMA interferometer maps (Secs. 3.1–3.2) reveals that G0.253+0.016 is presently far away from forming high–mass stars and clusters (Sec. 4.3): considerable evolution for several is needed before such star formation might occur (Sec. 4.4). The cloud might thus be very young and currently forming in a cloud–cloud collision indicated by SiO shocks (Sec. 4.5). Given the disruptive dynamics of the Galactic Center region (Sec. 4.5), and the potentially unbound nature of the cloud (Sec. 4.2), it is unclear whether evolution towards significant star formation will ever happen.
References
- Bally et al. (2010) Bally, J., Aguirre, J., Battersby, C., Bradley, E. T., Cyganowski, C., Dowell, D., Drosback, M., Dunham, M. K., Evans II, N. J., Ginsburg, A., Glenn, J., Harvey, P., Mills, E., Merello, M., Rosolowsky, E., Schlingman, W., Shirley, Y. L., Stringfellow, G. S., Walawender, J., & Williams, J. 2010, The Astrophysical Journal, 721, 137
- Bertoldi & McKee (1992) Bertoldi, F., & McKee, C. F. 1992, The Astrophysical Journal, 395, 140
- Bonnor (1956) Bonnor, W. 1956, MNRAS, 116, 351
- Carey et al. (1998) Carey, S. J., Clark, F. O., Egan, M. P., Price, S. D., Shipman, R. F., & Kuchar, T. A. 1998, The Astrophysical Journal, 508, 721
- Caswell et al. (2011) Caswell, J. L., Breen, S. L., & Ellingsen, S. P. 2011, Monthly Notices of the Royal Astronomical Society, 410, 1283
- Caswell et al. (2010) Caswell, J. L., Fuller, G. A., Green, J. A., Avison, A., Breen, S. L., Brooks, K. J., Burton, M. G., Chrysostomou, A., Cox, J., Diamond, P. J., Ellingsen, S. P., Gray, M. D., Hoare, M. G., Masheder, M. R. W., McClure-Griffiths, N. M., Pestalozzi, M. R., Phillips, C. J., Quinn, L., Thompson, M. A., Voronkov, M. A., Walsh, A. J., Ward-Thompson, D., Wong-McSweeney, D., Yates, J. A., & Cohen, R. J. 2010, Monthly Notices of the Royal Astronomical Society, 404, 1029
- Di Francesco et al. (2008) Di Francesco, J., Johnstone, D., Kirk, H., MacKenzie, T., & Ledwosinska, E. 2008, ApJS, 175, 277
- Ebert (1955) Ebert, R. 1955, Zeitschrift fur Astrophysics, 37, 217
- Espinoza et al. (2009) Espinoza, P., Selman, F. J., & Melnick, J. 2009, Astronomy and Astrophysics, 501, 563
- Fontani et al. (2006) Fontani, F., Caselli, P., Crapsi, A., Cesaroni, R., Molinari, S., Testi, L., & Brand, J. 2006, Astronomy and Astrophysics, 460, 709
- Gao & Solomon (2004) Gao, Y., & Solomon, P. M. 2004, The Astrophysical Journal, 606, 271
- Guesten et al. (1981) Guesten, R., Walmsley, C. M., & Pauls, T. 1981, Astronomy and Astrophysics, 103, 197
- Guillet et al. (2009) Guillet, V., Jones, A. P., & Pineau des Forêts, G. 2009, Astronomy and Astrophysics, 497, 145
- Gutermuth et al. (2011) Gutermuth, R. A., Pipher, J. L., Megeath, S. T., Myers, P. C., Allen, L. E., & Allen, T. S. 2011, The Astrophysical Journal, 739, 84
- Heiderman et al. (2010) Heiderman, A., Evans, N. J., Allen, L. E., Huard, T., & Heyer, M. 2010, The Astrophysical Journal, 723, 1019
- Kainulainen et al. (2011) Kainulainen, J., Beuther, H., Banerjee, R., Federrath, C., & Henning, T. 2011, Astronomy & Astrophysics, 530, A64
- Kauffmann et al. (2008) Kauffmann, J., Bertoldi, F., Bourke, T. L., Evans, N. J., & Lee, C. W. 2008, Astronomy and Astrophysics, 487, 993
- Kauffmann & Pillai (2010) Kauffmann, J., & Pillai, T. 2010, The Astrophysical Journal, 723, L7
- Kauffmann et al. (2010a) Kauffmann, J., Pillai, T., Shetty, R., Myers, P. C., & Goodman, A. A. 2010a, The Astrophysical Journal, 712, 1137
- Kauffmann et al. (2010b) —. 2010b, The Astrophysical Journal, 716, 433
- Kennicutt & Evans (2012) Kennicutt, R. C. J., & Evans, N. J. I. 2012, eprint arXiv:1204.3552
- Keto & Rybicki (2010) Keto, E., & Rybicki, G. 2010, The Astrophysical Journal, 716, 1315
- Kroupa (2002) Kroupa, P. 2002, Science, 295, 82
- Lada et al. (2012) Lada, C. J., Forbrich, J., Lombardi, M., & Alves, J. a. F. 2012, The Astrophysical Journal, 745, 190
- Lada et al. (2010) Lada, C. J., Lombardi, M., & Alves, J. a. F. 2010, The Astrophysical Journal, 724, 687
- Lis & Menten (1998) Lis, D. C., & Menten, K. M. 1998, The Astrophysical Journal, 507, 794
- Lis et al. (1994) Lis, D. C., Menten, K. M., Serabyn, E., & Zylka, R. 1994, The Astrophysical Journal, 423, L39
- Lis et al. (2001) Lis, D. C., Serabyn, E., Zylka, R., & Li, Y. 2001, The Astrophysical Journal, 550, 761
- Longmore et al. (2012) Longmore, S. N., Rathborne, J., Bastian, N., Alves, J., Ascenso, J., Bally, J., Testi, L., Longmore, A., Battersby, C., Bressert, E., Purcell, C., Walsh, A., Jackson, J., Foster, J., Molinari, S., Meingast, S., Amorim, A., Lima, J., Marques, R., Moitinho, A., Pinhao, J., Rebordao, J., & Santos, F. D. 2012, The Astrophysical Journal, 746, 117
- Mac Low & Klessen (2004) Mac Low, M.-M., & Klessen, R. 2004, Reviews of Modern Physics, 76, 125
- Molinari et al. (2011) Molinari, S., Bally, J., Noriega-Crespo, A., Compiègne, M., Bernard, J. P., Paradis, D., Martin, P., Testi, L., Barlow, M., Moore, T., Plume, R., Swinyard, B., Zavagno, A., Calzoletti, L., Di Giorgio, A. M., Elia, D., Faustini, F., Natoli, P., Pestalozzi, M., Pezzuto, S., Piacentini, F., Polenta, G., Polychroni, D., Schisano, E., Traficante, A., Veneziani, M., Battersby, C., Burton, M., Carey, S., Fukui, Y., Li, J. Z., Lord, S. D., Morgan, L., Motte, F., Schuller, F., Stringfellow, G. S., Tan, J. C., Thompson, M. A., Ward-Thompson, D., White, G., & Umana, G. 2011, The Astrophysical Journal, 735, L33
- Ossenkopf & Henning (1994) Ossenkopf, V., & Henning, T. 1994, A&A, 291, 943
- Pillai et al. (2011) Pillai, T., Kauffmann, J., Wyrowski, F., Hatchell, J., Gibb, A. G., & Thompson, M. A. 2011, Astronomy & Astrophysics, 530, A118
- Ragan et al. (2006) Ragan, S. E., Bergin, E. A., Plume, R., Gibson, D. L., Wilner, D. J., O’Brien, S., & Hails, E. 2006, The Astrophysical Journal Supplement Series, 166, 567
- Rosolowsky et al. (2008b) Rosolowsky, E., Pineda, J., Kauffmann, J., & Goodman, A. 2008b, ApJ, 679, 1338
- Sakai et al. (2008) Sakai, T., Sakai, N., Kamegai, K., Hirota, T., Yamaguchi, N., Shiba, S., & Yamamoto, S. 2008, The Astrophysical Journal, 678, 1049
- Tafalla et al. (2006) Tafalla, M., Santiago-García, J., Myers, P. C., Caselli, P., Walmsley, C. M., & Crapsi, A. 2006, Astronomy and Astrophysics, 455, 577
- Vasyunina et al. (2011) Vasyunina, T., Linz, H., Henning, T., Zinchenko, I., Beuther, H., & Voronkov, M. 2011, Astronomy and Astrophysics, 527, A88
- Williams et al. (1994) Williams, J., de Geus, E., & Blitz, L. 1994, ApJ, 428, 693
- Wu et al. (2010) Wu, J., Evans, N. J., Shirley, Y. L., & Knez, C. 2010, The Astrophysical Journal Supplement Series, 188, 313
- Zhang et al. (2009) Zhang, Q., Wang, Y., Pillai, T., & Rathborne, J. 2009, The Astrophysical Journal, 696, 268
- Zinchenko et al. (2009) Zinchenko, I., Caselli, P., & Pirogov, L. 2009, Monthly Notices of the Royal Astronomical Society, 395, 2234