My Software has a Vulnerability, should I Worry?
Abstract
(U.S) Rule-based policies to mitigate software risk suggest to use the CVSS score to measure the individual vulnerability risk and act accordingly: an HIGH CVSS score according to the NVD (National (U.S.) Vulnerability Database) is therefore translated into a “Yes”. A key issue is whether such rule is economically sensible, in particular if reported vulnerabilities have been actually exploited in the wild, and whether the risk score do actually match the risk of actual exploitation.
We compare the NVD dataset with two additional datasets, the EDB for the white market of vulnerabilities (such as those present in Metasploit), and the EKITS for the exploits traded in the black market. We benchmark them against Symantec’s threat explorer dataset (SYM) of actual exploit in the wild. We analyze the whole spectrum of CVSS submetrics and use these characteristics to perform a case-controlled analysis of CVSS scores (similar to those used to link lung cancer and smoking) to test its reliability as a risk factor for actual exploitation.
We conclude that (a) fixing just because a high CVSS score in NVD only yields negligible risk reduction, (b) the additional existence of proof of concepts exploits (e.g. in EDB) may yield some additional but not large risk reduction, (c) fixing in response to presence in black markets yields the equivalent risk reduction of wearing safety belt in cars (you might also die but still…). On the negative side, our study shows that as industry we miss a metric with high specificity (ruling out vulns for which we shouldn’t worry).
[In order to address the feedback from BlackHat 2013’s audience, the final revision (V3) provides additional data in Appendix My Software has a Vulnerability, should I Worry? detailing how the control variables in the study affect the results.]
I Introduction
Software vulnerabilities assessments usually rely on the National (US) Vulnerability Database111http://nvd.nist.gov (NVD for short). Each vulnerability is published with its “technical assessment” given by the Common Vulnerability Scoring System222http://www.first.org/cvss (CVSS) which rate diverse aspects of the vulnerability [14].
Despite not being designed to be a metric for risk, the CVSS score is often used as such. For example, the US Federal government with QTA0-08-HC-B-0003 reference notice specified that IT products to manage and assess the security of IT configurations must use the NIST certified S-CAP protocol [20], which explicitly says: “Organizations should use CVSS base scores to assist in prioritizing the remediation of known security-related software flaws based on the relative severity of the flaws.” In other words, a rule-based policy is enforced: if the vulnerability is marked as ”high risk” by the CVSS assessment, it must be fixed with high priority.
This interest from the industry is matched by many academic studies. On one side, Vulnerability Discovery Models [2, 13] try to predict the number of vulnerabilities that affect a software at a certain point in time, while empirical studies try to identify trends between open and closed source software [8, 24]. On the other, attack graphs [25] and attack surfaces [11] aim at assessing in which ways a system is “attackable” by an adversary and how easily he/she can succeed. Foundational to both approaches is calculating a) the number of vulnerabilities in the system and b) their individual “risk assessment”.
Beside NVD, many datasets are used in vulnerability studies, but are they the right databases? For example, Bozorgi et al. [4] showed (as a side result) that the exploitability CVSS subscore distribution do not correlate well with existence of known exploit from the ExploitDB. There are two ways to interpret this result: the exploitability of CVSS is the wrong metric, or Bozorgi and his co-authors used the wrong DB. ExploitDB could just be used by security researchers to show off their skills (and obtain more contracts as penetration testers) but might not have a correlation with actual attacks by hackers. The same problem is faced in [24] where a large majority of “exploits” are reported as zero-days333A zero-day exploit is present when the exploit is reported before or on the date that the vulnerability is disclosed.. The “exploit” time in OVSDB only measures the time when a proof-of-concept exploit becomes known. Security researchers normally submit proof-of-concept exploits to vendors and vulnerability white markets in order to prove that the vulnerability is worth the bounty [15]. So it is not surprising that there are a lot of “zero-day” exploits; still, this does not mean that a bad hacker really exploited those vulnerabilities.
I-A Our Contribution
In this work we address the following questions:
-
1.
To what extent can public vulnerability datasets be used to measure software security?
-
2.
Are the rule-based policies enforced, for example, by the US Government effective in decreasing risk of attacks?
In other words, when new vulnerabilities are found, are we measuring the rate at which security researchers try to extract bounties from vendors (and should not worry)? or there is a concrete risk that bad guys end up exploiting our systems (and should worry)? This is particularly interesting for the majority of internet users at large (individuals or corporations) who have not enough individual value to justify a targeted attack444Obviously, for a nuclear power plan any proof-of-concept exploit is a problem as even a software crash may lead to a national emergency.. To this aim we analyzed three datasets:
-
•
NVD, the benchmark universe of vulnerabilities;
-
•
EDB (Exploit-DB), which contains information on the existence of proof-of-concept exploits;
-
•
EKITS, our database containing vulnerabilities used in exploit kits sold in the black market.
No previous study, to the best of our knowledge, extensively looked at CVSS subscores throughout different datasets. We benchmark these DBs against the vulnerabilities exploited in the wild that we collected from Symantec’s Threats and Attack Signatures databases (SYM). To make statistically sound conclusions, we perform a case-controlled randomized experiment in which we build random samples of the NVD, EDB and EKITS datasets according to the characteristics of exploits in SYM; our goal is to understand the conditional probability that a CVSS (sub)score would lead to an attack.
The conclusion of our analysis is the following: the NVD and EDB databases are not a reliable source of information for exploits in the wild, and the CVSS score doesn’t help. The CVSS score only shows a significant sensitivity (i.e. prediction of attacks in the wild) for vulnerabilities bundled in exploit kits in the black market (EKITS). Unfortunately, it does not show a high specificity in any of our datasets, which means that it is not suitable, as a metric, to rule out “un-interesting” vulnerabilities (i.e. those not exploited). This leads to a very low (3%) expected reduction in risk one would benefit from by using solely the CVSS score as a prioritisation metric for patching. Including the presence of a proof-of-concept exploit or of an exploit traded in the black markets can raise the bar up to 60%.
The fact that EKITS vulnerabilities are actually exploited in the wild is interesting in its own sake. “Malware sales” are often scams for wanna-be scammers, such as credit-card numbers sold over IRC channels [10]. Surprisingly, while the final products (card numbers) sold on the black market are bad, the software tools to get them from the source look good.
In the rest of the paper we introduce our four datasets (§II) and draws a first, observational comparison (§III). The core of the paper analyses the goodness of the CVSS global score as a test for exploitation (§IV), digs down over the submetrics (§V), and identifies trade-offs in the exploitation (§VI). Then we describe our randomized case-controlled analysis (§VII), and discuss the implication of our findings (§VIII) and threats to validity (§IX). We finally discuss related works (§X) and conclude (§XI). For completeness and replicability, we also report in Appendix My Software has a Vulnerability, should I Worry? the whole set of results from the controlled experiment.
II Datasets
NVD is the reference database for disclosed vulnerabilities held by NIST. It has been widely used and analyzed in previous vulnerability studies [12, 24, 22]. Our NVD dataset contains data on 49599 vulnerabilities.
The Exploit-db555http://www.exploit-db.com/ (EDB) includes information on proof-of-concept exploits also represented in the Open Source Vulnerability Database (OSVDB). Both OSVDB666http://blog.osvdb.org/2012/08/15/august-2012-a-few-small-updates and EDB777http://www.exploit-db.com/author/?a=3211&pg=1 derive data from Metasploit Framework. EDB references exploited CVEs by each entry in the db. Most notable studies relying on either EDB or OSVDB are [24, 4]. EDB contains data on 8122 vulnerabilities for which a proof-of-concept code is reported.
EKITS is our dataset of vulnerabilities bundled in Exploit Kits888Exploit Kits are web sites that the attacker deploys on some public webserver he/she owns. When the victim is fooled in making an HTTP connection to the Exploit Kit, the latter checks for vulnerabilities on the user’s system and, if any, tries to exploit them; eventually, it infects the victim machine with malware of some sort. sold on the black market. EKITS is a substantial expansion on Contagio’s Exploit Pack Table999http://contagiodump.blogspot.it/2010/06/overview-of-exploit-packs-update.html. EKITS repots exploits for 114 unique CVEs bundled in 90+ exploit kits. We cannot disclose the individual sources of the black-hat communities because this might hamper us from future studies.
In order to determine whether a vulnerability has been used in the wild we have collected exploited CVEs from Symantec’s AttackSignature101010http://www.symantec.com/security_response/attacksignatures/ and ThreatExplorer111111http://www.symantec.com/security_response/threatexplorer/ public data. The SYM dataset contains 1277 CVEs identified in viruses (local threats) and remote attacks (network threats) by Symantec’s commercial products. This has of course some limitation as direct attacks by individual motivated hackers against specific companies are not considered in this metric. Note that SYM does not report volumes of exploits, but only the binary information “evidence of an exploit in the wild for that CVE is reported” or “is not reported”.
Table I summarizes the content of each dataset and the collection methodology. They are available upon request121212http://securitylab.disi.unitn.it/doku.php?id=datasets.
| DB | Content | Collection method | #Entries |
|---|---|---|---|
| NVD | CVEs | XML parsing | 49599 |
| EDB | Publicly exploited CVEs | Download and web parsing to correlate with CVEs | 8122 |
| SYM | CVEs exploited in the wild | Web parsing to correlate with CVEs | 1277 |
| EKITS | CVEs in the black market | ad-hoc analysis + Contagio’s Exploit table | 114 |
III Exploratory analysis of datasets
As a starting point, we perform an exploratory analysis of our four datasets: Given a dataset (NVD, EDB, EKITS), what is the likelihood that a vulnerability it contains is going to be exploited in the wild? i.e. occurs also in SYM?
Table II reports the likelihood of a vulnerability being a threat if it is contained in one of our datasets. Each row represents a dataset from which the intersection with the smaller ones has been ruled out: this is to avoid data overlapping that would falsify the results. The vulnerabilities which exploits are sold in the market (EKITS) have 75.73% chances of being monitored as actively exploited. This percentage is much lower for EDB-EKITS and NVD-(EDB+EKITS).
Conditional probability that a vulnerability is listed by Symantec as threat knowing that it is contained in a dataset, i.e. . vuln in SYM vuln not in SYM EKITS 75.73% 24.27% EDB-EKITS 4.08% 95.92% NVD-(EDB+EKITS) 2.10% 97.90%
Figure 1 is a Venn diagram of our datasets; size of the area is proportional to the number of vulnerabilities and the color is an indication of the CVSS score (a detailed analysis of the CVSS scores will follow up briefly).
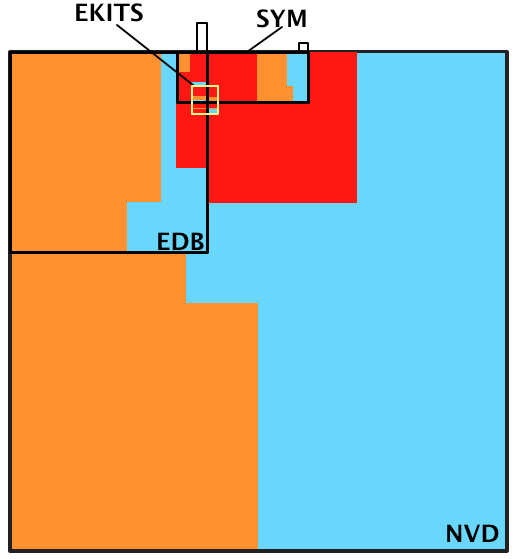
Dimensions are proportional to data size. In red vulnerabilities with CVSS9 score. Medium score vulnerabilities are orange, and cyan represents vulnerability with CVSS lower than 6. The two small rectangles outside of NVDspace are vulnerabilities whose CVEs are not present in NVD.
As one can see from the picture many vulnerabilities in the NVD are not exploited. The EDB is not overly better in terms or representativeness of actual exploitation in the wild: EDB and SYM share 393 vulnerabilities only. This means that EDB does not contain about 75% of the threats measured by Symantec in the wild. As a minor note, at the collection time NVD did not reference all vulnerabilities we found: the SYM and EDB datasets contain respectively 9 and 63 vulnerabilities that are not present in the NVD dataset. CVSS data on these vulnerabilities is therefore missing.
A rushing conclusion might be that, if one sees a vulnerability affecting his/her software in the black market, there is roughly a 75% chance that it is exploited in the wild. The same cannot be said about EDB and NVD, for which the percentages is less than 5%. However, a possible counter observation would be that EDB and NVD include many low CVSS score vulnerabilities and therefore better results could be obtained if we eliminate the vulnerabilities with little chances of being exploited.
To analyze the CVSS score we report its histogram distribution in Figure 2.
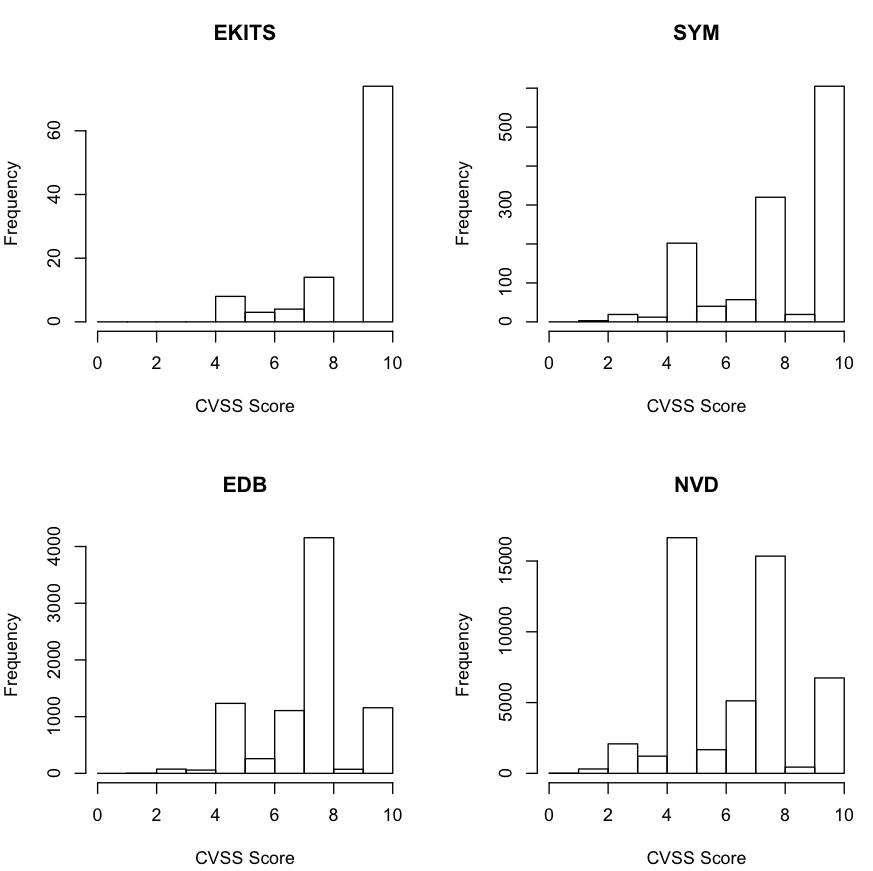
We identify three clusters of vulnerabilities throughout all our datasets and three corresponding categories of scores:
-
1.
HIGH: CVSS 9
-
2.
MEDIUM: 6 CVSS 9
-
3.
LOW: CVSS 6
In Figure 1, red, orange and cyan areas represent HIGH, MEDIUM and LOW score vulnerabilities respectively. The NVD reports a large number of HIGH CVSS vulnerabilities that are not included in SYM. Similarly, while most of the intersection between EDB and SYM is covered by HIGH score CVEs, much of the red area for EDB is not included in SYM. By looking only at HIGH and MEDIUM score vulnerabilities in EDB one would deal with about 94% false positives (i.e. HIGH and MEDIUM score vulnerabilities not included in SYM). False positives decrease to 79% if one considers vulnerabilities with HIGH scores only. Table III reports distribution of HIGH, MEDIUM, LOW scores per each dataset. Looking at SYM, 52% of its vulnerabilities have a CVSS score strictly lower than 9 (665 out of 1277), and 21% are strictly lower than 6 (272): 1 out of 5 vulnerabilities exploited in the wild is ranked as a “low risk vulnerability”, and 1 out of 2 as “non-high risk”. From a first look, HIGH CVSS scores seem to be over-estimating the risk of exploitation for a large volume of vulnerabilities both in NVD and EDB, and not being representative of vulnerabilities in SYM.
| CVSS Score | EKITS | SYM | EDB | NVD |
|---|---|---|---|---|
| HIGH | 86 | 612 | 1.209 | 7.026 |
| MEDIUM | 16 | 393 | 5.324 | 20.858 |
| LOW | 12 | 272 | 1.589 | 21.715 |
| tot | 114 | 1.277 | 8.122 | 49.599 |
However, this is only an observational analysis from which it is hard to make statistically sound conclusions: (a) HIGH, MEDIUM or LOW CVSS scores may only be loosely correlated to inclusion of a vulnerability in SYM. (b) These results are strongly influenced by the volume of the datasets: NVD contains almost 50.000 vulnerabilities, while those monitored in the wild are less than 1.300. In NVD and EDB there might be a lot of “noisy” vulnerabilities that are not reported in SYM because of other factors, such as age or software type (i.e. old or rare vulnerabilities that Symantec may not detect). To address (a) we measure the goodness of the CVSS score as a test for exploitation by means of two metrics, namely sensitivity and specificity (§IV). As for (b), we further explore the CVSS subscores of vulnerabilities to underline technical peculiarities of vulnerabilities in SYM (§V) and use these as control variables to sample from EKITS, EDB, and NVD vulnerabilities representative of those reported in SYM (§VII).
IV Sensitivity and specificity
In the medical domain, the sensitivity of a test is the conditional probability of the test giving positive results when the illness is present. The specificity of the test is the conditional probability of the test giving negative result when there is no illness. In our context, we want to assess to what degree our current test (the CVSS score) predicts the illness (the vulnerability being actually exploited in the wild and tracked in SYM).
Following the preliminary analysis in Section III we consider MEDIUM and HIGH CVSS scores as positive tests while LOW scores are negative tests. In formulae, Sensitivity= while Specificity= . Table IV reports the observational specificity and sensitivity for each dataset.
Sensitivity is the probability of the CVSS score being medium or high for vulnerabilities actually exploited in the wild. Specificity is the probability of the CVSS score being low for vulnerability not exploited in the wild. test(v.CVSS) = H v M — SYM EKITS EDB NVD Sensitivity 97.4% 94.4% 78.7% Specificity 32.0% 20.3% 44.4%
For the CVSS score to be a good indicator within a dataset, sensitivity and specificity should be both high, possibly over 90%. As shown in Table IV, EKITS is the dataset that performs the best in terms of sensitivity: out of 100 vulnerability exploited in the wild 97 are predicted to be dangerous (H or M CVSS score). EDB scores well in terms of sensitivity too: a proof-of-concept exploit and a HIGH or MEDIUM CVSS score may be a good test for exploitation. Differently for NVD, a HIGH or MEDIUM CVSS score is not a good indicator that an exploit will actually show off in the wild: 21 vulnerabilities out of 100 which are actually dangerous would fail to get the HIGH or MEDIUM score (79% sensitivity). Unfortunately, all databases show poor specificity: more than 1 out of 2 not dangerous vulnerabilities would be wrongly tagged with a HIGH or MEDIUM score. Loosely speaking, the CVSS test would generate a medical unnecessary panic among otherwise healthy individuals.
V The Impact and Exploitability Subscores
The general CVSS score takes into consideration two subscores: Impact and Exploitability. The former is a measure of the potential damage that the exploitation of the vulnerability could cause to the victim system; the latter attempts at measuring the likelihood-to-be-exploited of the vulnerability [4]. They are calculated on the basis of further variables that are reported in Table V.
| Impact subscore | ||
|---|---|---|
| Confidentiality | Integrity | Availability |
| Undefined | Undefined | Undefined |
| None | None | None |
| Partial | Partial | Partial |
| Complete | Complete | Complete |
| Exploitability subscore | ||
|---|---|---|
| Access Vector | Access complexity | Authentication |
| Undefined | Undefined | Undefined |
| Local | High | Multiple |
| Adjacent Net. | Medium | Single |
| Network | Low | None |
The impact metric distribution is plotted in Figure 3.
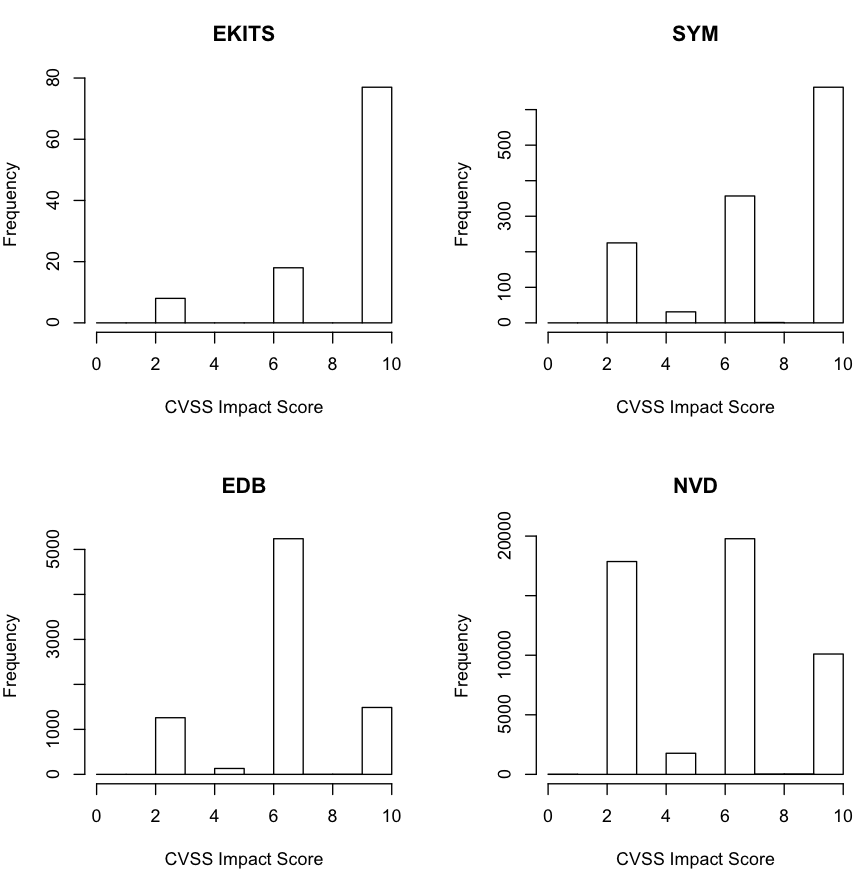
Somewhat surprisingly, high impact score vulnerabilities are not by default preferred by attackers: 20% of vulnerabilities in SYM have a LOW Impact score. This effect is much reduced for the EKITS dataset: only 8% of its vulnerabilities score LOW. As for EDB and NVD, the picture changes completely: the greatest majority of vulnerabilities in EDB (5245, or 65%) have a medium score, and the remaining 35% is equally split between HIGH and LOW Impact vulnerabilities. This might explain the low specificity for EDB: many vulnerabilities that just have a proof-of-concept exploit are of little harm. In NVD 20% have HIGH Impact score, 40% are scored MEDIUM, and 40% LOW.
V-A Breakdown of the Impact subscore
Looking in more detail into the Impact metric, Table VI shows the incidence of values of the Confidentiality, Integrity, Availability assessments for vulnerabilities in the SYM dataset. Negligible configurations are represented by a handful of vulnerabilities (e.g. the CCN case is represented by 1 vulnerability).
| Confidentiality | Integrity | Availability | SYM | Negligible |
| C | C | C | 51.53% | |
| C | C | N | 0.08% | ✓ |
| C | N | C | 0.08% | ✓ |
| C | N | N | 0.23% | ✓ |
| P | P | P | 26.16% | |
| P | P | N | 1.64% | ✓ |
| P | N | P | 0.16% | ✓ |
| P | N | N | 7.67% | |
| N | C | C | 0.23% | ✓ |
| N | P | C | 0.08% | |
| N | P | P | 0.63% | |
| N | P | N | 3.68% | |
| N | N | C | 1.57% | ✓ |
| N | N | P | 6.26% |
Availability almost always assumes the same value as Integrity, apart from the case where both Integrity and Confidentiality are set to “None”. The average variation of the Impact score if Availability was not to be considered at all is less than 1%.
For the sake of readability, we therefore exclude the Availability assessment from the analysis, and proceed by looking at the two remaining Impact variables in the four datasets. The analysis is reported in Table VII.
| Confidentiality | Integrity | SYM | EKITS | EDB | NVD |
|---|---|---|---|---|---|
| C | C | 51.61% | 74.76% | 18.11% | 20.19% |
| C | P | 0.00% | 0.00% | 0.02% | 0.04% |
| C | N | 0.31% | 0.97% | 0.71% | 0.88% |
| P | C | 0.00% | 0.00% | 0.01% | 0.01% |
| P | P | 27.80% | 16.50% | 63.52% | 37.84% |
| P | N | 7.83% | 0.97% | 5.61% | 10.62% |
| N | C | 0.23% | 0.00% | 0.18% | 0.22% |
| N | P | 4.39% | 2.91% | 5.07% | 16.52% |
| N | N | 7.83% | 3.88% | 6.75% | 13.69% |
Most vulnerabilities in the NVD dataset score “partial” in the two Impact sub-metrics. This effect is enhanced in the EDB dataset, where almost 70% of vulnerabilities score partial in at least one of either Confidentiality or Integrity. The scenario changes completely when looking at the SYM and EKITS datasets: most vulnerabilities ( 50%, 75%) score “Complete”. Black market exploits and exploits in the wild seem to affect vulnerabilities with different impact types than the general population of vulnerabilities and proof-of-concept exploits.
V-B Breakdown of the Exploitability subscore
Figure 4 shows the distribution of the Exploitability subscore per each dataset.
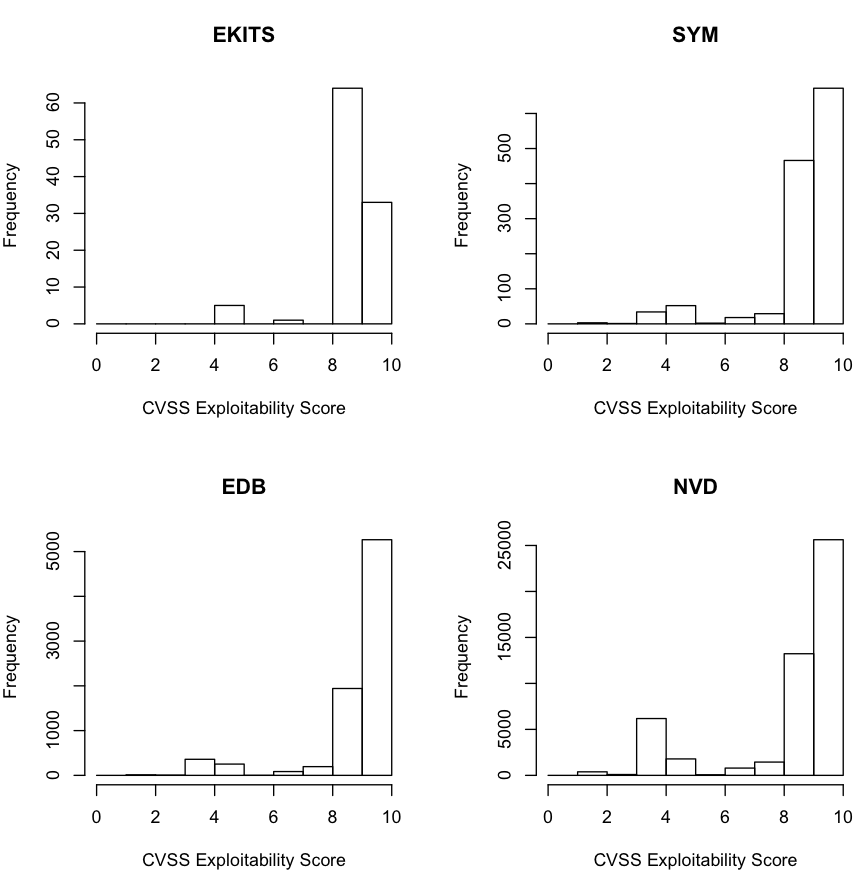
Here the distinction between HIGH and MEDIUM Exploitability scores seem to be not very significant: numbers are qualitatively identical among all datasets. Almost all vulnerabilities, independently of the dataset, score between 8 and 10. Bozorgi et al.’s [4] did not find any correlation between Exploitability subscore and existence of a proof-of-concept exploit; we confirm their results and extend this conclusion to exploits in the wild and exploits in the black markets as well.
The Exploitability subscore resembles more a constant than a variable. This means that it has little to no influence on the variance of the final CVSS score, which may in turn affect the suitability of the CVSS as a risk metric.
Table VIII reports the total distribution of the exploitability variables.
| metric | value | SYM | EKITS | EDB | NVD | |
|---|---|---|---|---|---|---|
| Exploitability | Acc. Vec. | local | 2.98% | 0% | 4.57% | 13.18% |
| adj. | 0.23% | 0% | 0.12% | 0.35% | ||
| net | 96.79% | 100% | 95.31% | 87.31% | ||
| Acc. Com. | high | 4.23% | 4.85% | 3.37% | 4.54% | |
| medium | 38.35% | 63.11% | 25.49% | 30.42% | ||
| low | 57.24% | 32.04% | 71.14% | 65.68% | ||
| Auth. | multiple | 0% | 0% | 0.02% | 0.05% | |
| single | 3.92% | 0.97% | 3.71% | 5.35% | ||
| none | 96.08% | 99.03% | 96.27% | 95.45% |
The greatest share of actual risk comes from vulnerabilities that can be remotely exploited; just 3% of vulnerabilities are only locally exploitable. Moreover, the great majority of discovered vulnerabilities is network-based (87.31%). Authentication is another essentially boolean variable: most exploited vulnerabilities do not require any authentication.
VI Exploitation Trade-offs
Among all subscores, access complexity present some interesting results: the percentage of “very difficult” vulnerabilities is equal (and very low) among all datasets but the percentage of “medium-complexity” vulnerabilities in the SYM and EKITS datasets is much higher than in EDB. Medium-complexity vulnerabilities in the EKITS and SYM datasets are respectively 63.11% and 38.35% of the totals. As a comparison, only 25.49% of vulnerabilities in the EDB dataset have medium-complexity. Exploits in EDB seem to mostly capture easy vulnerabilities (71.14%).
To explain the higher average Complexity for vulnerabilities exploited in the wild we hypothesized a trade-off for the attacker: he/she is willing to put extra-effort in the exploitation only if it is worth it (i.e. the vulnerability has HIGH Impact). Table IX reports the results of the analysis.
| Impact | SYM | EKITS | EDB | NVD | ||
|---|---|---|---|---|---|---|
| Access Complexity | High | HIGH | 1.33% | 2.91% | 0.58% | 0.92% |
| MEDIUM | 1.88% | 1.94% | 2.34% | 1.89% | ||
| LOW | 1.02% | 0.00% | 0.46% | 1.89% | ||
| Medium | HIGH | 32.50% | 55.34% | 8.84% | 7.65% | |
| MEDIUM | 3.60% | 4.85% | 11.35% | 7.69% | ||
| LOW | 2.43% | 2.91% | 5.29% | 14.83% | ||
| Low | HIGH | 18.09% | 16.50% | 8.89% | 11.80% | |
| MEDIUM | 22.55% | 10.68% | 50.89% | 30.43% | ||
| LOW | 16.60% | 4.85% | 11.36% | 22.90% |
The trade-off is particularly evident in the medium-complexity range of vulnerabilities: if an attacker is going to exploit a medium complexity vulnerability, most likely this will be a HIGH impact one (32.50%). This trend is even more evident in the EKITS dataset, in which this percentage increases to 55.34%. This supports the hypothesis that the extra effort required to write an exploit for a more complex vulnerability is to be weighted with a corresponding “return on investment”. Upon LOW Complexity vulnerabilities, on the other hand, there is no clear difference between HIGH, MEDIUM and LOW impacts: as long as exploitation is easy, the attacker may be willing of exploiting it regardless of the Impact score.
VII Randomized Case-Controlled study
In order to obtain stronger statistical results on the suitability of the CVSS score as a risk metric for vulnerabilities, we generate a case-controlled study where the cases are the vulnerabilities in SYM (loosely corresponding to cases of lung cancer), and NVD, EDB, and EKITS correspond to patients from various sources and medical conditions. We are looking for a control variable (like smoking) that could overwhelmingly explain exploitation (cancer).
Confounding variables. Vulnerabilities in EKITS, EDB and NVD may be generally different from those in SYM with respect to a number of factors. For example, vulnerabilities in EDB may contain software that is of no commercial interest for Symantec, and therefore for which an entry in SYM cannot exist. Another possibility is that the chances for a vulnerability being reported in SYM may vary in time (for example, because less attacks existed in that year, or because Symantec may not always perform equally well in detecting attacks).
We identify as possible control variables for inclusion in SYM confidentiality, integrity, availability, software and year. We then generate three random samples of vulnerabilities from the EKITS, NVD and EDB datasets by selecting vulnerabilities which characteristics (i.e. our confounding variables) appear in SYM as well. We report here the results with the highest statistical significance, those resulting from the samples controlled by Impact. Additionally, after feedback from the BlackHat community, in Appendix My Software has a Vulnerability, should I Worry? we report how results change by considering the other confounding variables, alongside with confidence intervals and statistical significance (p-value).
Sampling. Random sampling is necessary because our data may not reflect the complete population of (a) disclosed vulnerabilities; (b) existing proof-of-concept exploits and exploits traded in the black markets; (c) vulnerabilities actually exploited in the wild.
However, randomness may introduce (random) noise in the analysis. To measure this (and draw more precise conclusions) we perform the sampling with bootstrapping: we bootstrap our experiment by sampling, with repetition, 400 times for each control and each dataset 131313The sampling was performed with the statistical tool R-CRAN [21]..
Results. Table X reports the median, for each sample, of the results. We consider as a (tentative) explanatory variable the value of the CVSS and as response variable the presence of the vulnerability in SYM.
Case-controlled distribution among dataset of CVSS scores (explanatory variable) vs actual exploit in the wild as reported by SYM (response variable). EKITS’ v SYM v SYM p-value CVSS H or M 76 (81.72%) 17 (18.28%) CVSS L 2 (20%) 8 (80%) EDB’ v SYM v SYM p-value CVSS H or M 104(11.84%) 774 (88.15%) CVSS L 3 (1.28%) 232 (98.72%) NVD’ v SYM v SYM p-value CVSS H or M 48 (5%) 912 (95%) CVSS L 4 (1.38%) 285 (98.62%)
To check for statistical significance of the data we run a Fisher’s exact test (because data is not normal) for each outome. The p-values are reported in Table X. We recall that the value does not measure the strength of an effect or an association (it is up to us to see it in the data), but only the certainty that the effect that we see in the data is not due to chance. A value less than 0.05 is considered statistically significant because there is less than 5% chances that the data could show the distribution by chance.
VII-A Sensitivity and specificity for case-controlled study
Table XI reports the median sensitivity and specificity of the CVSS score for the controlled samples. 95% confidence intervals are reported within square brackets. The 0% variation in sensitivity and specificity of the EKITS dataset is to be attributed to the small relative size of EKITS vs SYM: in the sampling, all vulnerabilities from EKITS are chosen. Sensitivity is quite high among all the datasets. Yet, the CVSS score has a poor specificity for all datasets. Sampling SYM-like characteristics does not help in scoring vulnerabilities as “non-dangerous” ones. In particular, if we consider a specificity of 25%, only 1 out of 4 non-attacked vulnerabilities are marked as LOW score. The remaining three are instead marked as MEDIUM or HIGH.
Case-controlled sensitivity and specificity of the CVSS score being medium or high and the vulnerability being actually exploited in the wild (i.e. in SYM). Data has been random sampled from EDB and NVD according SYM’s distribution of values for CVSS subscores. 95% confidentiality interval is here reported in square brackets []. EKITS EDB’ NVD’ Sens. 97.44% [ 0%] 97.17% [94.33%-100%] 91.88% [84.20%-98.11%] Spec. 32% [ 0%] 23.09% [21.94%-24.33%] 23.82% [22.52%-25.02%]
From table XI we also conclude that the CVSS score performs differently according to the reference dataset used.
VII-B Rule-based policies for risk mitigation with CVSS
From our analysis, using the CVSS score as a test for exploitation does not provide enough precision for effective patching policies. However, this only outlines the a-priori performance of the CVSS test in identifying exploits, and says little about the effectiveness of it as a ”metric for patching”. We here address the question: What is the marginal diminishment of risk provided by CVSS when coupled with different datasets?
To understand wether a HIGH CVSS HIGH risk policy is meaningful, we adopt an approach similar to that used by Evans in [6] to estimate the effectiveness of seat belts in preventing fatalities. In his case, the “effectiveness” was given by the difference in the probability of having a fatal car crash when wearing a seatbelt and when not. More formally, Pr(Death x Seat belt) - Pr(Death x not Seat belt). In our case, the effect we are interested in is the ability of the CVSS score (combined with the datasets) to predict the actual exploit in the wild (i.e. present in SYM). Table XII shows the difference of the probabilities.
Increase in relative risk for a vulnerability to be exploited depending on CVSS score, database and control variables used for the study i.e..
| Database | Results | 95% Conf. Interval |
|---|---|---|
| EKITS’ | +61.72% | 0% |
| EDB’ | +10.51% | 8.39%-12.64% |
| NVD | +3.54% | 1.60%-5.28% |
Each row in the table tells us the chances that a vulnerability with a MEDIUM or HIGH CVSS score is actually exploited in the while vs one with LOW scores.
For EKITS’ we see that fixing HIGH/MED vulnerabilities from the black markets carries a decrease in risk by +61% with respect to the immediate lower level of risk (i.e. the remaining vulnerabilities after the patching). For EDB’, the evidence is less strong. We only have +10% more chances of exploitation for the high level of risk than for the low level. Finally, NVD’ has even weaker association for the same reasons: we only have +3% increase in chances of exploitation for HIGH/MED vulnerabilities. We conclude that rule-based policies based solely on the CVSS score may result inadequate for deployment of effective security countermeasures. Coupling the CVSS test with other evidence carries more informative results than simply using the score as-is.
VIII Discussion and implications
Vulnerability assessment and patching has traditionally been a matter of great discussion within the community [5, 23, 24]. Here we summarize the main implications from our study.
Implication #1. Vulnerabilities exploited in the wild show specific patterns in the CVSS subscores; these observations can help to improve the sensitivity and specificity of the CVSS score. Some conclusions are more absolute (exceptions counted on one’s fingers), while others are only statistically significant (hence the adverb “usually”), with a -value lower than for Fisher’s exact test.
-
1.
Actually exploited vulnerabilities are remotely exploitable and do not require multiple authentication. Despite SYM containing local threats, only 3% of vulnerabilities are assessed as “only locally exploitable”. Vulnerabilities exploitable from an adjacent network are even less interesting. 4% of vulnerabilities require a single instance of authentication; none of them require multiple authentication.
-
2.
Availability impact is irrelevant. The impact of more than 96% of vulnerabilities in SYM can still be accurately assessed without taking into consideration the value of Availability.
-
3.
Confidentiality and Integrity losses usually go hand-in-hand. The overwhelming majority of vulnerabilities in SYM have complete or partial losses for both Confidentiality and Integrity: other combinations are less likely to be exploited.
-
4.
“Exploits” in EDB are usually for easy vulnerabilities. Proof-of-concept exploits released in the EDB are for vulnerabilities easier to exploit than those actually exploited by attackers.
-
5.
Medium-complexity vulnerabilities are usually interesting only if they come along with a high impact. Non-trivial to exploit vulnerabilities seem to be of interest for the attacker only if they come with a higher final impact on the vulnerable system. In contrast, Low-complexity vulnerabilities are exploited uniformly among all impact scores.
Implication #2. Rule-based policies based on CVSS score, like the US Government NIST SCAP protocol [20], may not make for an effective strategy: only a negligible number of low-risk vulnerabilities are ruled out, even after controlling for “significant” vulnerabilities. Security policies may require a major adjustment to meet these observations. In particular, while the CVSS score underlines interesting characteristics of exploited vulnerabilities, it may be not expressive enough to reliably represent exploitation. Other factors such as software popularity, presence of the exploit in the market and existence of easier vulnerabilities for that software are all “contextual factors” that might be worth exploring in future work.
Implication #3. The black market can be a good source to assess which vulnerabilities represent high risk. Exploits for vulnerabilities traded in the black market significantly overlap with those recorded in the wild, which may indicate that the presence of an exploit in the black markets can be a good indicator of the associated vulnerability risk.
IX Threats to validity
We identify a number of threats to validity. [19].
Construct validity A number of issues we encountered while collecting SYM and EKITS may affect the soundness of the data collection. Because of the unstructured dataset of the original SYM dataset, to build SYM we needed to take some preliminary steps. We couldn’t be sure about whether the collected CVEs were relevant to the threat. To address this issue, we proceeded in two steps. First, we manually analyzed a random selection of about 50 entries to check for the relevance of the CVE entries in the “description” and “additional references” sections of each entry. To double-check our evaluation, we questioned Symantec in an informal communication: our contact confirmed that the CVEs are indeed relevant. Another issue is what data from Symantec’s attack-signature and threat-explorer datasets to use. Attack and infection dynamics are not always straightforward, and network and host-based threats often overlap. However, in this case, we are interested in a general evaluation of risk. Moreover, Exploit Kits enforce a drive-by download attack mechanism, therefore they are related to both the network and local threat scenario. We therefore can safely rely on both the datasets for our analyses.
Due to the shady nature of the tools, the list of exploited CVEs in EKITS may be incomplete and/or incorrect. We don’t know any straightforward way to address this issue; to mitigate the problem, we crossed-referenced entries with knowledge from the security research community and from our direct observation of the black markets.
External validity is concerned with the applicability of our results to real-world scenarios. Symantec is a world-wide company and a leader in the security industry. We are therefore confident is considering their data representative sample of real-world scenarios. Yet, our conclusion cannot be generalized to the risk due to targeted attacks. Targeted attacks in the wild of a specific platform or system are less likely to generate an entry into a general anti-virus product, and therefore less likely to be represented in the SYM database.
X Related works
Many studies before ours analyzed and modeled trends in vulnerabilities. Among all, Frei et al. [8] were maybe the first to link the idea of life-cycle of a vulnerability to the patching process. Their dataset was a composition of NVD, OSVDB and ‘FVDB’ (Frei’s Vulnerability DataBase, obtained from the examination of security advisories for patches). The life-cycle of a vulnerability includes discovery time, exploitation time and patching time. They showed that, according to their data, exploits are often quicker to arrive than patches are. They were the first to look, in particular, at the difference in time between time of first “exploit” and time of disclosure of the vulnerability. This work have recently been extended by Shahzad et al. [24], which presented a comprehensive vulnerability study on NVD and OSVDB datasets (+ Frei’s) that included vendors and software in the analysis. Many interesting trends on vulnerability patching and exploitation are presented, and support Frei’s conclusion. However, they basically looked at the same data: looking at EDB or OSVDB may say little about actual threats and exploitation of vulnerabilities. The difference with our paper, here, is that we look at a sample of actual attack data (SYM) and underline differences in vulnerability characteristics with other datasets. For a thorough description of our datasets and a preliminary discussion on the data, see [3]. An analysis of the distribution of CVSS scores and subscores has been presented by Scarfone et al. in [22] and Gallon [9]. However, while including CVSS subscore analysis, their results are limited to data from NVD and do not provide any insight on vulnerability exploitation. In this sense, Bozorgi et al. [4] were probably the first in looking at CVSS subscores against exploitation. They showed that the “exploitability” metric, usually interpreted as “likelihood to exploit” did not match with data from EDB: their results were the first to show that the interpretation of CVSS metrics might not be entirely straightforward. We extended their first observation with a in-depth analysis of subscores and of actual exploitation data.
On a slightly different line of research are studies concerned with the discovery of vulnerabilities. In [5] Clark et. al. underlined the presence of a ‘honeymoon effect’ in the discovery of the first vulnerability for a software, that is related with the “familiarity” of the product. In other words, the more popular the software the smaller the gap between software release and first vulnerability disclosure.
Other studies focused on the modeling of the vulnerability discovery processes. Foundational in this sense are the works of Alhazmi et al. [2] and Ozment’s [18]. The former fits 6 vulnerability models to vulnerability data of four major operative systems, and shows that Alhazmi’s ‘S shaped’ model is the one that performs the better. However, as previously underlined by Ozment [18], vulnerability models often rely on unsound assumptions such as the independence of vulnerability discoveries. Current vulnerability discovery models are indeed not general enough to represent trends for all software [13]. Moreover, vulnerability disclosure and discovery are complex processes [17], and can be influenced by {black/white}-hat community activities [5, 8] and economics [15].
Our analysis of the vulnerabilities marketed in exploit-kits is also interesting because it confirms that the market for exploits is significantly different than the IRC markets for credit cards and other stolen goods. Indeed, dismantling some previous analysis [7], Herley et al. [10] shown that IRC markets feature all the characteristics of a typical “market for lemons” [1]: the vendor has no drawbacks in scamming the buyer because of the complete absence of a unique-ID and of a reputation system. Moreover, the buyer cannot in any way assess the quality of the good (e.g. the amount of credit available) beforehand.
In contrast, Savage et al. [16] analyzed the private messages exchanged in 6 underground forums. Most interestingly, their analysis shows that these markets feature the characteristics typical of a regular market: sellers do re-use the same ID, the transactions are moderated, and reputation systems are in place and seem to work properly. These observations coincide with our direct exploration of the black markets. The results reported in this paper show that by buying exploit kits one buys something that might actually work: the exploits in exploit kits are actually seen in the wild.
XI Conclusion
In this paper we presented our four datasets of vulnerabilities (NVD), proof-of-concept exploits (EDB), exploits traded in the black market (EKITS), and exploits recorded in the wild(SYM). We showed that, in general, the CVSS score and its submetrics capture some interesting characteristics of the vulnerabilities whose exploits are recorded in the wild but it is not expressive enough to be used as a reliable test for exploitation (with both high sensitivity and high specificity).
Alas, the bottom-line answer to the question set out in the title of this paper is not entirely satisfactory. If we compare the results of TableXII with the risk reduction obtained by wearing safety belts in cars (43% according to Evans [6]) You should surely worry in few cases:
-
•
your vulnerability is listed by an exploit kit in the black market and have a medium-high CVSS score (61% risk reduction);
-
•
your vulnerability has a proof of concept exploit (eg in EDB), requires no authentication, can be exploited over the network and have medium complexity but high-impact (with a medium-high CVSS score) (10% risk reduction).
Unfortunately, nor CVSS subscores, nor the existence of exploits, nor the trading on the black market offer a statistically sound test for ruling out the 98% of the cases for which users at large shouldn’t worry.
Overall we can conclude that CVSS-alone rule-based policies are not economically effective: the compliance with current regulations only yields low gains in terms of actual security (i.e. 3-4% risk reduction).
A claim can be made for the databases subject of this study: using NVD, EDB (or consequently OVSDB) to assess software exploits in the wild is the wrong thing to do. Without additional attention, those databases can only be used to assess the upper hand in the race between software vendors and security researchers.
Acknowledgements
This work was partly supported by the EU-SEC-CP-SECONOMICS and MIUR-PRIN-TENACE Projects. We would like to thank Tudor Dimitras and Viet H. Nguyen for the many useful discussions. Viet actually wrote the second script used for cross-checking the SYM dataset. No statement in this paper should be interpreted as endorsed by Symantec.
References
- [1] G. A. Akerlof. The market for ”lemons”: Quality uncertainty and the market mechanism. 84:pp. 488–500, 1970.
- [2] O. Alhazmi and Y. Malaiya. Application of vulnerability discovery models to major operating systems. 57(1):14 –22, march 2008.
- [3] L. Allodi and F. Massacci. A preliminary analysis of vulnerability scores for attacks in wild. In ACM Proc. of CCS BADGERS’12, 2012.
- [4] M. Bozorgi, L. K. Saul, S. Savage, and G. M. Voelker. Beyond heuristics: learning to classify vulnerabilities and predict exploits. pages 105–114. ACM, 2010.
- [5] S. Clark, S. Frei, M. Blaze, and J. Smith. Familiarity breeds contempt: the honeymoon effect and the role of legacy code in zero-day vulnerabilities. In Proc. of ACSAC’10, pages 251–260, 2010.
- [6] L. Evans. The effectiveness of safety belts in preventing fatalities. 18(3):229–241, 1986.
- [7] J. Franklin, V. Paxson, A. Perrig, and S. Savage. An inquiry into the nature and causes of the wealth of internet miscreants. In Proc. of CCS’07, pages 375–388, 2007.
- [8] S. Frei, M. May, U. Fiedler, and B. Plattner. Large-scale vulnerability analysis. In Proc. of LSAD’06, pages 131–138. ACM, 2006.
- [9] L. Gallon. Vulnerability discrimination using cvss framework. In Proc. of NTMS’11, pages 1–6, 2011.
- [10] C. Herley and D. Florencio. Nobody sells gold for the price of silver: Dishonesty, uncertainty and the underground economy. Springer Econ. of Inf. Sec. and Priv., 2010.
- [11] M. Howard, J. Pincus, and J. Wing. Measuring relative attack surfaces. pages 109–137, 2005.
- [12] F. Massacci, S. Neuhaus, and V. Nguyen. After-life vulnerabilities: A study on firefox evolution, its vulnerabilities, and fixes. In Proc. of ESSoS’11, pages 195–208, 2011.
- [13] F. Massacci and V. Nguyen. An independent validation of vulnerability discovery models. In Proc. of ASIACCS’12, 2012.
- [14] P. Mell, K. Scarfone, and S. Romanosky. A complete guide to the common vulnerability scoring system version 2.0. Technical report, FIRST, Available at http://www.first.org/cvss, 2007.
- [15] C. Miller. The legitimate vulnerability market: Inside the secretive world of 0-day exploit sales. 2007.
- [16] M. Motoyama, D. McCoy, S. Savage, and G. M. Voelker. An analysis of underground forums. In Proc. of IMC’11, 2011.
- [17] A. Ozment. The likelihood of vulnerability rediscovery and the social utility of vulnerability hunting. 2005.
- [18] A. Ozment. Improving vulnerability discovery models. In Proc. of QoP’07, pages 6–11, 2007.
- [19] D. E. Perry, A. A. Porter, and L. G. Votta. Empirical studies of software engineering: a roadmap. In Proc. of ICSE’00, pages 345–355. ACM, 2000.
- [20] S. D. Quinn, K. A. Scarfone, M. Barrett, and C. S. Johnson. Sp 800-117. guide to adopting and using the security content automation protocol (scap) version 1.0. Technical report, 2010.
- [21] R Core Team. R: A Language and Environment for Statistical Computing. R Foundation for Statistical Computing, Vienna, Austria, 2012. ISBN 3-900051-07-0.
- [22] K. Scarfone and P. Mell. An analysis of cvss version 2 vulnerability scoring. In Proc. of ESEM’09, pages 516–525, 2009.
- [23] G. Schryen. Is open source security a myth? Commun. ACM, 54, 2011.
- [24] M. Shahzad, M. Z. Shafiq, and A. X. Liu. A large scale exploratory analysis of software vulnerability life cycles. In Proc. of ICSE’12, pages 771–781. IEEE Press, 2012.
- [25] L. Wang, T. Islam, T. Long, A. Singhal, and S. Jajodia. An attack graph-based probabilistic security metric. In Proc. of DAS’08, volume 5094, pages 283–296. 2008.
In this Appendix we report the full set of results from the bootstrapped random sampling described in Section VII.
The resulting Table XIII reports the data for four “primary” controls, namely censorYr, censorSw, checkYr, checkSw five “supplementary” controls, namely nvd, edb, ekits, edbNOekits, nvdNOekitsNOedb. This gives us experiments to report. A fifth “primary” control is always active: the CIA CVSS assessment of the vulnerability. The remaining four ”primary” control variables are as follows:
-
•
censorYr: only CVEs disclosed in the years 2009,2010,2011,2012 are considered in the study.
-
•
censorSw: only CVEs affecting software also included in SYM are considered. This assures that our samples include only software monitored by Symantec.
-
•
checkYr: for each CVE in SYM another is picked for inclusion in the sample that has the exact same year as the one in SYM. This is different from censorYr as in that case the only constraint is that the chosen vulnerability lays in the 2009-2012 time range.
-
•
checkSw: each CVE picked for the sample has exactly one counterpart, software-wise, in SYM.
The five “supplementary” controls are as follows:
-
•
nvd: the vulnerability has been disclosed (i.e. we consider every vulnerability).
-
•
edb: the vulnerability has a proof-of-concept exploit in EDB.
-
•
ekits: an exploit is reported to be traded in the black markets for that vulnerability.
-
•
edbNOekits: the vulnerability has a proof-of-concept exploit and does not have an exploit traded in the black markets
-
•
nvdNOekitsNOedb: the vulnerability is only disclosed, but has no proof-of-concept or exploit traded in the black markets.
The last two “supplementary” controls are in particular useful to measure the decrease in risk of a particular patching policy after having applied another one. For example, if one knows that patching all HIGH score vulnerabilities in EKITS yelds a 60% risk reduction, by patching the remaining vulnerabilities with a proof-of-concept exploit in EDB his/her risk would decrease by only an additional 10%. With NVD, finally, the extra step in risk reduction is of 3%.
Sensitivity, specificity and risk reduction are calculated on the median of the results obtained from the bootstrapping. Additionally, we report the 95% confidence intervals (C.I.) for these measures. The last column of the table reports the median p-value of the results: the reported p-value is the value under which 50% of our samples are. This gives an indication of the statistical significance for the particular combination of “primary” and “supplementary” control variables. We remember the reader that a value lower than 0.05 is considered to be the limit for statistical significance.
First be noted, because of the limited size of EKITS, it may happen that a particular set of control variables leads to both variables in a row in the latin square (see Table X) to be zero. In these cases the risk reduction cannot be computed because the probability for that row cannot be calculated. Interestingly, the “checkSw” control seems to introduce a lot of statistical noise in the data: when this flag is activated, the statistical significance of the samples decreases sensibly. This may be because the “software” attribute may not be a good control variable as-is. For example, consider a vulnerability for Webkit, an HTML engine used in many browsers. This vulnerability may affect not only Webkit, but also Safari, Chrome or Opera that use it as a rendering engine. A different categorisation for software may therefore make sense to enforce. For example, the Webkit vulnerability may be included in a macro-category of Browser vulnerabilities from which to sample a corresponding control vulnerability.
While the considerations for sensitivity and specificity of the CVSS score remain substantially the same regardless of the control variables, the results for the risk reduction column can vary. In particular, by looking at the risk reduction confidence intervals, the risk reduction in some cases, for NVD, may even be negative. In these cases it means that patching HIGH or MEDIUM CVSS score vulnerabilities would make no sense at all, as it would be more likely to be attacked by a LOW score vulnerability. EDB performs particularly well when the controls “checkYr” and “checkSw” are activated, achieving a maximum of 46% risk reduction. The results in risk reduction for the CVSS test plus EKITS remain very positive, ranging from +55% to +80% with high or good statistical significance. When considering only “exclusive” vulnerabilities (i.e. edbNOekits, nvdNOedbNOekits) figures become slightly lower. This is because, in this case, we are excluding from the sample the vulnerabilities from EKITS and EDB+EKITS that have already been considered for patching (as patching twice the same vulnerability would not provide any additional reduction in risk).
| db | censorYr | censorSw | checkYr | checkSw | HvM+Sym | L+Sym | HvM+NotSym | L+NotSym | Sens. | 95% C.I. | Spec. | 95% C.I. | Risk red. | 95% C.I. | p-value |
|---|---|---|---|---|---|---|---|---|---|---|---|---|---|---|---|
| nvd | 48 | 4 | 912 | 285 | 91.89% | 84.21-98.11 | 23.82% | 22.53-25.02 | 3.54% | 1.6-5.28 | ** | ||||
| edb | 104 | 3 | 774 | 232 | 97.17% | 94.34-100 | 23.09% | 21.94-24.33 | 10.51% | 8.39-12.64 | *** | ||||
| ekits | 76 | 2 | 17 | 8 | 97.44% | 97.44-97.44 | 32.00% | 32-32 | 61.72% | 61.72-61.72 | *** | ||||
| edbNOekits | 88 | 3 | 788 | 231 | 96.77% | 93.46-100 | 22.73% | 21.58-23.99 | 8.79% | 6.54-10.74 | *** | ||||
| nvdNOekitsNOedb | 35 | 4 | 905 | 301.5 | 88.89% | 78.12-97.62 | 25.03% | 23.77-26.22 | 2.27% | 0.36-3.96 | |||||
| nvd | 43 | 2 | 891 | 265.5 | 94.87% | 86.48-100 | 22.98% | 21.94-23.8 | 3.59% | 1.71-5.11 | ** | ||||
| edb | 88 | 1 | 648 | 204 | 98.98% | 97.7-100 | 23.95% | 22.67-25.15 | 11.77% | 10.13-13.31 | *** | ||||
| ekits | 40 | 0 | 10 | 3 | 100.00% | 100-100 | 23.08% | 23.08-23.08 | 80.00% | 80-80 | * | ||||
| edbNOekits | 71 | 0 | 657 | 204 | 100.00% | 97.22-100 | 23.71% | 22.58-24.83 | 9.41% | 8.15-10.85 | *** | ||||
| nvdNOekitsNOedb | 26 | 2 | 880 | 277 | 91.37% | 78.94-100 | 23.99% | 22.79-25.17 | 1.97% | 0.3-3.39 | |||||
| nvd | 125 | 17 | 762 | 299 | 87.99% | 82.58-92.48 | 28.17% | 26.73-29.81 | 8.53% | 5.32-11.72 | *** | ||||
| edb | 251 | 15 | 332 | 133 | 94.47% | 93.18-95.85 | 28.63% | 26.95-30.59 | 33.06% | 30.36-36.72 | *** | ||||
| ekits | 76 | 2 | 14 | 6 | 97.44% | 97.44-97.44 | 30.00% | 30-30 | 59.44% | 59.44-59.44 | *** | ||||
| edbNOekits | 219 | 15 | 341 | 134 | 93.78% | 92.24-95.58 | 28.14% | 26.35-29.81 | 29.28% | 25.67-33.07 | *** | ||||
| nvdNOekitsNOedb | 85 | 18 | 786 | 307 | 82.35% | 75.51-88.61 | 28.03% | 26.45-29.52 | 4.20% | 0.95-7.09 | * | ||||
| nvd | 87 | 10 | 716.5 | 247 | 89.50% | 83.67-94.57 | 25.65% | 24.48-26.95 | 6.87% | 3.87-9.67 | *** | ||||
| edb | 134 | 2 | 165 | 74 | 98.53% | 98.45-98.59 | 30.92% | 29.13-32.75 | 42.18% | 40.34-43.98 | *** | ||||
| ekits | 40 | 0 | 10 | 3 | 100.00% | 100-100 | 23.08% | 23.08-23.08 | 80.00% | 80-80 | * | ||||
| edbNOekits | 106 | 2 | 166 | 74 | 98.15% | 98.04-98.23 | 30.83% | 29.1-32.53 | 36.34% | 34.52-37.67 | *** | ||||
| nvdNOekitsNOedb | 50 | 10 | 734 | 249 | 83.33% | 74.99-91.24 | 25.32% | 24.14-26.49 | 2.55% | -0.09-4.89 | |||||
| nvd | 62 | 12 | 881 | 290 | 83.54% | 76.46-91.25 | 24.72% | 23.4-26.13 | 2.53% | 0.17-5.17 | |||||
| edb | 127 | 5 | 634 | 157 | 96.34% | 94.07-98.55 | 19.81% | 18.58-21.03 | 13.81% | 11-16.62 | *** | ||||
| ekits | 76 | 2 | 17 | 7 | 97.44% | 97.4-97.44 | 29.17% | 29.17-30.43 | 59.50% | 59.3-60 | *** | ||||
| edbNOekits | 111 | 5 | 646 | 156 | 96.06% | 93.33-98.28 | 19.51% | 18.32-20.78 | 11.87% | 9.11-14.29 | *** | ||||
| nvdNOekitsNOedb | 46 | 13 | 881 | 298 | 78.33% | 69.49-87.28 | 25.27% | 23.98-26.64 | 0.86% | -1.27-3.06 | |||||
| nvd | 21 | 2 | 285 | 48 | 91.30% | 77.78-100 | 14.50% | 13.17-15.92 | 2.78% | -3.86-8.55 | |||||
| edb | 50 | 0 | 211 | 42 | 100.00% | 97.92-100 | 16.67% | 15.06-18.18 | 18.93% | 14.73-22.85 | *** | ||||
| ekits | 40 | 0 | 10 | 3 | 100.00% | 100-100 | 23.08% | 23.08-25 | 80.00% | 79.59-81.63 | * | ||||
| edbNOekits | 41 | 0 | 218 | 42 | 100.00% | 97.43-100 | 16.23% | 14.84-17.69 | 15.46% | 11.95-19.07 | ** | ||||
| nvdNOekitsNOedb | 13 | 2 | 288.5 | 50 | 85.71% | 64.29-100 | 14.72% | 13.29-16.22 | 0.16% | -6.2-4.99 | |||||
| nvd | 153 | 31 | 719 | 288 | 83.14% | 78.36-87.64 | 28.57% | 26.99-30.12 | 7.77% | 4.34-11.1 | *** | ||||
| edb | 245 | 15 | 291 | 94 | 94.40% | 93.2-95.87 | 24.42% | 22.25-26.43 | 32.30% | 28.24-37.09 | *** | ||||
| ekits | 76 | 2 | 14 | 5 | 97.44% | 97.4-97.44 | 26.32% | 26.32-27.78 | 55.87% | 55.7-56.66 | ** | ||||
| edbNOekits | 215 | 15 | 300 | 94 | 93.69% | 92.14-95.07 | 23.88% | 21.88-25.71 | 28.43% | 24.62-32.12 | *** | ||||
| nvdNOekitsNOedb | 108 | 32 | 744 | 295 | 77.29% | 71.64-82.86 | 28.38% | 26.83-29.91 | 2.91% | -0.23-6.04 | |||||
| nvd | 42 | 6 | 249 | 46 | 88.24% | 80.85-95.75 | 15.66% | 13.79-17.55 | 3.36% | -4.99-11.57 | |||||
| edb | 93 | 2 | 104 | 25 | 97.92% | 97.67-99 | 19.20% | 16.42-22.05 | 40.11% | 35.67-45.89 | *** | ||||
| ekits | 40 | 0 | 10 | 3 | 100.00% | 100-100 | 23.08% | 23.08-25 | 80.00% | 79.59-81.63 | * | ||||
| edbNOekits | 76 | 2 | 109 | 25 | 97.50% | 97.1-98.77 | 18.32% | 16.03-21.05 | 34.15% | 29.7-39.06 | *** | ||||
| nvdNOekitsNOedb | 25 | 6 | 262 | 47 | 81.82% | 66.67-92.87 | 15.21% | 13.31-17.04 | -1.96% | -11.33-5.62 | |||||
| nvd | 400 | 130.5 | 522 | 150 | 75.42% | 73.45-77.06 | 22.32% | 20.32-24.15 | -3.13% | -7.81-0.91 | |||||
| edb | 288 | 19 | 175 | 40 | 93.87% | 93.07-94.9 | 18.78% | 16.74-20.8 | 30.59% | 25.83-36.56 | *** | ||||
| ekits | 71 | 2 | 10 | 1 | 97.26% | 97.1-97.37 | 9.09% | 7.69-11.11 | 20.83% | 18.33-23.21 | |||||
| edbNOekits | 246 | 19 | 179 | 41 | 92.91% | 92.07-93.94 | 18.50% | 16.66-20.39 | 26.35% | 21.66-31.28 | *** | ||||
| nvdNOekitsNOedb | 265 | 131 | 546 | 155 | 67.01% | 65.05-69.23 | 22.14% | 20.14-24.02 | -13.02% | -17.15–8.73 | *** | ||||
| nvd | 124 | 29 | 277 | 27 | 81.21% | 77.77-84.11 | 8.99% | 7.21-10.7 | -20.45% | -30.17–11.51 | ** | ||||
| edb | 124 | 2 | 61 | 4.5 | 98.41% | 98.32-98.5 | 6.90% | 5.63-8.33 | 35.90% | 31.07-41.14 | |||||
| ekits | 37 | 0 | 8 | 0 | 100.00% | 100-100 | 0.00% | NA | NA | NA | |||||
| edbNOekits | 98 | 2 | 62 | 5 | 98.00% | 97.89-98.1 | 7.25% | 5.71-8.2 | 31.55% | 25.41-35.63 | |||||
| nvdNOekitsNOedb | 67 | 28 | 296 | 28 | 70.30% | 64.13-74.51 | 8.61% | 6.71-10.26 | -31.76% | -41.83–23.8 | *** | ||||
| nvd | 400 | 131 | 520 | 150 | 75.33% | 73.6-77.03 | 22.27% | 20.35-24.28 | -3.29% | -7.67-1.35 | |||||
| edb | 288 | 19 | 175 | 40 | 93.92% | 93.05-94.77 | 18.78% | 16.67-20.74 | 30.64% | 25.5-35.38 | *** | ||||
| ekits | 70 | 2 | 11 | 1 | 97.22% | 97.1-97.37 | 8.33% | 7.69-11.11 | 20.24% | 18.14-22.54 | |||||
| edbNOekits | 247 | 19 | 178 | 41 | 92.91% | 91.92-94.01 | 18.55% | 16.74-20.72 | 26.41% | 20.92-31.43 | *** | ||||
| nvdNOekitsNOedb | 265 | 131 | 548 | 155 | 66.92% | 64.56-69.14 | 22.13% | 20.12-23.99 | -13.19% | -17.82–8.82 | *** | ||||
| nvd | 123 | 29 | 276 | 27 | 80.95% | 78.18-83.87 | 9.02% | 7.35-10.86 | -20.34% | -29.76–12.79 | ** | ||||
| edb | 123 | 2 | 61 | 5 | 98.40% | 98.31-98.48 | 6.81% | 5.63-8.34 | 35.72% | 30.55-41.49 | |||||
| ekits | 37 | 0 | 8 | 0 | 100.00% | 100-100 | 0.00% | NA | NA | NA | |||||
| edbNOekits | 98 | 2 | 62 | 4 | 98.00% | 97.87-98.11 | 6.50% | 5.63-8.2 | 30.10% | 25.31-36.17 | |||||
| nvdNOekitsNOedb | 68 | 29 | 296 | 28 | 70.05% | 65.05-74.75 | 8.67% | 6.89-10.48 | -31.90% | -41.18–23.12 | *** | ||||
| nvd | 577 | 180 | 345 | 91 | 76.19% | 75.03-77.36 | 20.94% | 18.53-23.46 | -3.66% | -7.98-0.76 | |||||
| edb | 316 | 20 | 86 | 14 | 94.03% | 93.49-94.64 | 13.74% | 11.34-16.33 | 19.29% | 13.18-25.65 | * | ||||
| ekits | 70 | 2 | 7 | 1 | 97.22% | 97.06-97.33 | 12.50% | 9.09-20 | 24.12% | 20.51-27.86 | |||||
| edbNOekits | 270 | 20 | 88 | 14 | 93.03% | 92.41-93.66 | 13.73% | 11.65-16.35 | 16.17% | 11.04-22.63 | |||||
| nvdNOekitsNOedb | 375 | 180.5 | 376 | 96 | 67.56% | 65.99-68.89 | 20.25% | 18.3-22.3 | -15.29% | -19.43–11.41 | *** | ||||
| nvd | 134 | 32 | 147 | 16 | 80.59% | 78.02-83.23 | 9.82% | 7.14-12.42 | -19.10% | -28.67–10.07 | * | ||||
| edb | 118 | 2 | 37 | 2 | 98.33% | 98.25-98.43 | 5.13% | 4.55-6.06 | 25.99% | 22.73-29.74 | |||||
| ekits | 34 | 0 | 6 | 0 | 100.00% | 100-100 | 0.00% | 0-0 | NA | NA | |||||
| edbNOekits | 96 | 2 | 39 | 2 | 97.96% | 97.83-98.06 | 4.88% | 4.44-5.56 | 21.22% | 17.91-24.63 | |||||
| nvdNOekitsNOedb | 74 | 33 | 163 | 16 | 69.52% | 65.34-73.59 | 8.94% | 6.39-11.56 | -35.79% | -45.5–26.2 | *** | ||||
| nvd | 578 | 180 | 345 | 91 | 76.22% | 75.06-77.39 | 20.86% | 18.62-23.27 | -3.85% | -8.02-0.31 | |||||
| edb | 316 | 20 | 86 | 14 | 94.05% | 93.47-94.64 | 13.99% | 11.34-16.5 | 19.40% | 13.26-25.78 | * | ||||
| ekits | 70 | 2 | 7 | 1 | 97.22% | 97.06-97.33 | 12.50% | 10-16.67 | 24.06% | 21.17-26.92 | |||||
| edbNOekits | 270 | 20 | 87 | 14 | 92.98% | 92.36-93.64 | 13.86% | 11.65-16.16 | 16.32% | 10.48-21.76 | * | ||||
| nvdNOekitsNOedb | 376 | 180 | 376 | 96 | 67.62% | 65.94-69.12 | 20.40% | 18.06-22.74 | -15.18% | -19.57–10.75 | *** | ||||
| nvd | 135 | 32 | 147 | 16 | 80.62% | 78.23-83.33 | 9.66% | 6.83-12.26 | -19.37% | -28.97–9.98 | * | ||||
| edb | 119 | 2 | 37 | 2 | 98.35% | 98.25-98.43 | 5.13% | 4.55-5.88 | 25.97% | 22.72-29.23 | |||||
| ekits | 35 | 0 | 6 | 0 | 100.00% | 100-100 | 0.00% | 0-0 | NA | NA | |||||
| edbNOekits | 96 | 2 | 39 | 2 | 97.96% | 97.85-98.08 | 4.88% | 4.44-5.56 | 21.32% | 17.94-24.44 | |||||
| nvdNOekitsNOedb | 74 | 32 | 163 | 16 | 69.44% | 65.04-73.69 | 8.81% | 6.59-11.17 | -36.00% | -46.05–26.12 | *** |