Formation of the density wave energy gap in Na2Ti2Sb2O: an optical spectroscopy study
Abstract
We performed optical spectroscopy measurement on single crystals of Na2Ti2Sb2O, which is the parent compound for the newly discovered Ti-based superconductors. The study reveals significant spectral change across the phase transition at 114 K and formation of a density-wave type energy gap. The opening of the gap removes most part of the free carrier spectral weight and causes a dramatic reduction of the carrier scattering rate. The ratio of 214 is considerably larger than the mean-field value based on the weak-coupling BCS theory. The study also reveals a weak correlation effect in the titanium oxypnictides.
pacs:
74.25.Gz, 74.25.Jb, 74.70.-bCharge- or spin-density waves (CDW/SDW) and superconductivity are different collective quantum phenomena in solids. The interplay between density wave and superconductivity has generated considerable interest in condensed matter physics. A recent example is the iron-based superconductors where superconductivity emerges from the suppression of the SDW instability Dong ; Cruz . It is widely believed that the superconductivity is mediated dominantly by the spin fluctuations. The repulsive pairing interaction between the quasi-nested electron and hole Fermi surfaces (FSs) leads to unconventional superconductivity with a sign-changing (s±-wave) pairing symmetry Mazin ; Scalapino .
Very recently, superconductivity in a titanium oxypnictide system Ba1-xNaxTi2Sb2O has been reported Yajima ; Doan . The undoped compound BaTi2Sb2O shows a superconducting transition at Tc=1.2 K Yajima . With Na doping, Tc increases to 5.5 K Doan . Although the Tc is very low, the system attracts much attention because it shares a number of similarities to the Fe-based superconductors. The compounds belong to a family with two-dimensional (2D) layered structures, consisting of alternative stacking of conducting octahedral layers Ti2Pn2O (Pn=As, Sb) and other insulating layers (e.g. Na2, Ba, (SrF)2, (SmO)2) (see inset of Fig. 1) Adam ; Axtell ; Ozawa1 ; Ozawa2 ; Ozawa3 ; Ozawa4 ; Liu1 ; Wang ; Liu2 ; Zhai . Most notably, the compounds also show competing phenomenon. The undoped compounds commonly show phase transitions below certain temperatures. The earliest reported compound Adam in this family, Na2Ti2Sb2O, shows a phase transition at Ts=114 K as characterized by a sharp jump in resistivity and a drop in spin susceptibility Ozawa1 . Similar phase transitions at higher temperatures were also found in the related compounds Na2Ti2As2O (Ts=320 K) Axtell ; Ozawa1 ; Ozawa2 ; Ozawa3 ; Liu1 , BaTi2As2O (Ts=200 K) Wang and R2Ti2Pn2O (R=(Sr,F), (Sm,O); Pn=As, Sb; Ts=198-380 K) Liu2 . In fact, the superconducting BaTi2Sb2O also exhibits such a phase transition but at lower temperature Ts=45 K Yajima . This transition temperature is further suppressed upon Na doping, by contrast the superconductivity is enhanced Doan .
The microscopic mechanism for this phase transition has not been determined, but it has been suggested to arise from the SDW or CDW instability driven by the strong nested electron and hole Fermi surfaces Pickett ; Biani ; Singh ; Yan ; Subedi . In particular, a bicollinear or blocked checkerboard antiferromagnetic ordering patterns have been predicted for the SDW ordered state for Na2Ti2Pn2O (Pn=As, Sb) from the first principle calculations Yan . The presence of nested electron and hole pockets and the antiferromagnetic instability would imply a sign-changing s-wave symmetry in the superconducting titanium oxypnictides Singh , similar to the Fe-based superconductors.
It is crucial to understand the origin of the phase transition in the undoped compound because it is the essential step towards understanding the mechanism of superconductivity in doped systems. Up to now, there is no spectroscopic experiment performed on those compounds. It is well known that, in the density wave state (either CDW or SDW), the formation of electron-hole pairs with a nesting wave vector connecting different regions of FSs would lead to the opening of an energy gap DresselGruner . This is a fundamental quantum phenomenon in solids, and by that means, the system of interacting electrons can stabilize a broken symmetry ground state. The precise measurement of the energy gap permits a meaningful comparison to microscopic theories.
In this work we present optical spectroscopic study on Na2Ti2Sb2O, which is a sister compound to BaTi2Sb2O. Above the phase transition at 114 K, Na2Ti2Sb2O is quite metallic with rather high plasma frequency, 20000 cm-1 (2.5 eV). Below the transition, formation of density wave energy gap is clearly observed, leading to the removal of most part of Drude component. Nevertheless, the FSs are only partially gapped because residual itinerant carriers were still left. The residual Drude component becomes rather narrow and sharp, indicating a dramatic reduction of the carrier scattering rate. Our study reveals the ratio of 2 14, a value being considerably larger than the mean-field value based on the weak-coupling BCS theory for a density wave phase transition. Furthermore, the study also reveals weak correlation effect in the compound.
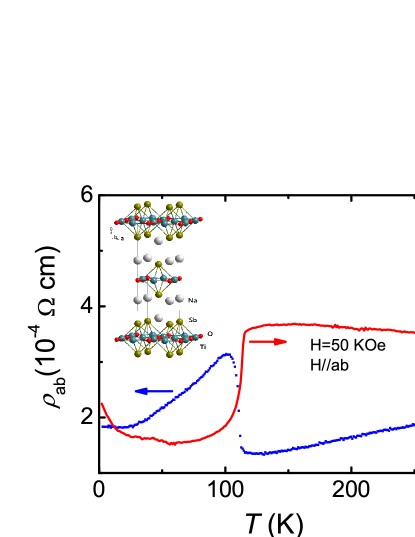
Plate-like single crystals of Na2Ti2Sb2O with size up to 33 mm2 were grown from the NaSb flux method. Figure 1 shows the in-plane resistivity and magnetic susceptibility measured in Quantum Design PPMS and SQUID-VSM, respectively. The resistivity shows metallic behavior at high temperature. A sharp upturn appears near 114 K. Then, metallic temperature dependence is still observed at low temperature. At the transition, the susceptibility shows a sharp reduction. A small upturn at low temperatures could be attributed to the presence of defects in the crystals. A detailed description of growth and characterization of single crystals in this family would be reported elsewhere Shi .
The optical reflectance measurements were performed on a combination of Bruker IFS 80v/s and 113v spectrometers in the frequency range from 20 to 40000 cm-1. An in situ gold and aluminium overcoating technique was used to get the reflectivity R(). The real part of conductivity is obtained by the Kramers-Kronig transformation of R().
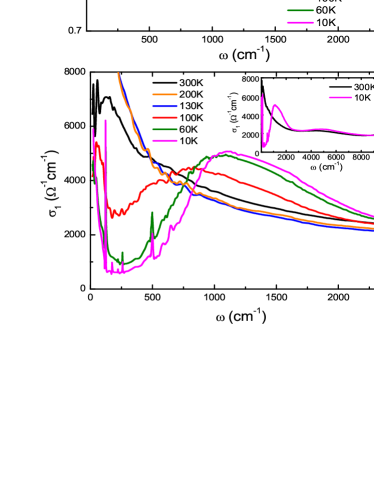
Figure 2 shows the low frequency R() (upper panel) and (lower panel) up to 2500 cm-1 . The insets show the spectra over broad frequency region up to 10000 cm-1 . R() exhibits metallic response in both frequency and temperature dependences above the phase transition. R() displays roughly a linear- dependence and approaches to unity at zero frequency. It also increases with decreasing temperature. The most prominent feature is a substantial suppression in R() for TTs, which is a strong optical evidence for the formation of an energy gap. The low- reflectance increases faster towards unity at zero frequency than those at high T. As a consequence, one can see a rather sharp low- reflectance edge. This indicates clearly that the Fermi surfaces are only partially gapped and the compounds are still metallic below Ts. The change of R() from an overdamped linear- dependent behavior to a well-defined reflectance edge upon cooling the sample into the ordered state immediately suggests a dramatic reduction of the carrier scattering rate, while its low-energy location implies a considerable reduction of carrier density. Besides the change in the electronic spectrum, five phonon modes at 123, 175, 222, 260, 500 cm-1 emerge in R() at low T. This is due to the substantially reduced screening effect caused by the reduction of itinerant carriers.
The evolution of the electronic states is more clearly reflected in the conductivity spectra. At high temperatures, broad Drude-like features are observed in ). Below Ts, the spectra at low frequencies are severely suppressed. The suppressed spectral weight is transferred mostly to the region above the gap, resulting in a pronounced peak structure near 1100 cm-1 . Associated with the low- reflectance edge, a very sharp and narrow Drude component emerges below this peak. The data show more clearly the partial gapping of the FSs. It is known that the hallmark of a symmetry-broken phase transition, such as superconductivity or density wave order, is the formation of an energy gap near the Fermi level EF, resulting in the lowering of the total energy of the system. However, due to different coherent factors (case I for density wave and case II for superconductivity) DresselGruner , the characteristic energy gap features of superconductivity and density wave orders are different in optical conductivity. In an s-wave superconducting state at , the absorption smoothly rises at the gap frequency and gradually merges to the conductivity spectrum at high frequency, while for a density wave order, the opening of an energy gap leads to a pronounced peak just above the energy gap in DresselGruner ; Degiorgi ; Hu . The observation of a characteristic peak structure above the gap yields optical evidence for a density wave type phase transition.
A notable point is that the gap size at the lowest measurement temperature (10 K), which could be identified as the peak position at 1100 cm-1 , is surprisingly large. The ratio of the energy gap relative to the transition temperature 2 is about 14, a value being much larger than the BCS mean field value of 3.5 for a density wave phase transition DresselGruner . This means that the transition temperature is significantly lower than the mean field transition temperature. The reason is unclear. It might be due to highly two-dimensional electronic structure which leads to strong fluctuation effect and suppresses the actual ordering temperature. Similar gap ratios were also observed in other low-dimensional density wave materials, e.g. (TaSe4)2I DresselGruner . Nevertheless, further studies is necessary to resolve this issue.
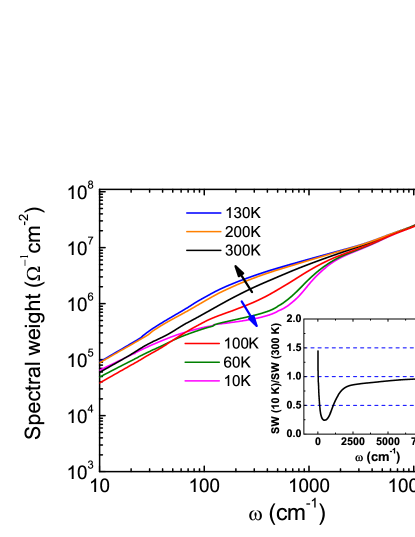
The above mentioned spectral weight transfer is also seen clearly in the spectral weight plot shown in Fig. 3. The spectral weight is defined as SW=, where is a cut-off frequency. Above the phase transition, the low- spectral weight increases with decreasing temperature due to the narrowing of the Drude component, however, below , the spectral weight is severely suppressed below 1100 cm-1 owing to the formation of energy gap. The inset shows the plot of the normalized spectra SW(10 K)/SW(300 K). At low-frequency, SW(10 K)/SW(300 K) is somewhat higher than unity, then drops sharply with increasing frequency. This is due to the presence of sharp residual Drude component at 10 K. The normalized spectral weight reaches a minimum near 500 cm-1 , then recovers quickly at higher frequencies. It can be ascribed to the density wave energy gap formation, resulting in a transfer of the spectral weight to the region just above the energy gap. The small spectral weight recovery at higher energy scale above 3000 cm-1 could be attributed to the weak temperature dependent interband transitions. Those interband transitions would involve the bands across the Fermi level. Due to the effect of temperature-dependent Fermi distribution function, the electron occupations near the Fermi level on those bands could show a small change at different temperatures.
To quantitatively characterize the spectral change, particularly the evolution of the Drude part, across the phase transition, we decompose the optical conductivity spectral into different components using a Drude-Lorentz analysis. The dielectric function has the form Hu
| (1) |
where is the dielectric constant at high energy, and the middle and last terms are the Drude and Lorentz components, respectively. The Drude components represent the contribution from itinerant electrons, while the Lorentz components describe the excitations across the gap and interband transitions. It is found that, in order to reproduce the low- conductivity reasonably well, two Drude components, a narrow one and a broad one, have to be used. Since the compound has multiple FSs, the inclusion of two Drude-components appears to be natural. The broad Drude component takes most part of the spectral weight of the itinerant electrons, while the narrow one only occupies a small fraction of this spectral weight.
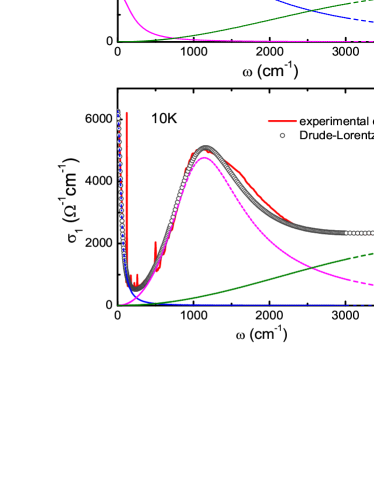
Figure 4 shows the at 300 K and 10 K together with the Drude-Lorentz fitting components. Interestingly, we find that, in the ordered state below Ts, the gapping of the FSs mainly removes the spectral weight of the broad Drude component. There is a little change for the spectral weight of narrow Drude component, but its width is significantly reduced. The results suggest that the gapping of the FSs caused by the density wave phase transition mainly occurs on those FSs where the electrons experience stronger scattering. In the mean time, due to the removal of those FSs, the electrons in the residual FSs become further less scattered.
Since two Drude components contribute to the conductivity, the overall plasma frequency could be calculated as =(+)1/2. Then, we get 20000 cm-1 (2.5 eV) for all measurement temperatures above Ts. This value is dramatically reduced in the ordered state. At 10 K, only a very narrow Drude component is left, leading to 4300 cm-1 (0.53 eV). The overall plasma frequency could also be estimated by summarizing the low- spectral weight, =8. The integration up to should cover all the spectrum contributed by the free carriers but still below the inter-band transition. For , we take =3000 cm-1 where we expect that there is a balance between the Drude component tail and the onset part of the interband transition. Then, we also get 20000 cm-1 . The spectral weight of the Drude component in the low-T ordered state could be more accurately determined because it separates distinctly from the remaining part in the conductivity spectra. For example, we take =220 cm-1 at T=10 K, which leads to 4300 cm-1 . Therefore, we get essentially the same values of overall plasma frequencies as from Drude-Lorentz analysis. Since, effectively, the square of the plasma frequency is proportional to n/meff (where n is the carrier density, meff is the effective mass), if assuming that the effective mass of itinerant carriers would not change with temperature, then the residual carrier density is only 4.6 of that at high temperature. This means that roughly over 95 of FSs are removed associated with the density wave phase transition.
Determination of the plasma frequency helps to elucidate the correlation effect by comparison with the result from band theory calculations. Within a single-band tight binding model, the kinetic energy energy of the electrons is proportional to the square of the plasma frequency. Then, the ratio of the experimental kinetic energy and the theoretical kinetic energy from band structure calculations could be calculated from the plasma frequencies determined respectively by experiments and band structure calculations, Kexp/Kband=. It provides a measure for the band renormalizations from the correlation effect Qazilbash ; Qimiao . Kexp/Kband is close to unity for a simple metal, but is reduced to zero for a strongly correlated Mott insulator. The band structural calculations give the ab-plane plasma frequency of 3.0 eV in the paramagnetic phase Pickett . Then we can estimate that, Kexp/Kband= 0.7. In Fe-pnictides, the value of this ratio is close to 0.4 Qazilbash ; Qimiao ; ZGChen . Therefore, the obtained value suggests that the correlation effect in Na2Ti2Sb2O is substantially weaker than iron-pnictides.
The present work firmly establishes the density wave origin for the phase transition in the titanium oxypnictide Na2Ti2Sb2O. However, we can not distinguish whether the ordered state is a CDW or an SDW order for the reason that both broken symmetry states have the same coherent factor. Since both orders have been predicted by the density function calculations on BaTi2Sb2O and related compounds Pickett ; Biani ; Singh ; Yan ; Subedi , it is crucial to determine the order experimentally. The earlier neutron diffraction measurement on Na2Ti2Sb2O did not reveal a magnetic order at low T Ozawa1 . However, there is a possibility that the ordered moment is very small and below the resolution limit of the measurement. The magnetic susceptibility data displayed in Fig. 1 show relatively large values at high T and sharp drop at transition which seems to favor an SDW origin. Nevertheless, more sensitive experimental probes, for example, SR, should be used to detect any possible magnetic order in the compounds. The issue is related to the pairing mechanism for the superconducting samples in the family. The SDW origin of the instability would favor an unconventional superconductivity with sign-changing s-wave pairing, while the CDW origin would suggest more conventional superconductivity with simple s-wave pairing.
To summarize, the ab-plane optical measurements of Na2Ti2Sb2O single crystals were performed. The study revealed dramatic spectral change across the phase transition at 114 K and formation of a density-wave energy gap at low T. The opening of the gap removes most part of the free carrier spectral weight and causes a substantial reduction of the carrier scattering rate. The ratio of 214 well exceeds the weak-coupling BCS value of 3.52, suggesting that the transition temperature is significantly lower than the mean-field transition temperature. The study also revealed a weak correlation effect in the titanium oxypnictides.
Acknowledgements.
We acknowledge helpful discussions with X. H. Chen, Z. Y. Lu, J. L. Luo and Q. M. Si. This work was supported by the National Science Foundation of China, and the 973 project of the Ministry of Science and Technology of China (2011CB921701,2012CB821403).References
- (1) J. Dong, H. J. Zhang, G. Xu, Z. Li, G. Li, W. Z. Hu, D. Wu, G. F. Chen, X. Dai, J. L. Luo, Z. Fang, and N. L. Wang, Europhys. Lett. 83, 27006 (2008).
- (2) Clarina de la Cruz, Q. Huang, J. W. Lynn, Jiying Li, W. Ratcliff II, J. L. Zarestky, H. A. Mook, G. F. Chen, J. L. Luo, N. L. Wang, and Pengcheng Dai, Nature 453, 899 (2008).
- (3) I. I. Mazin, D. J. Singh, M. D. Johannes, and M. H. Du, Phys. Rev. Lett. 101, 057003 (2008).
- (4) D. J. Scalapino, Rev. Mod. Phys. 84, 1383 (2012).
- (5) T. Yajima, K. Nakano, F. Takeiri, T. Ono, Y. Hosokoshi, Y. Matsushita, J. Heister, Y. Kobayashi, and H. Kageyama, J. Phys. Soc. Jpn. 81, 103706 (2012).
- (6) P. Doan, M. Gooch, Z. Tang, B. Lorenz, A. Moeller, J. Tapp, P. C. W. Chu, and A. M. Guloy, J. Am. Chem. Soc. 134, 16520 (2012).
- (7) A. Adam and H.-U. Schuster, Z. Anorg. Allg. Chem. 584, 150 (1990).
- (8) E. A. Axtell, III, T. Ozawa, S. M. Kauzlarich, and R. R. P. Singh, J. Solid State Chem. 134, 423 (1997).
- (9) T. C. Ozawa, T. Pantoja, E. A. Axtell, III, S. M. Kau- zlarich, J. E. Greedan, M. Bieringer, and J. W. Richardson Jr., J. Solid State Chem. 153, 275 (2000).
- (10) T. C. Ozawa, S. M. Kauzlarich, M. Bieringer, and J. E. Greedan, Chem. Mater. 13, 1804 (2001).
- (11) T. C. Ozawa and S. M. Kauzlarich, J. Cryst. Growth 265, 571 (2004).
- (12) T. C. Ozawa and S. M. Kauzlarich, Sci. Technol. Adv. Mater. 9, 033003 (2008).
- (13) R. H. Liu, D. Tan, Y. A. Song, Q. J. Li, Y. J. Yan, J. J. Ying, Y. L. Xie, X. F. Wang, and X. H. Chen, Phys. Rev. B 80, 144516 (2009).
- (14) X. F. Wang, Y. J. Yan, J. J. Ying, J. Q. Li, M. Zhang, N. Xu, X. H. Chen, J. Phys.: Condens. Matter 22, 075702 (2010).
- (15) R. H. Liu, Y. A. Song, Q. J. Li, J. J. Ying, Y. J. Yan, Y. He, and X. H. Chen, Chem. Mater. 22, 1503 (2010).
- (16) H. F. Zhai, W. H. Jiao, Y. L. Sun, J. K. Bao, H. Jiang, X. J. Yang, Z. T. Tang, Q. Tao, X. F. Xu, C. Cao, J. H. Dai, Z. A. Xu, and G. H. Cao, arXiv:1211.4548.
- (17) W. E. Pickett, Phys. Rev. B 58, 4335 (1998).
- (18) F. F. de Biani, P. Alemany, and E. Canadell: Inorg. Chem. 37, 5807 (1998).
- (19) D. J. Singh, New J. Phys. 14, 123003 (2012).
- (20) X. W. Yan and Z. Y. Lu, arXiv 1210.3481.
- (21) A. Subedi, arXiv 1210.0499.
- (22) M. Dressel and G. Grüner, ”Electrodynamics of Solids: Optical Properties of Electrons in Matter”, Cambridge University Press, (2002).
- (23) Y. G. Shi, H. P. Wang, W. D. Wang, Y. Huang, and N. L. Wang, unpublished.
- (24) L. Degiorgi et al., Phys. Rev. Lett. 76, 3838 (1996).
- (25) W. Z. Hu, J. Dong, G. Li, Z. Li, P. Zheng, G. F. Chen, J. L. Luo, and N. L. Wang, Phys. Rev. Lett. 101, 257005 (2008).
- (26) M. M. Qazilbash, J. J. Hamlin, R. E. Baumbach, Lijun Zhang, D. J. Singh, M. B. Maple, D. N. Basov, Nature Physics 5, 647 (2009).
- (27) Qimiao Si, Nature physics 5, 629 (2009).
- (28) Z. G. Chen, R. H. Yuan, T. Dong, N. L. Wang, Phys. Rev. B 81, 100502(R) (2010).