The XMM-Newton view of the radio loud narrow line Seyfert1 galaxy PMN J0948+0022
Abstract
We analysed the archival XMM-Newton data of the radio loud narrow line Seyfert1 galaxy PMN J0948+0022 in the energy range 0.3–10.0 keV. The X-ray data reveal that the spectrum in the 0.3–10.0 keV energy band is not a simple power-law as previously described in the literature. Instead it consists of a power-law with soft excess below 2.5 keV. The X-ray spectrum was fitted with four different models and it was shown the soft excess component of the spectrum in the 0.3–2.5 keV energy range could be described reasonably well within the framework of the thermal Comptonization model as well as relativistically blurred reflection model. The power-law component required to fit the spectrum beyond 2.5 keV was found to be rather hard compared to the ones observed in other unobscured active galactic nuclei. It is also shown that the Swift/XRT spectrum from the source could not reveal the soft excess component due to poor statistics. The fractional variability estimated from XMM-Newton data indicates the presence of independently varying components in the spectrum above and below 1 keV.
keywords:
extragalactic : Seyfert1 – X-ray – individual:PMN J0948+00221 Introduction
PMN J0948+0022 is a radio-loud narrow line Seyfert 1 (RLNLS1) galaxy, with cosmological redshift and radio loudness parameter , defined as the ratio of the flux at 1.4 GHz to the flux at 440 nm (Radio loudness criterion : R10) (Foschini, 2011), detected in -rays by Large Area Telescope (LAT) on board Fermi satellite (Abdo et al., 2009a, b). It is also one of the six such sources detected by Fermi /LAT in the MeV–GeV region111http://www.asdc.asi.it/fermi2lac/. Abdo et al. (2009a, b) reported the multi-wavelength observations of PMN J0948+0022 during March–July 2009, while Foschini et al. (2011) observed the source during a -ray outburst in July 2010. In both cases, the observed spectral energy distribution (SED) looks very similar to the SED of typical high power blazars, known as flat spectrum radio quasars (FSRQs). The SEDs were modeled with the synchrotron and Comptonization models developed by Ghisellini & Tavecchio (2009). For both the observations, the broadband SED were fitted with a synchrotron component for radio–to–IR/optical, a synchrotron self-Compton component for the X-rays, external Comptonization component for MeV–GeV -rays, and a thermal component from the accretion disk in the UV band. Interestingly, the fitted parameters and estimated power were found to fall in the region between the low power blazars (BL Lacs) and high power blazars (FSRQs). These derived properties are similar to those of other three Fermi observed RLNLS1 (Abdo et al., 2009a). Their analysis of the broadband SED lead to similar conclusions. But the most intriguing fact is that the estimated black hole (BH) mass and mass accretion rates for RLNLS1, in terms of Eddington rate, are very different compared to those properties of blazars. The BH mass for RLNLS1 is approximately two orders of magnitude lower than that of blazars (Foschini 2011). Secondly, the RLNLS1s accrete at near Eddington limit, while blazars accrete at much lower rate.
Here in this work, we gave a closer look at the X-ray spectrum of PMN J0948+0022 . The reason is the following. In the broadband SED modelling for PMN J0948+0022 , the X-ray component is described by synchrotron self-Compton emission process (Abdo et al., 2009a, b). The X-ray spectra of radio quiet narrow line Seyfert 1 galaxies, as observed with XMM-Newton , show the presence of soft excess in 0.3–2.0 keV energy band and a power-law component above 2.0 keV (Bian & Zhao, 2004; Boller et al., 2003; Fabian et al., 2004; Haba et al., 2008; O’Brien et al., 2001; Page et al., 2003; Dewangan et al., 2007; Gallo et al., 2013; Fabian et al., 2013). The origin of the soft excess is not properly understood yet. In fact, some radio emitting NLS1 which are not formally categorised as radio-loud, also show strong soft excess in their X-ray spectra, e.g, PKS 0558–504 (Papadakis et al., 2010; Walton et al., 2013). PKS 2004–447, another radio-loud (R = 6358) NLS1 (Foschini, 2011), also shows a strong soft excess in its X-ray spectrum (Gallo et al., 2006), although there is some doubt over the classification of this source (Oshlack et al., 2001). If the X-ray spectrum of the -ray loud RLNLS1 PMN J0948+0022 also shows the presence of a soft excess, then it is important to understand its origin. Here, we present an analysis and modelling of archival data of PMN J0948+0022 observed with XMM-Newton , Swift/XRT to show that the X-ray spectrum of the source has a complex structure, which the current Swift/XRT spectrum can not adequately describe. We also analysed the Fermi /LAT data taken over six months around the XMM-Newton observation to study the -ray emission from PMN J0948+0022 .
The paper is structured as follows. In section 2, we described the data reduction procedure for XMM-Newton , Swift/XRT and Fermi . The spectral modelling is described in section 3. Results are discussed and concluded in sections 4 and 5, respectively.
2 Data Reduction
| Mission | XMM-Newton |
| Observation ID | 0502061001 (Obs-A) |
| Start Time (UT) | 2008-04-29 15:12:02 (PN) |
| Exposure Time (ks) | 24.27 |
| Sum of good time intervals (ks) | 12.83 (PN) |
| EPIC filter | Medium |
| Mode | PrimeLargeWindow (PN) |
| Observation ID | 0673730101 (Obs-B) |
| Start Time for PN (UT) | 2011-05-28 11:50:06 |
| Start Time for MOS (UT) – M1 | 2011-05-28 11:21:36 |
| Start Time for MOS (UT) – M2 | 2011-05-28 16:20:22 |
| Start Time for MOS (UT) – M3 | 2011-05-29 00:59:12 |
| Start Time for MOS (UT) – M4 | 2011-05-29 08:34:34 |
| Start Time for MOS (UT) – M5 | 2011-05-29 10:16:19 |
| Exposure Time (ks) | 92.92 (PN); 15.82 (M1), 28.42 (M2), 24.85 (M3), 4.02 (M4), 10.14 (M5) |
| Sum of good time intervals (ks) | 88.00 (PN); 15.27 (M1), 28.32 (M2), 24.70 (M3), 4.01 (M4), 10.11 (M5) |
| EPIC filter | Medium |
| Mode | PrimeLargeWindow (PN) ; PrimePartialW3 (MOS) |
| Mission | Swift – XRT |
| Observation ID | 00031306014 |
| Start Time (UT) | 2011-05-28 01:56:57 |
| Exposure Time (ks) | 3.64 |
| Mode | Photon Counting |
| Mission | Fermi - LAT |
| Start Time (UT) | 2011-02-27 23:59:58 |
| Exposure Time (ks) | 15638.4 |
2.1 XMM-Newton observations
PMN J0948+0022 was observed by XMM-Newton telescope (Strüder et al., 2001; Turner et al., 2001) operated with Medium filter at two epochs during April, 2008 (Observation ID 0502061001, hereafter Obs-A) and May, 2011 (Observation ID 0673730101, hereafter Obs-B) for approximately 24 ks and 93 ks, respectively. The X-ray data were taken in prime partial W3 mode for EPIC-MOS detectors (MOS1 and MOS2; Turner et al. (2001)) for Obs-A and the source did not fall in the active field of view, therefore, only EPIC-PN (European Photo Imaging Camera; Strüder et al. (2001)) data were used for further analysis. For Obs-B, the observation with MOS detectors were taken in five short duration segments of 16 ks (M1), 28 ks (M2), 25 ks (M3), 4 ks (M4) and 10 ks (M5), however, the data were taken for full observation time span, i.e. 93 ks, for PN detector.
2.1.1 EPIC data
Data reduction followed standard procedures using XMM-Newton Science Analysis System software (SAS version SAS11.0.0) with updated calibration files. Event files for the MOS (for Obs-B) and the PN (for Obs-A and Obs-B) detectors were generated using the tasks Emchain and Epchain, respectively. These tasks allow calibration of the energy and the astrometry of the events registered in each CCD chip and to combine them in a single data file. Event list files were extracted using the SAS task Evselect. Data from the three cameras were individually screened for the time intervals with high background when the total count rate (for single events of energy above 10 keV) in the instruments exceed 0.35 and 1.0 for the MOS and PN detectors, respectively. Source photons were extracted from a circular region of radius 40′′ around the source position to generate the light curves and spectra. Background was estimated from four source free regions with radius of 20′′ each located on the same CCD near the source. The X-ray spectra and light curves of the source were generated using SAS task Evselect and background scaling factors have been calculated using Backscale task. The photon redistribution as well as the ancillary matrices were computed using SAS task Rmfgen and Arfgen. Finally, the PN spectra of both Obs-A and Obs-B were rebinned to have at least 150 counts per bin. In the case of ObsB, the MOS1 and MOS2 spectra from all time segments were added to generate a single spectrum using the Addspec utility. The final MOS spectrum was rebinned to have at least 130 counts per spectral bin.
2.2 Swift observations
X-ray data from X-ray telescope (XRT) on Swift (Gehrels et al., 2004) have also been analysed here in photon counting mode. These observations have been taken on the same date as for Observation ID 0673730101 from XMM-Newton , i.e., 28 May 2011. The Swift/XRT data have been reduced using the HEAsoft packages (6.12 version), including Xselect, Ximage, and Swift data analysis tools. The spectrum was generated using the XRT tool Xrtpipeline and the response matrices files (RMF) and Ancillary Response Files (ARFs) were generated using task Xrtmkarf and the Caldb version 014 (released date 25 July 2011). Finally, the spectra were grouped using the Grppha task with 30 counts per bin.
2.3 Fermi /LAT observation
The Large Area Telescope (LAT), onboard Fermi gamma-ray observatory, is a pair conversion detector (Atwood et al., 2009). It is sensitive to the gamma-rays in the energy range 20 MeV to 300 GeV with peak effective area of 8000 cm2 at 1 GeV. LAT has a very wide field of view of 2.4 sr covering 20% of the sky at any instant with angular resolution of 1 deg. at 1 GeV.

The LAT data for the source considered for the present analysis cover the period February 28–August 28, 2011. The data have been analyzed using the standard Fermi -LAT ScienceTools software package (ver. v9r27p1)222http://fermi.gsfc.nasa.gov/ssc/data/analysis/software/ and with the help of the analysis threads and other documentation available from the Fermi Science Support Center webpages333http://fermi.gsfc.nasa.gov/ssc/data/analysis/. We have selected only ”Diffuse” class events (i.e. the purest gamma-ray events) in the energy range 100 MeV to 300 GeV within 10∘ region of interest (ROI) centered around the source position (RA = and Dec = ) using gtselect task. In order to avoid background contamination from the bright Earth limb, we have discarded photons arriving from zenith angle greater than . We selected only those time intervals during which the events/photons qualify for science analysis using the filter expression (DATA_QUAL==1 && LAT_CONFIG==1 && ABS(ROCK_ANGLE)52) within gtmktime task. Then the livetime for the source was calculated and exposure map of the source was generated. Finally, using Unbinned likelihood analysis tool (gtlike), we fitted the source spectrum along with other 21 sources present within the ROI of 10o centered around PMN J0948+0022 and obtained the flux in the energy band 100 MeV – 300 GeV. For this, we created source model file containing model spectra for all these 21 gamma-ray sources visible in the ROI as listed in the 2nd Fermi /LAT catalogue and diffuse emission models of galactic and extragalactic origins. For PMN J0948+0022, we have taken power-law spectrum model. We obtained the value of power-law index as 2.457 0.001 with test statistics (TS; detection significance of the source ) of 399 for the whole energy range 100 MeV–300 GeV. The photon flux has been estimated to be 136.320.22 in energy range 100 MeV–300 GeV. The fluxes are also estimated in different energy bands and given in Table 2.
| Energy band | Photon Flux | Energy Flux |
|---|---|---|
| (MeV) | ||
| 100–400 | 9.15 0.27 | 252.5 7.5 |
| 400–1500 | 1.92 0.17 | 207.918.5 |
| 1500–5500 | 0.62 0.04 | 65.315.3 |
| 5500–300000 | 7.70 | 0.02 |
3 Results
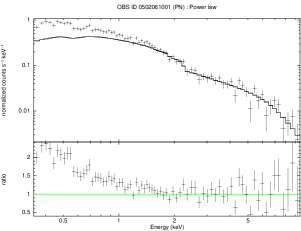
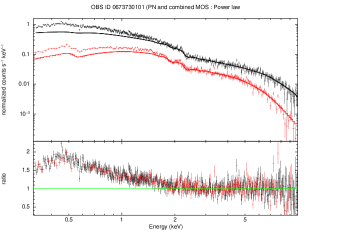
The EPIC-PN spectra of both the observations (Obs-A and Obs-B as listed in Table 1) and the combined MOS spectrum of Obs-B were fitted with a power-law distribution with the photon index using the spectral modelling tool Xspec (Arnaud, 1996). The absorption model wabs (Morrison & McCammon, 1983) is used to account for the Galactic photo-electric absorption of X-rays. The value of equivalent hydrogen column density parameter was set to cm-2 as given by the nH column density calculator (Kalberla et al., 2005) available on HEASARC website444http://heasarc.gsfc.nasa.gov/cgi-bin/Tools/w3nh/w3nh.pl. This value is kept frozen for the subsequent spectral analysis presented here. To improve the statistics, the PN and the MOS spectra of Obs-B were fitted simultaneously. The relative cross-calibration of PN and MOS detectors was taken care of by introducing a floating normalization constant in the model during the fitting process. This value is never more than 5% of unity. The complete photon spectra for both the observations in the 0.30–10.0 keV energy range could not be fitted with the power-law and galactic absorption. On the other hand, the spectra were fitted well by a power-law in the energy range 2.5–10.0 keV. The photon indices were found to be 1.490.16 for PN spectrum in Obs-A and 1.380.02 for PN and MOS spectra in Obs-B. The /dof values are 31/24 (PN, Obs-A) and 365/314 (PN and MOS, Obs-B). The power-law component when extended to lower energies (down to 0.3 keV) revealed a soft excess in the 0.3–2.5 keV energy range. The presence of soft excess component in the PN and MOS spectra are shown in Figure 1.
The origin of the soft excess in X-rays observed in case of narrow line Seyfert 1 galaxies is still not well understood. Here, we use different phenomenological and physical models to explain the observed soft excess for this source.
| Parameters | Xmm-Newton- (PN+MOS) | Swift/XRT | |
| OBS A | OBS B | ||
| Model | wabs*bknpower | constant*wabs*bknpower | wabs*bknpower |
| 2.170.02 | 2.76 | ||
| (keV) | 0.960.16 | ||
| 1.450.12 | |||
| CF | 1.0400.006 | ||
| 80/73 | 1045.64/768 | 4.78/7 | |
| Log(Flux) [0.3-10.0 keV] | -11.2260.005 | -11.3540.001 | -11.2150.024 |
| Model | wabs*(zbbody+zpowerlw) | constant*wabs*(zbbody+zpowerlw) | wabs*(zbbody+zpowerlw) |
| kT (keV) | 0.150.01 | 0.1730.003 | 0.140.04 |
| 1.440.13 | |||
| CF | 1.0400.006 | ||
| 79.6/73 | 1033.68/768 | 5.38/7 | |
| Log(Flux) [0.3-10.0 keV] | -11.2330.006 | -11.3600.001 | -11.2230.025 |
3.1 Phenomenological models
Before using the physical models to fit the spectra, we used phenomenological models – (i) broken power-law and (ii) blackbody with power-law, to understand the basic features of the spectra. The broken power-law model gives an idea about the relative steepness of the soft and the hard components of the spectrum. The fitting of the PN spectrum of Obs-A with a broken power-law gave the break energy at 1.140.11 keV with photon indices 2.210.06 and 1.610.05 below and above the break energy, respectively. The /dof came out to be 80.23/73. For the PN and the combined MOS spectra of Obs-B, the photon indices were found to be 2.170.02 and 1.560.02 below and above the break energy at 1.280.04 keV. The /dof was 1045/768. Thus the spectral features during the two observations were very similar.
In the other phenomelogical model, a blackbody is used to fit the soft excess component and a power-law is used to fit the hard component of the spectrum. The underlying assumption is that the soft excess has thermal origin. The complete model was constant*wabs*(zbbody+zpowerlaw). The fitting yielded a blackbody temperature of 0.1520.013 keV and photon spectral index of 1.640.03 for the PN spectrum of Obs-A. For the PN and the MOS spectra of Obs-B, the fitted parameters were 0.1730.004 keV and 1.5850.004 for blackbody temperature and photon power-law index respectively. The were 79.61/73 and 1033.66/768 for Obs-A and Obs-B, respectively. The details of the fitted parameters are given in Table 3. The values of parameters obtained in the above phenomenological models are consistent with the values reported for other AGN in the literature (Gierliński & Done, 2004; Porquet et al., 2004; Miniutti et al., 2009).
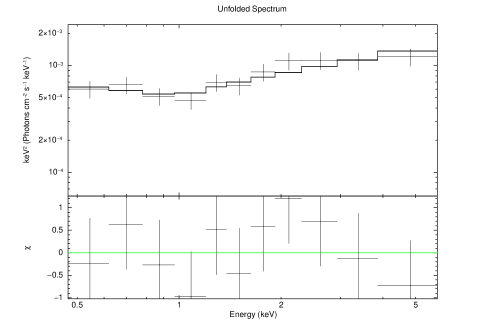
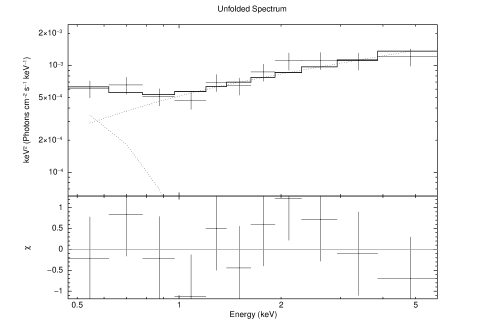
We fitted the Swift/XRT data with a simple power-law in the 0.3–10.0 keV energy range. The model used was wabs*zpowerlaw. The fitted photon index was and /dof=12.21/9. The equivalent hydrogen column density was kept fixed at cm2. Even though the soft excess could not be convincingly detected in the spectrum due to the poor statistics of the data, the fit improves when we use more complex phenomenological models, such as, broken power-law (wabs*bknpow) or a black body spectrum along with a power-law (wabs*(zbbody+pow)). In case of broken power-law the photon indices came as 2.76 and 1.450.12 below and above the break energy at 0.960.16 keV, respectively with = 4.78/11. Similarly for the second phenomenological model, the blackbody photon temperature came as 0.140.04 keV and the photon index came as 1.440.13. The was 5.38/11. The fitted spectra are shown in Fig 2. The parameters of the phenomenological models are consistent with that obtained with the xmm-Newton data. The details of the fitting parameters are given in Table 3. In the following, we limit our further analysis using more physical models to Obs-B, owing to the higher signal-to-noise ratio of these data.
3.2 Physical models
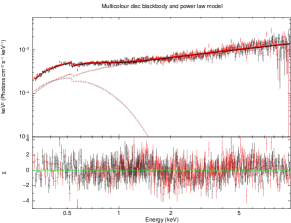
3.2.1 Multicolour disc blackbody (MCD) and power-law (PL)
Considering the possibility that the soft excess is contributed by the optically thick and geometrically thin accretion disc of the galaxy around the central black hole, we fitted the soft excess with a multicolour disc blackbody, using the diskbb model (Mitsuda et al., 1984; Makishima et al., 1986). The complete spectral model used was constant*wabs*(diskbb+zpow). The power-law photon index () was 1.550.01 indicating a hard power-law. The inner disc temperature was found to be 1553 eV. The spectral fit was reasonably good with and the fitted spectrum with its residual is shown in Figure 3. However, the inner disc temperature is not redshift corrected. The redshift correction gives a temperature of 246 eV for the redshift 0.5846.
Even though the model MCD + PL gave reasonably good fit to the observed spectra, the model has a caveat that needs to be discussed in the present context. The inner disc temperature obtained here by using the multicolour disc blackbody spectrum is consistent with the values reported for other AGN in the literature (Walter & Fink, 1993; Gierliński & Done, 2004; Porquet et al., 2004; Czerny et al., 2003; Crummy et al., 2006; Dewangan et al., 2007; Miniutti et al., 2009). The earlier reported values fall in the range of 0.1–0.2 keV. But the inner disc temperature obtained here (0.246 keV) is higher than that is expected for a Shakura-Sunyaev (SS) disc (Shakura & Sunyaev, 1973) around a black hole of mass 3 10 estimated by Yuan et al. (2008) for PMN J0948+0022 . Recently, Done et al. (2012) introduced the idea of colour temperature correction to the AGN disc spectrum. It was shown that this correction is substantial for maximum temperature more than 105 K. As discussed by Done et al. (2012) that even though the colour temperature correction is substantial, it is still not sufficient to explain the soft excess and hence the Compton scattering of photons is essential.
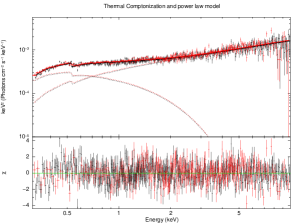
3.2.2 Thermal Comptonization of disc photons
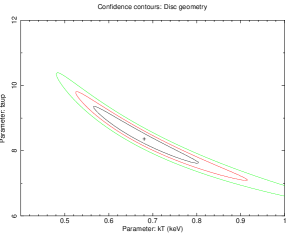
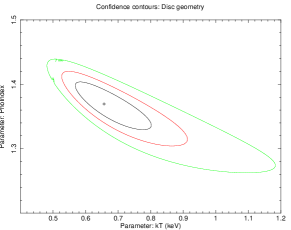
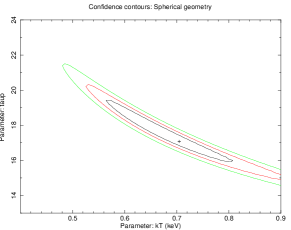
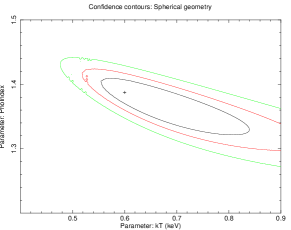
A further possibility can be that the seed photons originating from the accretion disc are Compton boosted by thermal electrons in an optically thick Comptonizing medium (corona) to produce the soft excess in the observed spectrum. The complete model used here is constant*wabs*(CompTT+zpowerlaw) where the model comptt (Titarchuk, 1994) takes care of the thermal Comptonization of soft photons and the power-law model is required to fit the hard power-law component in the observed spectrum. The free parameters in the model are the temperature of the seed photons, the temperature and the optical depth of the Comptonizing electrons and the photon index of the power-law component. As the geometry of the emission region is not known, we fitted the spectrum for spherical as well as the disc geometry. The seed photon temperature is kept fixed at 30 eV, a value typical for the inner region of the Shakura-Sunyaev accretion disc (Shakura & Sunyaev, 1973) around a black hole of mass 3 10. For the disc geometry of the Comptonizing plasma, the temperature of the Comptonizing electrons came as 0.65 keV and the photon index of the hard component was 1.37 whereas for spherical geometry the temperature of the plasma was 0.71 keV and the photon index was 1.36. Even though the photon index for the power-law component is same for both geometries, the emission region is marginally hotter for spherical geometry as compared to the disc geometry. The optical depth for disc and spherical geometries are 8.59 and 17.12, respectively. For the disk and sperical geometries of Comptonizing corona, came out to be . The temperature of the Comptonizing plasma came out to be higher than that was obtained by using the phenomenological models. Also the photon index of the power-law component is harder than that obtained by using phenomenological models. The fitted spectrum for the disc geometry is shown in Figure 3. To rule out the possibility that the parameters determined here due to some local minimum of the function, we used the Steppar utility in Xspec and explored the parameter space. The equal contour diagrams for parameter combinations plasma temperature - optical depth and plasma temperature - photon index are shown in Figure 4 and 5, respectively. This is done for both disc and spherical geometry of the Comptonizing plasma. From these figures, it is clear that the values of the plasma temperature and photon index, as obtained by using phenomenological models, can not give acceptable values when we use compTT and power-law. This is true for both spherical as well as disc geometries. In fact, the slab and the sphere geometries for the Comptonizing region can not be distinguished statistically.
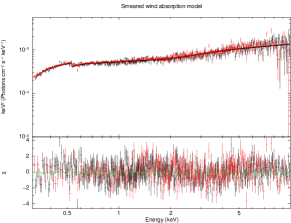
3.2.3 Smeared wind absorption model
Here and in the following subsection we discuss the alternative models which consider an atomic origin of the soft excess. Gierliński & Done (2004) discussed the relativistic smearing of characteristic atomic absorption features in a moderately relativistic wind/outflow from the inner accretion disc to explain the soft excess in the X-ray spectrum of Seyfert 1 galaxies. This model is described by Swind1 (Gierliński & Done, 2004) within Xspec. The main parameters of the model are the absorption column density, ionization parameter (, F is the flux of illuminating radiation and n is the density of the absorbing wind) and velocity dispersion () of the Gaussian velocity distribution of the wind. The model Swind1 along with the photo-electric absorption Wabs and the power-law for the background continuum gives with the present data from PN and MOS detectors. The fitted parameters are - the absorption column density: ( 1022 cm-2, the ionization parameter : erg cm s-1 and the velocity dispersion (in the unit of ) and the photon index of 1.820.01.
Even if the fit is reasonably good, the main problem with this model arises from the lower limit of the velocity dispersion as obtained from the fitting. The velocity dispersion of the wind, (in terms of ) implied that moderately relativistic wind (with Lorentz factor higher than 1.2) was required to generate the necessary smearing of the absorption features so that it could generate the smooth soft excess in the spectrum. Similar to the results obtained here, this model typically requires large velocity dispersions when applied to other sources (Gierliński & Done, 2004). However, Schurch & Done (2007, 2008); Schurch et al. (2009) showed through self consistent simulations that it is difficult to generate such winds from accretion disc driven by radiation or thermal pressure. The simulations performed by those authors showed that the generated wind can not produce sufficient blurring of the absorption features required to generate the shape of the soft excess. The remaining alternative is magnetically driven outflow. The magnetohydrodynamic simulations show that a matter dominated centrifugally driven jet with larger opening angle can be self-consistently produced from the accretion disc (Hawley & Krolik, 2006). Such jets have low velocity ( 0.4c) and also have low density ( 500 cm-3). Due to the low density sufficient absorption of radiation is not possible while the low velocity will not provide the required smearing of absorption lines to generate the shape of the smooth soft excess in the X-ray spectrum (see also Schurch & Done (2008)).
| Parameters | Best-fit values |
|---|---|
| Model | constant*wabs*(diskbb + zpowerlaw) |
| (keV) | |
| () | |
| CF | |
| 996/768 | |
| log(unabsorbed Flux) (0.3–10 keV) () | -11.3550.002 |
| Model | constant*wabs*(compTT + zpowerlaw) with spherical geometry |
| (keV) | |
| (keV) | |
| () | |
| CF | |
| 932/767 | |
| log(unabsorbed Flux) (0.3–10 keV) () | -11.3390.002 |
| Model | constant*wabs*(compTT + zpowerlaw) with disk geometry |
| (keV) | |
| (keV) | |
| () | |
| CF | |
| 932/767 | |
| log(unabsorbed Flux) (0.3–10 keV) () | -11.3400.001 |
| Model | constant*wabs*swind1*zpowerlaw |
| col. dens. ( cm-2) | |
| (in units of ) | |
| () | |
| CF | |
| 947/767 | |
| log(unabsorbed Flux) (0.3–10 keV) () | -11.3520.001 |
| Model | constant*wabs*kdblur(powerlaw+atable(reflionx.mod) |
| Index | 2.99 |
| Rin () | |
| Inclination (deg) | |
| (= photon index) | 1.10 |
| norm () | 3.39 |
| Fe/solar | 0.79 |
| Xi () | |
| () | |
| CF | |
| 960/765 | |
| log(unabsorbed Flux) (0.3–10 keV) () | -11.3390.001 |
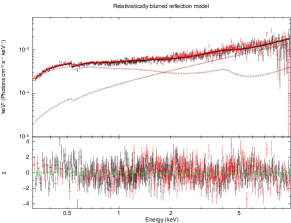
3.2.4 Relativistically blurred reflection model
The relativistically blurred reflection model has been used and discussed in the literature to explain the soft excess in NLS1 galaxies (Crummy et al., 2006; Nardini et al., 2011; Walton et al., 2013). This model deals with the atomic origin of soft excess and does not require the existence of a relativistic wind. In this model, the cold optically thick accretion disc is illuminated by a power-law distributed radiation and the accretion disc medium produces Compton scattered reflected photons along with fluorescence lines. The X-ray emission then includes both the illuminating power law and the ionised disc reflection. The fluorescent lines are broadened and blurred due to the high velocities of infalling matter in the inner part of the disc as well as the strong gravity of the accreting black hole.
The reflection component of the radiation in the relativistically blurred reflection model was introduced by Ross & Fabian (1993) and it was further updated by including more ionization states and more atomic data by Ross & Fabian (2005). In xspec, this component is implemented as a tabular model, reflionx. The resultant reflected emission is convolved with a Laor (1991) diskline profile, which accounts for the blurring of emission lines from an accretion disc around a maximally rotating black hole. Relativistically broadened iron emission lines had been observed in several AGN (Tanaka et al., 1995; Nandra et al., 2007; Risaliti et al., 2013) and the line profiles were successfully modeled in those sources. In this model, the soft excess is a series of similarly broadened emission lines from lighter elements, that blend together into a smooth emission feature. The Laor profile estimation considers that the accretion disc is geometrically thin, flat and has well defined inner and outer radii. The radial dependence of disc emissivity is assumed to be a power-law. The final model used for the fitting was constant*wabs*kdblur(powerlaw + atable{reflionx.mod}). The parameters of the model are inner and outer radii of the accretion disc, iron abundance of the accreting matter, spectral index of illuminating power-law radiation, emissivity index of the disc, ionization parameter and the inclination of the disc. The inclination of the disc is not known for this source. The radio observation of the source gives an upper limit for the jet inclination angle to 22o (Doi et al., 2006). Indeed the jet inclination angle is not necessarily be the inclination of the disc because jet structure can be bent and can have an apparent inclination angle. Due to the lack of precise information on inclination angle we kept it fixed at 22o. This value is reasonable because the Seyfert 1 galaxies generally have low inclination angle. The photon index of the power-law component and the illuminating radiation were tied together during the fitting process. The inner radius of the disc was kept free in the fitting process while the outer radius of the accretion disc is kept fixed at 400 (in terms of the gravitational radius ) which is the maximum value accepted by the kdblur model. In the fitting process, we extended the energy range beyond the observed bandpass of the XMM-Newton . This was necessary while using convolution model like kdblur. The model was evaluated in the energy range 10 eV–500 keV, whereas the fitting was carried out in the observed bandpass. The index for the radial profile of emissivity is fitted to 2.99. We obtained the photon index of the power-law component as 1.10 and the upper limit of the inner radius of the accretion disc was obtained at (in terms of the gravitational radius ). The reflionx component had disc iron abundance (in solar units), ionization parameter erg cm s-1. The /dof came out to be 960/765. The fitted spectrum along with the residual is given in Figure 3 and the fitted parameters are given in Table 4.

3.3 Spectral variability
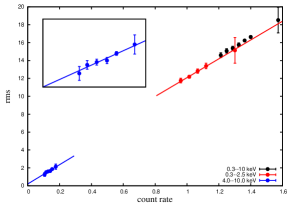
The lightcurves with 500 s time bin, in the 0.3–2.5 keV and 4.0–10.0 keV energy bands, and the corresponding hardness ratio are shown in Figure 6a. We used 100 s binned lightcurves for the energy ranges 0.3–2.5 keV, 4.0–10.0 keV and for the complete energy range 0.3–10.0 keV to calculate the rms amplitude of variability (). The rms amplitude of variability for a lightcurve with N data points and mean count rate is given by (Uttley et al., 2005)
| (1) |
The lightcurve is divided into 2000 s long segments and the is calculated for each segment. The variation of the calculated rms variability with the mean count rate for the all three energy ranges are shown Figure 6b. It is evident that, within the limited dynamical range of the count rate, the flux vs follows a linear relationship. This is true for the lightcurves in all three energy segments. The distribution of points are fitted with linear functions with slopes 10.530.58 (for 0.3–2.5 keV band) and 10.761.41 (for 4–10 keV band).
Following Edelson et al. (2002) and Vaughan et al. (2003a), we calculated the fractional variability () for the lightcurves in the energy bands 0.3–0.8 keV at the step of 0.1 keV, 0.8–1.0, 1.0–2.0, 2.0–3.0, 3.0–4.0 and 4.0–10.0 keV. The rms spectrum is shown in Figure 7. The fractional variability did not vary significantly up to 1 keV and remained around 10%. Beyond 1 keV, showed a trend of increase and reached up to 30%.

4 Discussion
4.1 X-ray soft excess
To understand the spectral behaviour of radio-loud narrow line Seyfert 1 galaxy PMN J0948+0022 in the X-ray energy band 0.3–10.0 keV, we analysed the archival data from XMM-Newton . The EPIC-PN and MOS spectra of the source in 0.3–10.0 keV region could not be fitted with a simple power-law. The spectrum in the 2.5–10.0 keV energy range fits reasonably well with a power-law distribution with photon index of 1.380.05 while the data in the 0.3–2.5 keV energy range show the presence of a distinct soft excess component when compared with the power-law extrapolated from the high energy.
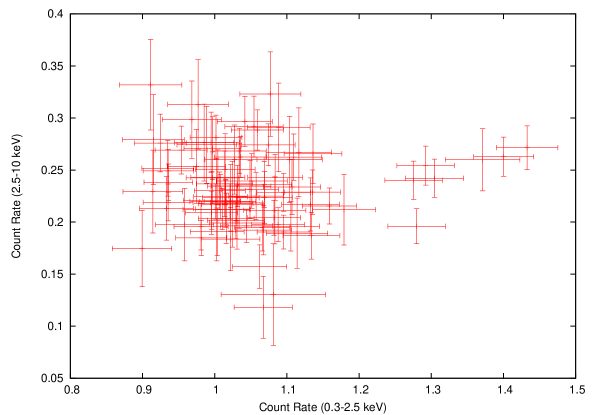
Due to the uncertainties in the understanding of the soft excess in the X-ray spectrum of NLS1, we considered four different models to fit the EPIC-PN and MOS spectra of PMN J0948+0022 and studied the viability of those models. Two models, namely direct emission from the disc and optically thick thermal Comptonisation, assume a thermal origin of the soft excess whereas the other two models, smeared wind absorption and ionised reflection, invoke an atomic origin of the soft excess. The multicolor disc blackbody models gave inner disc temperature higher than expected for a Shakura-Sunyave disc (Shakura & Sunyaev, 1973) around a black hole of mass 107M⊙. This makes the direct disc emission model less viable as an explanation for the soft excess. In the case of the thermal Comptonization model, the soft excess in the 0.3–2.5 keV energy range was modeled by the Comptonization of disc photons in an optically thick cold thermal corona. The characteristic photon temperature from the accretion disk was held fixed at 30 eV which is the typical inner disc temperature for an accretion disc around a black hole of mass 107M⊙. The fitted value of the corona temperature was found to be 0.71 keV for the spherical geometry and 0.65 for the disc geometry. The optical depth of the corona came as 17.12 for spherical and 8.6 for disc geometries. The fitting of the power-law component yielded a hard power-law with photon index 1.37 for both the geometries. This hard power-law component can be modeled by invoking a hot corona with moderate optical depth (). Such two corona scenarios were discussed in the literature in the context of explaining the X-ray spectra of Seyfert 1 galaxies (Zdziarski et al., 1996; Magdziarz et al., 1998; Dewangan et al., 2007; Laor et al., 1997). The seed photons for the cold optically thick corona are possibly the photons from the accretion disc while the seed photons for the hot corona can be either from the accretion disc or the photons of the soft excess from the optically thick corona or from both. To distinguish the possible origin of the seed photons for the hot corona, we studied the flux-flux correlation between the soft excess and power-law flux. The flux-flux distribution does not show any correlation between the two energy bands (Figure 8). If the soft excess photons served as the seed photons for the hot corona, there should have been a correlation between these bands. Therefore, it is most likely that the disc photons of temperature 30 eV served as the seed photons for the hot optically thin corona. As the observed spectrum does not show any cut-off within the observed energy band, the temperature of the electrons in the hot corona, which determines the cut-off in the photon spectrum, can not be constrained. Therefore, the future observations of the source with NuSTAR (Harrison et al., 2013) and Astro-H555http://astro-h.isas.jaxa.jp/ in hard X-rays may be required to reveal such a cut-off, if the power-law was indeed produced by the thermal Comptonization. High energy observations would also help constrain the reflection interpretation.
As shown by Gierliński & Done (2004), the thermal origin of soft excess leads to a difficulty that the temperatures of the thermal electron required to fit the spectrum fall within a very narrow range (0.1–0.3 keV) irrespective of the mass of the accreting black hole. Recently, Jin et al. (2012); Done et al. (2012) modeled the X-ray spectra of a large number of unobscured type 1 Seyferts using the thermal Comptonization model and it was found that the electron temperature varies from 0.1 to 0.6 keV, while the black hole mass ranges from – M⊙. The values of electron temperature obtained here are generally consistent with those for other NLS1 galaxies reported in the literature. Such a narrow temperature range and its independence on black hole mass suggest that the soft excess possibly does not have thermal origin, instead it could be of atomic origin (Gierliński & Done, 2004). We have already discussed previously that the smeared wind absorption model can not account for the smooth X-ray soft excess as shown by the detailed simulation studies (Schurch & Done, 2007, 2008; Schurch et al., 2009).
As the last possible alternative we studied the relativistically blurred reflection model which considers that the soft excess has atomic origin (Crummy et al., 2006; Nardini et al., 2011; Walton et al., 2013). It considers an accretion disc and a hot corona which produces the power-law component by Comptonization of the soft photons from the disc. The power-law component irradiates the disc producing reflected emission, which is then blurred due to the strong gravity and high velocities of the accreting material. The fitting process, yielded the hard power-law component with photon index at 1.1. Naturally, the illuminating radiation also had the same photon index. The upper bound of the inner radius is 2.06 (in terms of gravitational radius of the central black hole) and the outer radius is fixed at 400 (in terms of gravitational radius of the central black hole). The index for the radial pofile of emissivity came as 2.99. Generally for its value greater than 3.0, it is considered that the emitted radiation is strongly affected by the gravity of the central black hole whereas a value equal to 2.0 implies that the radiation contributed from the larger disc radii is non-negligible. Thus the present value of 2.99 implies that the illuminating corona has a fairly large height above the accretion disc so that the radiation is not affected by the gravity of the central black hole. The corona which resides at a relatively larger height above the accretion disc, may act as the base of the jet whose presence is confirmed by the detection of radio and -ray photons from PMN J0948+0022 . Such a scenario was discussed by Markoff et al. (2005) and also by Miller et al. (2012) in the context of galactic black hole X-ray binaries. Walton et al. (2013) showed that the radio-loud AGN have weak reflection features in the X-ray spectrum and this is expected if the accretion disc corona acts as the base of the jet (Markoff et al., 2005).
Following Walton et al. (2013), we estimated the reflection strength for this source. For this purpose we used the ionised reflection model pexriv where the main parameters are the disc inclination, photon spectral index, iron abundance (in solar unit), ionization and reflection parameters. The values of the photon spectral index, the iron abundance and the ionization parameter in pexriv model were freezed to the values obtained with relativistically blurred reflection model. The reflection parameter was set to zero. The normalization was then adjusted to a value so that the model flux estimated in 2–10 keV energy range matches with the observed power-law component flux in the same energy band. Then the reflection parameter was varied such that the total flux (Compton reflection + power-law) in the 15–50 keV energy range was equal to the flux obtained from relativistically blurred reflection model in the same energy band. The final value of the reflection parameter was found to be 0.367. This is consistent with the fact that the radio-loud AGN have relatively weak reflection component as compared to the radio-quiet AGN (Walton et al., 2013).
The corona may well be outflowing as discussed by Beloborodov (1999) in their dynamical corona model. It is shown by Beloborodov (1999) that a dynamical corona emits a hard power-law, hence the hard power law obtained here may be a natural consequence of the dynamical corona at the base of the jet.
We also studied the rms spectrum from the observed lightcurve. The calculated rms spectrum remained almost constant up to 1 keV and it increased beyond 1 keV. Thus beyond 1 keV, there might be independently varying spectral components and the power spectral density could be energy dependent (Vaughan et al., 2003a). As the error bars are relatively large, longer observations are required to draw any firm conclusion on spectral variability for photon energies beyond 1 keV. In fact the Fig 8 shows no correlation between the lightcurves in 0.3–2.5 and 2.5–10.0 keV energy bands, hinting that the lightcurves are possibly of independent origin.
Another important aspect of the emission from PMN J0948+0022 is the linear relation between the rms variability amplitude and the mean count rate. This behaviour is also seen in other NLS1 galaxies (Edelson et al., 2002; McHardy et al., 2004) and from Seyfert 1 galaxies (Vaughan et al., 2003a, b). Uttley et al. (2005) showed that the linear rms–flux relation is an outcome of a multiplicative process where the amplitude of short time-scale variations are modulated by the longer time scale variations. In the case of an accretion flow, the long time scale variations are produced at larger radii whereas the short time scale variations are produced at shorter radii of the accretion disc. Lyubarskii (1997) proposed a model where the fluctuations originate at the larger radii and then propagate inwards to smaller radii to explain the observed X-ray variability in X-ray binaries. Uttley & McHardy (2001) showed that the linear relationship between the rms variability amplitude and flux is a natural outcome of the model proposed by Lyubarskii (1997).
4.2 Spectral energy distribution (SED)
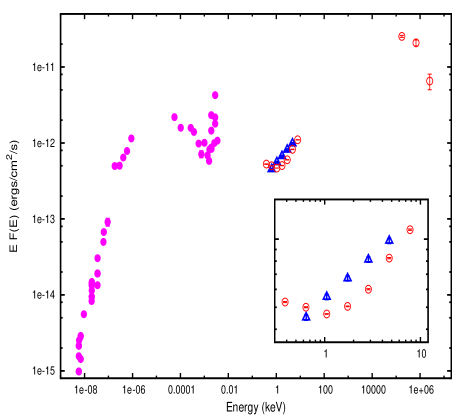
We analysed the six months Fermi/LAT data of PMN J0948+0022 and obtained the flux in the energy ranges 0.1–0.40 GeV, 0.40–1.5 GeV and 1.5–5.5 GeV. The Fermi/LAT data points and the flux values obtained from XMM-Newton PN and MOS detectors in 0.3–10 keV energy band are plotted along with the archival data in the radio-to-optical band taken from ASDC666http://www.asdc.asi.it. The data points from Swift/XRT as obtained from the present analysis are also plotted for comparison. The effect of X-ray soft excess is clearly visible in the shape of the SED as shown in Figure 9. The broadband SED of PMN J0948+0022 was previously reported by Abdo et al. (2009a) and Foschini et al. (2009) using the X-ray data from Swift/XRT. The SED in those works were modeled with self-synchrotron Compton and external Compton (EC) processes in the X-ray and MeV–GeV band, respectively. But the present SED clearly shows that the SED in the X-ray band is not a simple power-law and the presence of the soft excess needs to be accounted for to fully understand the overall energetics of the source. The modeling of the SED is beyond the scope of this work and it will be discussed in a separate work.
5 Conclusions
We analysed the archival X-ray data from XMM-Newton , Swift/XRT and -ray data from Fermi /LAT for the radio loud narrow line Seyfert 1 galaxy PMN J0948+0022. Our conclusions are as follows.
-
•
The spectral analysis of X-ray data from XMM-Newton establishes the presence of soft excess in the 0.3–2.5 keV energy band and a hard power-law beyond 2.5 keV. The near simultaneous Swift/XRT observation does not reveal this soft excess due to poor count statistics.
-
•
Among four different models used to fit the XMM-Newton spectra of the source, the Comptonization model as well as the relativistically blurred reflection model give physically acceptable description of the spectrum. Both the models assume the presence of a hard power-law emitting thermal corona above the accretion disc but its verification needs simultaneous observations of the source in hard X-rays also.
-
•
The SED of the source clearly shows the presence of soft excess which was not reported earlier. This component can not be ignored while modelling the SED of the source.
acknowledgment
The authors acknowledge the anonymous reviewer for suggestions which improve the quality of the work substantially. Authors also acknowledge Andy Fabian for providing the extended version of Reflionx model. HB acknowledges support from Department of Science & Technology INDIA, through INSPIRE faculty fellowship IFA-PH-02. HB further acknowledges R. C. Rannot and R. Koul for their support to work and to pursue DST-INSPIRE position at ApSD, BARC, Mumbai. This research has made use of data obtained from the High Energy Astrophysics Science Archive Research Center (HEASARC), provided by NASA’s Goddard Space Flight Center.
References
- Abdo et al. (2009a) Abdo A. A. et al., 2009a, ApJ, 707, 727
- Abdo et al. (2009b) Abdo A. A. et al., 2009b, ApJL, 707, L142
- Arnaud (1996) Arnaud K. A., 1996, in Astronomical Society of the Pacific Conference Series, Vol. 101, Astronomical Data Analysis Software and Systems V, Jacoby G. H., Barnes J., eds., p. 17
- Atwood et al. (2009) Atwood W. B. et al., 2009, ApJ, 697, 1071
- Beloborodov (1999) Beloborodov A. M., 1999, ApJL, 510, L123
- Bian & Zhao (2004) Bian W., Zhao Y., 2004, MNRAS, 352, 823
- Boller et al. (2003) Boller T., Tanaka Y., Fabian A., Brandt W. N., Gallo L., Anabuki N., Haba Y., Vaughan S., 2003, MNRAS, 343, L89
- Crummy et al. (2006) Crummy J., Fabian A. C., Gallo L., Ross R. R., 2006, MNRAS, 365, 1067
- Czerny et al. (2003) Czerny B., Nikołajuk M., Różańska A., Dumont A.-M., Loska Z., Zycki P. T., 2003, A&A, 412, 317
- Dewangan et al. (2007) Dewangan G. C., Griffiths R. E., Dasgupta S., Rao A. R., 2007, ApJ, 671, 1284
- Doi et al. (2006) Doi A., Nagai H., Asada K., Kameno S., Wajima K., Inoue M., 2006, PASJ, 58, 829
- Done et al. (2012) Done C., Davis S. W., Jin C., Blaes O., Ward M., 2012, MNRAS, 420, 1848
- Edelson et al. (2002) Edelson R., Turner T. J., Pounds K., Vaughan S., Markowitz A., Marshall H., Dobbie P., Warwick R., 2002, ApJ, 568, 610
- Fabian et al. (2013) Fabian A. C. et al., 2013, MNRAS, 429, 2917
- Fabian et al. (2004) Fabian A. C., Miniutti G., Gallo L., Boller T., Tanaka Y., Vaughan S., Ross R. R., 2004, MNRAS, 353, 1071
- Foschini (2011) Foschini L., 2011, in Narrow-Line Seyfert 1 Galaxies and their Place in the Universe
- Foschini et al. (2011) Foschini L. et al., 2011, MNRAS, 413, 1671
- Foschini et al. (2009) Foschini L., Maraschi L., Tavecchio F., Ghisellini G., Gliozzi M., Sambruna R. M., 2009, Advances in Space Research, 43, 889
- Gallo et al. (2006) Gallo L. C. et al., 2006, MNRAS, 370, 245
- Gallo et al. (2013) Gallo L. C. et al., 2013, MNRAS, 428, 1191
- Gehrels et al. (2004) Gehrels N. et al., 2004, ApJ, 611, 1005
- Ghisellini & Tavecchio (2009) Ghisellini G., Tavecchio F., 2009, MNRAS, 397, 985
- Gierliński & Done (2004) Gierliński M., Done C., 2004, MNRAS, 349, L7
- Haba et al. (2008) Haba Y., Terashima Y., Kunieda H., Ohsuga K., 2008, Advances in Space Research, 41, 174
- Harrison et al. (2013) Harrison F. A. et al., 2013, ApJ, 770, 103
- Hawley & Krolik (2006) Hawley J. F., Krolik J. H., 2006, ApJ, 641, 103
- Jin et al. (2012) Jin C., Ward M., Done C., Gelbord J., 2012, MNRAS, 420, 1825
- Kalberla et al. (2005) Kalberla P. M. W., Burton W. B., Hartmann D., Arnal E. M., Bajaja E., Morras R., Pöppel W. G. L., 2005, A&A, 440, 775
- Laor (1991) Laor A., 1991, ApJ, 376, 90
- Laor et al. (1997) Laor A., Fiore F., Elvis M., Wilkes B. J., McDowell J. C., 1997, ApJ, 477, 93
- Lyubarskii (1997) Lyubarskii Y. E., 1997, MNRAS, 292, 679
- Magdziarz et al. (1998) Magdziarz P., Blaes O. M., Zdziarski A. A., Johnson W. N., Smith D. A., 1998, MNRAS, 301, 179
- Makishima et al. (1986) Makishima K., Maejima Y., Mitsuda K., Bradt H. V., Remillard R. A., Tuohy I. R., Hoshi R., Nakagawa M., 1986, ApJ, 308, 635
- Markoff et al. (2005) Markoff S., Nowak M. A., Wilms J., 2005, ApJ, 635, 1203
- McHardy et al. (2004) McHardy I. M., Papadakis I. E., Uttley P., Page M. J., Mason K. O., 2004, MNRAS, 348, 783
- Miller et al. (2012) Miller J. M. et al., 2012, ApJL, 759, L6
- Miniutti et al. (2009) Miniutti G., Ponti G., Greene J. E., Ho L. C., Fabian A. C., Iwasawa K., 2009, MNRAS, 394, 443
- Mitsuda et al. (1984) Mitsuda K. et al., 1984, PASJ, 36, 741
- Morrison & McCammon (1983) Morrison R., McCammon D., 1983, ApJ, 270, 119
- Nandra et al. (2007) Nandra K., O’Neill P. M., George I. M., Reeves J. N., 2007, MNRAS, 382, 194
- Nardini et al. (2011) Nardini E., Fabian A. C., Reis R. C., Walton D. J., 2011, MNRAS, 410, 1251
- O’Brien et al. (2001) O’Brien P. T., Page K., Reeves J. N., Pounds K., Turner M. J. L., Puchnarewicz E. M., 2001, MNRAS, 327, L37
- Oshlack et al. (2001) Oshlack A. Y. K. N., Webster R. L., Whiting M. T., 2001, ApJ, 558, 578
- Page et al. (2003) Page K. L., O’Brien P. T., Reeves J. N., Breeveld A. A., 2003, MNRAS, 340, 1052
- Papadakis et al. (2010) Papadakis I. E., Brinkmann W., Gliozzi M., Raeth C., Nicastro F., Conciatore M. L., 2010, A&A, 510, A65
- Porquet et al. (2004) Porquet D., Reeves J. N., O’Brien P., Brinkmann W., 2004, A&A, 422, 85
- Risaliti et al. (2013) Risaliti G. et al., 2013, Nature, 494, 449
- Ross & Fabian (1993) Ross R. R., Fabian A. C., 1993, MNRAS, 261, 74
- Ross & Fabian (2005) Ross R. R., Fabian A. C., 2005, MNRAS, 358, 211
- Schurch & Done (2007) Schurch N. J., Done C., 2007, MNRAS, 381, 1413
- Schurch & Done (2008) Schurch N. J., Done C., 2008, MNRAS, 386, L1
- Schurch et al. (2009) Schurch N. J., Done C., Proga D., 2009, ApJ, 694, 1
- Shakura & Sunyaev (1973) Shakura N. I., Sunyaev R. A., 1973, A&A, 24, 337
- Strüder et al. (2001) Strüder L. et al., 2001, A&A, 365, L18
- Tanaka et al. (1995) Tanaka Y. et al., 1995, Nature, 375, 659
- Titarchuk (1994) Titarchuk L., 1994, ApJ, 434, 570
- Turner et al. (2001) Turner M. J. L. et al., 2001, A&A, 365, L27
- Uttley & McHardy (2001) Uttley P., McHardy I. M., 2001, MNRAS, 323, L26
- Uttley et al. (2005) Uttley P., McHardy I. M., Vaughan S., 2005, MNRAS, 359, 345
- Vaughan et al. (2003a) Vaughan S., Edelson R., Warwick R. S., Uttley P., 2003a, MNRAS, 345, 1271
- Vaughan et al. (2003b) Vaughan S., Fabian A. C., Nandra K., 2003b, MNRAS, 339, 1237
- Walter & Fink (1993) Walter R., Fink H. H., 1993, A&A, 274, 105
- Walton et al. (2013) Walton D. J., Nardini E., Fabian A. C., Gallo L. C., Reis R. C., 2013, MNRAS, 428, 2901
- Yuan et al. (2008) Yuan W., Zhou H. Y., Komossa S., Dong X. B., Wang T. G., Lu H. L., Bai J. M., 2008, ApJ, 685, 801
- Zdziarski et al. (1996) Zdziarski A. A., Gierlinski M., Gondek D., Magdziarz P., 1996, A&AS, 120, C553