Timing and Spectral properties of Be/X-ray pulsar EXO 2030+375 during a type I outburst
Abstract
We present results from a study of broadband timing and spectral properties of EXO 2030+375 using a observation. Pulsations with a period of 41.41 s and strong energy dependent pulse profiles were clearly detected up to 100 keV. Narrow dips are seen in the profiles up to 70 keV. Presence of prominent dips at several phases in the profiles up to such high energy ranges were not seen before. At higher energies, these dips gradually disappeared and the profile appeared single-peaked. The 1.0-200.0 keV broad-band spectrum is found to be well described by a partial covering high energy cut-off power-law model. Several low energy emission lines are also detected in the pulsar spectrum. We fitted the spectrum using neutral as well as partially ionized absorbers along with above continuum model yielding similar parameter values. The partial covering with partially ionized absorber resulted into marginally better fit. The spectral fitting did not require any cyclotron feature in the best fit model. To investigate the changes in spectral parameters at dips, we carried out pulse-phase-resolved spectroscopy. During the dips, the value of additional column density was estimated to be high compared to other pulse phases. While using partially ionized absorber, the value of ionization parameter is also higher at the dips. This may be the reason for the presence of dips up to higher energies. No other spectral parameters show any systematic variation with pulse phases of the pulsar.
Subject headings:
stars: neutron, pulsars: individual: EXO 2030+375, X-rays: stars1. Introduction
Be/X-ray binaries represent the largest subclass of high mass X-ray binary systems. The compact object in these systems is generally a neutron star (pulsar) whereas the companion is a B or O-type star which shows Balmer emission lines in its spectra. The binary optical companion lies well within the Roche lobe. The objects in these binary systems are typically in a wide orbit with moderate eccentricity. Though evolutionary model calculations show that binary systems with white dwarf and Be star or black hole and Be star should also exist, clear evidence of the existence of such binary systems has not been found as yet (Zhang, Li & Wang 2004 and references therein). The neutron star in these Be/X-ray binary systems accrets matter while passing through the circumstellar disk of the companion Be star. The abrupt accretion of matter onto the neutron star while passing through the circumstellar disk of the Be companion or during the periastron passage results in strong X-ray outbursts (Okazaki & Negueruela 2001). During such outbursts, the X-ray emission from the pulsar can be transiently enhanced by a factor more than 10. Be/X-ray binary systems generally show periodic normal (type I) X-ray outbursts that coincide with the periastron passage of the neutron star and giant (type II) X-ray outbursts which do not show any clear orbital dependence apart from the persistent low luminosity X-ray emission during quiescent (Negueruela et al. 1998). The neutron stars in the Be/X-ray binary systems are found to be accretion powered X-ray pulsars except a very few cases such as LS I+61303 (Massi et al. 2004). The spin period of these pulsars is found to be in the range of a few seconds to several hundred seconds. The X-ray spectra of these pulsars are generally hard. Fluorescent iron emission line at 6.4 keV is observed in the spectrum of most of the accretion powered X-ray pulsars. For a brief review on the properties of Be/X-ray binary pulsars, refer to Paul & Naik (2011).
The transient X-ray pulsar EXO 2030+375 was discovered during a giant outburst in 1985 with observatory (Parmar et al. 1989a). Optical and near-infrared observations of the error circle identified a B0 Ve star as the counterpart of EXO 2030+375 (Motch & Janot-Pacheco 1987; Coe et al. 1988). Using the observations in 1985, the spin and orbital periods of the pulsar were estimated to be 42 s and 44.3-48.6 days, respectively. Analyzing monitoring data of several consecutive outbursts of the pulsar EXO 2030+375 in 1992, Stollberg et al. (1997) derived following orbital parameters of the binary system : orbital period Porb = 46.020.01 days, = 0.360.02, sin = 26114 lt-sec, = 223∘.5 1∘.8, and time of periastron passage = 2448936.8 0.3 days. During the giant outburst in 1985, the pulsar was observed with observatory. A significant change in 1-20 keV luminosity by a factor of 2500 was detected compared to that during the quiescent phase. A dramatic change in pulse period was seen during the luminosity decline with spin-up timescale of 30 yr (Parmar et al. 1989a). During the outburst, the pulse profile of the pulsar was found to be strongly luminosity dependent. At high luminosity, the pulse profile consisted of one main pulse and a small inter-pulse, separated by 180∘ phase. The strength of the two pulses was reversed when the luminosity was decreased by a factor of 100 (Parmar et al. 1989b). By using a geometric model, Parmar et al. (1989b) explained that the dominant beam of emission changed from a fan-beam to a pencil-beam during the decrease in luminosity and that resulted in the strength reversal of the main and inter-pulse. An extensive monitoring campaign of EXO 2030+375 with and Rossi X-ray Timing Explorer () showed that a normal outburst has been detected for nearly every periastron passage for 13.5 years (Wilson, Fabregat & Coburn 2005).
The spectral analysis of EXO 2030+375 had been carried out by using data during outburst (Reynolds, Parmar & White (1993); Sun et al. (1994)). The 1-20 keV spectrum was described by a two component continuum model consisting of a blackbody component with temperature 1.1 keV whereas the hard X-ray part was represented by a power-law. monitoring of the pulsar during an outburst in 1996 June-July also suggested that a two component (blackbody and power-law with an exponential cut-off) model was required to describe the 2.7–30 keV pulsar spectrum (Reig & Coe 1999). A spectral feature at 36 keV in the hard X-ray spectrum (in 17-65 keV range) was ascribed to a possible cyclotron absorption line implying the estimated magnetic field of the pulsar to be 3.11012 Gauss (Reig & Coe 1999). However, using regular monitoring data of EXO 2030+375 with the from 2006 June to 2007 May, covering the first giant outburst since its discovery in 1985, Wilson et al. (2008) reported a cyclotron feature at 11 keV and estimated the magnetic field strength to be 1.31012 Gauss. This feature was consistently detected in the pulsar spectrum for about 90 days when the 2-100 keV luminosity was above 51037 erg s-1. and observation of the same giant outburst was used to describe the 3-120 keV spectra by using an absorbed power-law with an exponential cut-off, an iron emission line and some peculiar features in 10-20 keV energy range. The feature in 10-20 keV energy range was modeled by a broad emission line at 13-15 keV or by two absorption lines at 10 keV and 20 keV (Klochkov et al. 2007). Pulse-phase resolved spectroscopy of observation of the pulsar during the giant outburst showed significant spectral variability of the continuum parameters (Klochkov et al. 2008). In the process, evidence of the presence of an absorption line at 63 keV was found at a narrow pulse phase interval when EXO 2030+375 was at the peak of its giant outburst. This feature was interpreted as the harmonic of the previously reported 36 keV cyclotron line.
For a detailed study of timing and spectral properties, EXO 2030+375 was observed with on 14 May 2007, at the peak of a regular Type I outburst. The results obtained from the timing and spectral analysis of the observation are presented in this paper.

2. Observation
Observation of the transient Be/X-ray binary pulsar EXO 2030+375 was carried out on 2007 May 14 at the peak of its regular type I outburst. The publicly available arcival data (ver-2.0.6.13) of above observation was used in the present work to investigate the properties of the pulsar during the outburst. Figure 1 shows the one-day averaged light curve of EXO 2030+375 in 15-50 keV energy range obtained from the /BAT monitoring data between 2007 February 4 and 2007 July 29 covering the present type-I outburst. The arrow mark in the figure shows the observation of the pulsar during the peak of the outburst. This observation was carried out at “HXD nominal” pointing position for effective exposures of 57 ks and 53 ks for XIS and HXD, respectively. The XIS were operated with “burst” clock mode in “1/4 window” option, covering 17′.84′.4 field of view.

The fifth Japanese X-ray astronomy satellite (Mitsuda et al. 2007) was launched on 2005 July 10. There are two sets of instruments onboard such as X-ray Imaging Spectrometer (XIS; Koyama et al. 2007) which covers 0.2-12 keV energy range and Hard X-ray Detector (HXD; Takahashi et al. 2007) which covers 10-600 keV energy range. Among the four sets of XIS, each with a 10241024 pixel CCD at the focus of corresponding telescope, one (XIS-1) is back-illuminated whereas the others are front illuminated. In full window mode, the field of view of the XIS is 18’18’ with an effective area of 340 cm2 and 390 cm2 at 1.5 keV for front-illuminated and back-illuminated CCDs, respectively. The non-imaging instrument HXD which was designed to detect high energy X-ray photons, consists of 16 identical units made up of two types of detectors such as silicon PIN diodes covering 10–70 keV energy range and GSO crystal scintillator covering 30–600 keV energy range. The effective area of the PIN diodes is 145 cm2 at 15 keV whereas that of GSO detectors is 315 cm2 at 100 keV. As XIS-2 was unoperational during the observation of EXO 2030+375, data from other 3 XISs are used in the present analysis.
3. Analysis and Results
For XIS and HXD data reduction, we reprocessed the unfiltered event data using ’aepipeline’ package of HEASoft version 6.12 and utilizing the calibration database (CALDB) released on 2012 February 10 (for XIS) and 2011 September 13 (for HXD). Source light curves and spectra were extracted from the reprocessed cleaned event data of XIS, PIN and GSO detectors. The simulated background events, as suggested by the instrument team, were used to estimate the PIN and GSO backgrounds for the EXO 2030+375 observation. The response file which was released in 2008 January was used for HXD/PIN spectrum whereas response and effective area files released in 2010 May were used for HXD/GSO. The reprocessed XIS event data were checked for the possible presence of photon pile-up. Pile-up estimation was performed by examining the Point Spread Function (PSF) of the three XISs by checking the count rate per one CCD exposure at the image peak as given by Yamada & Takahashi222http://www-utheal.phys.s.u-tokyo.ac.jp/ yuasa/wiki/index.php/How to check pile up of Suzaku XIS data. It was found that the XIS event data was not affected by photon pile-up. The source spectra were accumulated from the XIS reprocessed cleaned event data by selecting a circular region of around the image centroid. The XIS background spectra were accumulated from the same observation by selecting circular regions away from the source. The response files and effective area files for XIS were generated by using the ”xissimarfgen” and ”xisrmfgen” tasks of FTOOLS.

3.1. Timing Analysis
For the timing analysis, the arrival times of the X-ray photons were converted to the same at the solar system barycenter by using the specific barycenter correction task “aebarycen”. X-ray light curves with time resolutions of 2 s, 1 s and 1 s were extracted from XIS (in 0.2–12 keV energy range), PIN (in 10–70 keV energy range), and GSO (in 40–600 keV energy range) event data, respectively. Pulse folding and a maximization technique was applied to the light curves obtained from XIS, PIN and GSO event data and the pulse period of the pulsar was estimated to be 41.4106(1) s. The light curves were then folded with this period to get the pulse profiles at different energy range. It is found that the pulse profiles of the pulsar obtained from the background subtracted light curves of XIS-0, XIS-1 and XIS-3 are identical, whereas it is somewhat different to the profiles obtained from HXD/PIN and HXD/GSO data. The pulse profiles of EXO 2030+375 obtained from the background subtracted XIS-0, HXD/PIN and HXD/GSO light curves of the observation are shown in Figure 2. The XIS and HXD/PIN profiles, though look similar, the structure and depths of the dips are found to be different. However, the difference is very clearly visible in the HXD/GSO profile. To investigate the energy dependence of the pulse profile of EXO 2030+375, we generated source and corresponding background light curves in various energy bands from the XIS, PIN and GSO event data. After appropriate background subtraction, the light curves were folded with the estimated pulse period and the corresponding pulse profiles are shown in Figures 3 & 4. From the figures, it can be seen that the X-ray pulsations in EXO 2030+375 are clearly seen up to 100 keV. The dips in the profiles are very strong and clearly distinguishable up to 40 keV. Beyond this energy, the width and depth of the dips in the pulse profiles decrease gradually up to 70 keV. Beyond 70 keV, however, the dips become indistinguishable and the pulse profiles appear smooth and single peaked. The presence of dips in the pulse profiles up to 70 keV is rarely seen in the accretion powered X-ray pulsars. The characteristic properties of these dips in the pulse profile of EXO 2030+375 is being investigated in the present work through pulse phase resolved spectroscopy.

3.2. Spectral Analysis
3.2.1 Pulse phase averaged spectroscopy
We analyzed the pulse-phase-averaged spectra of EXO 2030+375 using XIS, HXD/PIN and HXD/GSO event data. The spectra from both the front-illuminated CCDs (XIS-0 and XIS-3) were added together along with corresponding response matrices and background spectra by using package “addascaspec”. Data from XIS-1 was used separately in the spectral fitting. In the spectral fitting, we selected data in the energy ranges of 1-10 keV for both front and back-illuminated CCDs (added spectra from XIS-0 and XIS-3, and XIS-1), 12-70 keV for the HXD/PIN and 40-200 keV for the HXD/GSO. After appropriate background subtraction, simultaneous spectral fitting was carried out using the XIS, PIN and GSO spectra with XSPEC v12.7.1. All the spectral parameters other than the relative instrument normalization, were tied together for all the detectors. The XIS spectra were binned by a factor of 5 from 1-10 keV whereas the PIN spectrum was not binned up to 50 keV beyond which it was binned by a factor of 3. The GSO spectrum was binned with the fixed grouping scheme provided by the instrument team333http://heasarc.gsfc.nasa.gov/docs/suzaku/analysis/gsobgd64bins.dat. Because an artificial structure is known to be present in the XIS spectra at around the Si edge, we ignored data between 1.7–1.9 keV and 2.2–2.4 keV in our spectral analysis. In the beginning, we tried to fit the broad-band spectra of the pulsar with various continuum models such as power-law model modified with an exponential cut-off, Negative and Positive power law with EXponential (NPEX) continuum model and partial covering power-law with high energy cut-off model along with interstellar absorption and Iron Kα emission line at 6.4 keV. It is found that in case of all continuum models other than the partial covering high energy cut-off model, the spectral fitting was extremely poor with reduced of more than 3. Therefore, we ignored all other continuum models in our fitting. Though a few of these models were used to describe the source continuum earlier (for example - Reynolds et al. 1993; Wilson et al. 2008), higher sensitivity detectors with better energy resolution onboard and its broad-band spectral capability provide good statistical quality in the spectrum to rule out the other spectral models for this source. It may happen that the properties of the pulsar may be different during the normal outburst (present one) and giant outbursts (Reynolds et al. 1993; Wilson et al. 2008).
3.2.2 Partial covering high energy cutoff power-law model
The partial covering power-law with high energy cut-off model consists of two power-law continua with a common photon index but with different absorbing hydrogen column densities. The analytical form of the partially covering power-law with high energy cut-off model is
where
is the Galactic equivalent hydrogen column density, is the additional equivalent hydrogen column density of the material local to the neutron star, is the observed intensity, is the photon index, is the photo-electric cross-section, and are the normalizations of the power-law, is the cut-off energy and the e-folding energy. The covering fraction of the absorbed power-law due to the presence of additional matter local to the neutron star is expressed as Norm2 / (Norm1 + Norm2) = ].
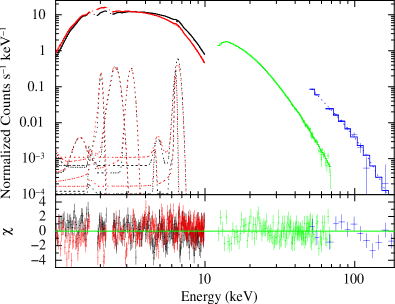
As mentioned earlier, the relative instrument normalizations of added front-illuminated CCDs (XIS-0 and XIS-3, quoted as XIS03), XIS-1, PIN and GSO detectors were kept free. The corresponding values obtained are 1.00:1.04:0.99:1.02 for XIS03:XIS1:PIN:GSO with a clear agreement with the values at the time of detector calibration. After fitting the spectra with above model, excess residuals were found to be present at 2 keV, 2.5 keV, 3.2 keV and 6.6 keV. As the observation was during the peak of the Type I outburst and the pulsar being bright at hard X-rays, the presence of several emission lines is expected in the spectrum. Therefore, we added Gaussian functions at above energies to the spectral model and re-fitted the spectra. Though these emission lines are weak, addition of these lines to the model improved the simultaneous spectral fitting with reduced of 1.59 (for 638 dof). Detection of several emission lines at soft X-rays and the pulsar being so bright during the observation, we attempted to fit the broad-band spectra with the partial covering high energy cut-off power-law model with partially ionized absorber ( model in XSPEC; Reeves et al. 2008) and Gaussian functions for detected emission lines. Using the partially ionized abosrber component in the spectral model, the ionization states of the absorbing medium and the corresponding covering fraction could be investigated. The model component in uses a grid of (Kallman et al. 2004) photoionized absorption models for absorption. The free parameters in this model are (in 1022 cm-2), (covering fraction), and the ionization parameter (erg cm s-1; Reeves et al. 2008). The spectral fitting was improved marginally with reduced of 1.51 (for 637 dof). The energy spectra of the pulsar EXO 2030+375 are shown in Figure 5 & 6 (for partial covering models with neutral and partially ionized absorbers, respectively) along with the spectral components (top panels) and residuals to the best-fit model (bottom panels). As the difference in both the spectral models is the nature of the additional absorption components without any noticable change in the best-fit value of other spectral parameters, both the figures look similar. The best-fit parameters obtained from the simultaneous spectral fitting to the XIS, PIN and GSO data with partial covering model modified with neutral and partially ionized absorbers are given in Table 1.
The spectral fitting of the observations of the pulsar during 2006 June giant outburst showed the presence of a cyclotron resonance feature centered at 11 keV (Wilson et al. 2008). A cyclotron resonance line at 63 keV was reported at certain pulse phase ranges of the pulsar from the observations during same giant outburst (Klochkov et al. 2008). From observations of the pulsar at relatively lower luminosity level, a spectral feature was detected at 36 keV and ascribed to a cyclotron absorption feature (Reig & Coe 1999). However, in our spectral fitting, no such absorption feature was present at above energies. Therefore, we did not include any additional cyclotron absorption component to the spectral fitting.
| Parameter | Value | |
|---|---|---|
| Model-1 | Model-2 | |
| NH1 | 2.040.01 | 2.070.01 |
| NH2 | 40.93.3 | 45.42.8 |
| Covering Fraction | 0.130.01 | 0.230.01 |
| —— | 1.560.15 | |
| Power-law index | 1.330.01 | 1.370.01 |
| High energy cutoff (keV) | 12.40.2 | 11.00.8 |
| E-fold energy (keV) | 21.20.2 | 21.50.2 |
| Emission lines | ||
| Si XIII | ||
| Line energy (keV) | 2.010.01 | 2.010.01 |
| Line width (keV) | 0.001 | 0.001 |
| Line eq. width (eV) | 2 | 22 |
| Si XIV | ||
| Line energy (keV) | 2.500.03 | 2.510.02 |
| Line width (keV) | 0.130.03 | 0.140.02 |
| Line eq. width (eV) | 11 | 13 |
| S XV | ||
| Line energy (keV) | 3.190.01 | 3.190.01 |
| Line width (keV) | 0.110.02 | 0.120.01 |
| Line eq. width (eV) | 8 | 10 |
| Iron Kα | ||
| Line energy (keV) | 6.390.01 | 6.40.02 |
| Line width (keV) | 0.01 | 0.050.02 |
| Line eq. width (eV) | 7 | 19 |
| Fe XXVI | ||
| Line energy (keV) | 6.610.01 | 6.660.02 |
| Line width (keV) | 0.200.02 | 0.080.03 |
| Line eq. width (eV) | 51 | 25 |
| Source flux | ||
| 1 - 10 keV range | 2.94 | 2.94 |
| 10 - 70 keV range | 5.92 | 5.92 |
| 70 - 200 keV range | 2.53 | 2.54 |
| Reduced | 1.59 (638) | 1.51 (637) |
NH1 = Galactic equivalent hydrogen column density along the line of sight, NH2 = Additional hydrogen column density of material local to the neutron star. NH1 and NH2 are in the units of (1022 atoms cm-2). Source flux is in the unit of 10-9 ergs cm-2 s-1. Source flux quoted above is not corrected for interstellar absorption.

3.2.3 Pulse phase resolved spectroscopy
The presence of several prominent dips in the pulse profile and partial covering power-law with high energy cut-off being the best fit continuum model imply the possibilities of presence of streams of matter at various pulse phases around the poles of the transient Be/X-ray binary pulsar EXO 2030+375. To investigate this, pulse-phase-resolved spectroscopy was performed on the XIS and PIN data. By applying phase filtering in the FTOOLS task “XSELECT”, we accumulated 25 pulse phase resolved spectra from XIS and HXD/PIN event data. Data from GSO detectors were not used in phase-resolved spectroscopy as the signal-to-noise ratio was very poor for spectra of each phase bins. For phase-resolved spectroscopy, we used same background spectra and response matrices for corresponding detectors as were used for phase-averaged spectroscopy. Simultaneous spectral fitting was carried out in the 1.0-70.0 keV energy band to each of the 25 phase resolved XIS and PIN spectra. The phase resolved XIS and PIN spectra were fitted with the partial covering power-law with high energy cut-off model with neutral and partially ionized absorber (as was done in phase-averaged spectroscopy). Some of the parameters such as the values of relative instrument normalizations, the Galactic absorption (), center energy and width of emission lines were fixed at the values obtained from phase-averaged spectroscopy. The parameters obtained from the simultaneous spectral fitting to the XIS and PIN phase resolved spectra using partial covering model with neutral and partially ionized absorber are shown in the left and right panels of Figure 7, respectively. The top three panels in both the sides of Figure 7 show the pulse profiles of EXO 2030+375 obtained from XIS, PIN and GSO data. The values of additional column density (NH2) and covering fraction over pulse phases are shown in fourth and fifth panels of the figure, respectively. The change in values of power-law photon index, e-folding energy and cut-off energy over pulse phases are shown in sixth, seventh and eighth panels respectively. The left side bottom panel shows the variation of power-law normalization whereas the right side bottom panel of the figure shows the value of ionization parameter over pulse phases (for the partial covering model with partially ionized absorber).
Among the spectral parameters, most notable and systematic variability is seen in the values of additional column density and covering fraction of the absorber. The values of NH2 are found to be high at phases where dips are present in the pulse profiles. This pattern is seen in case of both the models i.e. partial covering model with neutral as well as partially ionized absorber. In case of partial covering model with partially ionized absorber, the value of the ionization parameter was found to be relatively higher at dip phases indicating the presence of highly ionized additional absorber at several pulse phases causing dips in the pulse profiles. The higher values of cut-off energy were also found at pulse phases that are coincident with the dips in the pulse profiles. The values of the power-law photon index and e-folding energy are found to be variable over the pulse phases of the pulsar. However, it is difficult to correlate these variabilities with the dips in the pulse profiles. We did not find any variability in the flux of both the iron emission lines over the pulse phases of the pulsar. This suggests that the matter emitting the iron fluorescence lines is probably distributed symmetrically around the pulsar.


4. Discussion
Be/X-ray binaries usually show two types of X-ray outbursts such as normal (type I) outbursts and giant (type II) outbursts. The normal outbursts are characterized by lower luminosity (1036-37 erg s-1) and occur near the periastron passage. However, the giant outbursts are characterized by high luminosities (1037 erg s-1) and very rare (Stella, White & Rosner 1986; Negueruela et al. 1998; Bildsten et al. 1997). In case of Be/X-ray pulsar EXO 2030+375, the type I outbursts are seen almost every 46 days (orbital period) whereas the giant outbursts were only seen twice; in 1985 during which the pulsar was discovered (Parmar et al. 1989a, 1989b) and in 2006 (Wilson et al. 2008). The pulsar has been monitored extensively with various X-ray observatories giving rise to the accurate estimation of the orbital parameters of the binary system (Wilson et al. 2008). Attempts have been made to measure and understand the complex nature of the phase-averaged pulsar spectrum (Klochkov et al. 2008; Wilson et al. 2008 and references therein). Phase-resolved spectroscopy has been performed only once when the pulsar was undergoing the second giant outburst in 2006 (Klochkov et al. 2008). Though, phase resolved spectral analysis was carried out on the observations of the pulsar during a normal outburst (Reig & Coe 1998), the inferior spectral capability and low energy threshold of the detectors limited the understanding of the complex nature of the pulse profile. Broad-band capability and high sensitivity of detectors onboard provided the opportunity to investigate the properties of the pulsar at different pulse phases in more detail.
4.1. Pulse Profile
The pulse profile of the transient pulsar EXO 2030+375 are found to be strongly energy dependent. The presence of several prominent dips makes the soft X-ray pulse profiles complex. The strength of these dips gradually decreases with energy, making the profile a smooth and single peaked at high energy bands. X-ray pulsations in EXO 2030+375 are detected up to as high as 100 keV. The shape of the pulse profiles obtained from observation are found to be different from that obtained from (Reig & Coe 1998; Sasaki et al. 2010), (Martinez Nunez et al. 2003), (Klochkov et al. 2008) observatories, though a few of these observations were carried out during the 2006 giant outburst. The presence of dips in the pulse profile are seen in other transient X-ray pulsars such as A0535+262 (Naik et al. 2008), GX 304-1 (Devasia et al. 2011), GRO J1008-57 (Naik et al. 2011), 1A 1118-61 (Devasia et al. 2011; Maitra et al. 2012), RX J0440.9+4431 (Usui et al. 2012), Vela X-1 (Maitra & Paul 2012) etc. In most of the cases, pulse-phase resolved spectral analysis showed the presence of additional absorption component at certain pulse phases that partially obscured the emitted radiation giving rise to dips in the pulse profiles. The additional absorption is understood to be taking place by matter in the accretion streams that are phase locked with the neutron star.
In accretion powered pulsars, pulse profiles at hard X-rays are generally simpler and smoother than that at low energies. Low-energy pulse profiles are more affected by absorption by circumstellar matter and/or additional matter distribution near the neutron star. In case of majority of the Be/X-ray binary pulsars, the soft X-ray pulse profiles are found to consist of dips at various pulse phases whereas the hard X-ray pulse profiles are smooth and single-peaked. EXO 2030+375 is one of a few other accreting X-ray pulsar which clearly show hard X-ray pulsations. In the present work, it was found that the 41.41 s pulsations are detected in the X-ray light curves at high energies (100 keV). Similar results are seen in a few other pulsar such as 1A 1118-61 (up to 100 keV; Coe et al. 1994; Bildsten et al. 1997), 2S 1417-624 (up to 100 keV; Finger et al. 1996), GX 1+4 (up to 100 keV; Naik, Paul & Callanan 2005), GRO J1008-57 (up to 100 keV; Naik et al. 2011) etc. High energy photons being less affected by the absorption/scattering by matter in the interstellar medium as well as matter distribution close to the neutron star, the hard X-ray pulse profiles possibly indicate the intrinsic radiation pattern from the pulsar. Analyzing the shape of energy resolved pulse profiles of EXO 2030+375 during its second giant outburst in 2006, Sasaki et al. (2010) modeled the geometry of the neutron star by identifying the emission components of the magnetic poles. The asymmetric shape of the pulse profiles during the giant outburst was explained in terms of moderately distorted magnetic field the consequence of which is that one pole of the pulsar gets closer to the line of sight than the other. Because of the asymmetry in position of the poles, the symmetric pulse profiles from both the poles merged together and appeared as asymmetric in shape. Similar analysis was carried out to understand the geometry of the neutron star in other binary pulsars such as 4U 0115+63 and V0332+53 at various luminosity levels of their outbursts (Sasaki et al. 2012). In contrast to the results obtained from the 2006 giant outburst of EXO 2030+375 (Klochkov et al. 2008; Sasaki et al. 2010), we find that at high energies, the shape of the pulse profiles appeared to be symmetrical. At soft X-rays, the pulse profile was found to be complex because of the presence of several absorption dips. The shape of the observed pulse profiles during type I outburst suggests the asymmetric distribution of the magnetic poles which was used to describe the findings during the giant outburst in EXO 2030+375 may not be applicable.
4.2. Spectroscopy
The broad-band X-ray spectrum of EXO 2030+375 in 1-200 keV energy range has been described here in this paper for the first time in detail. Camero Arranz et al. (2005) presented the pulsar spectrum in 5-300 keV energy range obtained from the observation of a type I outburst in 2002 December by a model consisting of a disk blackbody ( 8 keV) and a power-law with of 2.04 or a Comptonized component. The lower threshold at 5 keV limited the understanding of the characteristic properties of the pulsar at soft X-rays. A blackbody component at a temperature of 8 keV is rarely reported so far and difficult to explain in accretion powered X-ray pulsars. They also did not find any evidence of presence of an iron line or cyclotron line features in the pulsar spectrum. observations of the pulsar during type I outbursts, though used a blackbody and power-law components to explain the 2.7-30 keV spectrum, the blackbody temperature was estimated to be 1.4 during entire outburst (Reig & Coe 1999). The presence of an iron emission line at 6.4 keV was seen in the spectra. Apart from the observations, there are other observations at high energy bands some of which are during the two giant outbursts.
In case of Be/X-ray binaries, the circumstellar disk around the Be companion plays an important role in the X-ray emission from the neutron star. During the periastron passage, the outer edge of the disk is truncated by the neutron star resulting in X-ray outbursts. During the periastron passage, as additional matter is being accreted onto the neutron star, the value of the equivalent hydrogen column density increases significantly. This increase in column density modifies the emitted radiation at soft X-rays. While simultaneous spectral fitting to the pulsar spectrum in 1-200 keV energy range, the estimated value of column density always exceeded the corresponding Galactic value in the direction of the pulsar. Even though, we attempted to fit the broad-band spectra of EXO 2030+375 with various continuum models, partial covering model provided best-fit to the data. Though the estimated value of absorption column density was higher, another significant absorption component with certain value of covering fraction (as given in Table 1) was required in the spectral fitting. EXO 2030+375 being a bright hard X-ray pulsar and presence of significant amount of matter at periastron passage, there is a possibility of ionizing the surrounding matter. To investigate this, we attempted to fit the spectrum with an partially ionized absorber which yielded marginal improvement in the spectral fitting. Apart from this, low energy emission lines are also detected in the pulsar spectrum. We found Si XIII, Si XIV, S XV, Fe Kα and Fe XXVI emission lines in the XIS spectra of the pulsar. Though the multiple iron emission lines are seen in other accretion powered X-ray pulsars e.g. Cen X-3 (Naik, Paul, & Ali 2011 and references therein), GX 1+4 (Naik, Paul & Callanan 2005 and references therein), the low energy Si and S emission lines are detected for the first time in this pulsar. As the previous observations were carried out during giant outbursts or with the instruments of lower spectral capability at soft X-rays, these Si and S lines were missed out from detection. During giant outbursts which are not associated with the periastron passage, lack of significant amount of additional matter in the close proximity of the neutron star as detected during type I outbursts, reduces the chance of presence/detection of these emission lines in the spectrum. The spectral fitting of observation of the pulsar did not show any evidence of presence of cyclotron absorption features at earlier reported energies from other observations.
Pulse-phase resolved spectroscopy of the observation of EXO 2030+375 showed that the value of additional column density () due to the material local to the neutron star was about two orders of magnitude higher at certain pulse phases. It can be seen (from the top panels of Figure 7) that absorption dips are present at same pulse phase ranges. The additional high value of , therefore, explains the presence of absorption dips in the pulse profile. Apart from the variation of the additional column density and covering fraction over pulse phases, the value of high energy cut-off was found to be higher at dip phases. However, other parameters did not show any systematic variation over the pulse phases.
5. Conclusion
In this paper, we performed timing and broad-band spectral analysis on the observation of the Be/X-ray transient pulsar EXO 2030+375 during the peak of a type I outburst. The 41.41 s pulsations were detected in the light curves up to as high as 100 keV. The pulse profiles are found to be strongly energy dependent. Narrow dips which are generally seen in the pulse profiles of accretion powered pulsars up to 10 keV, are seen in the profiles up to as high as ∼70 keV. At soft X-rays, the shape of the pulse profiles is found to be complex whereas at high energies, it appeared symmetrical. The complex nature of the profiles at soft X-rays is interpreted as because of the presence of several absorption dips. A partial covering power-law with high energy cut-off continuum (with neutral as well as partially ionized absorber) model was found to be the preferred model to describe the broad-band spectrum in 1.0-200.0 keV energy range. High values of additional column density at the dip phases in the pulse profile confirm the presence of stream of absorbers that are phase locked with the pulsar. Apart from the fluroscence iron emission line, several low energy lines from S and Si are also detected in the pulsar spectrum. Cyclotron resonance scattering features, though reported earlier in the spectrum of this pulsar, are not detected in the 1.0-200.0 keV spectrum of the pulsar. Pulse-phase resolved spectroscopy revealed that the higher values of ionization parameter at the dip phases of the pulse profile may be the cause of the presence of dips up to 70 keV.
Acknowledgments
We thank the referee for his/her suggestions that improved the presentation of the paper. The research work at Physical Research Laboratory is funded by the Department of Space, Government of India. The authors would like to thank all the members of the for their contributions in the instrument preparation, spacecraft operation, software development, and in-orbit instrumental calibration. This research has made use of data obtained through HEASARC Online Service, provided by the NASA/GSFC, in support of NASA High Energy Astrophysics Programs.
References
- (1) Angelini, L., Stella, L., Parmar, A. N., 1989, 346, 906
- (2) Bildsten, L., et al., 1997, ApJS, 113, 367
- (3) Camero Arranz, A. Wilson, C. A., Connell, P., Martinez Nunez, S., Blay, P., Beckmann, V., Reglero, V., 2005, A&A, 441, 261
- (4) Coe M. J., et al., 1994, A&A, 289, 784
- (5) Coe, M. J., Longmore, A., Payne, B. J., Hanson, C. G., 1988, MNRAS, 232, 865
- (6) Devasia, J., James M., Paul B., Indulekha K., 2011, MNRAS, 414, 1023
- (7) Devasia, J., James M., Paul B., Indulekha K., 2011, MNRAS, 417, 348
- (8) Finger, M. H., Wilson, R. B., Chakrabarty, D., 1996, A&AS, 120, 209
- (9) Kallman, T., Palmeri, P., Bautista, M. A., Mendoza, C., & Krolik, J. H., 2004, ApJS, 155, 675
- (10) Klochkov, D., et al., 2007, A&A, 464, L45
- (11) Klochkov, D., Santangelo, A., Staubert, R., Ferrigno, C., 2008, A&A, 491, 833
- (12) Koyama, K., et al., 2007, PASJ, 59, S23
- (13) Maitra, C., Paul, B., Naik, S., 2012, MNRAS, 420, 2307
- (14) Maitra, C., Paul, B., 2012, ApJ (in press), arXiv1212.1538
- (15) Martinez Nunez, S., Reig, P., Blay, P., Kretschmar, P., Lund, N., Reglero, V., 2003, A&A, 411, L411
- (16) Massi, M., Ribo, M., Paredes, J. M., et al., 2004, A&AL, 414, 1
- (17) Mitsuda, K., et al. 2007, PASJ, 59, S1
- (18) Motch, C., Janot-Pacheco, E., 1987, A&A, 182, L55
- (19) Naik, S., Paul, B., Callanan, P. J., 2005, ApJ, 618, 866
- (20) Naik, S., et al., 2008, ApJ, 672, 516
- (21) Naik S., Paul B., Kachhara C., Vadawale S. V., 2011, MNRAS, 413, 241
- (22) Naik S., Paul B., Ali, Z., 2011, ApJ, 737, 79
- (23) Negueruela, I., Reig, P., Coe, M. J., & Fabregat, J., 1998, A&A, 336, 251
- (24) Okazaki, A. T., Negueruela, I., 2001, A&A, 377, 161
- (25) Parmar, A. N., White, N. E., Stella, L., Izzo, C., Ferri, P., 1989a, ApJ, 338, 359
- (26) Parmar, A. N., White, N. E., Stella, L., 1989b, ApJ, 338, 373
- (27) Paul, B., Naik, S., 2011, BASI, 39, 429
- (28) Reeves, J., Done, C., Pounds, K., et al. 2008, MNRAS, 385, L108
- (29) Reig, P., Coe, M. J., 1998, MNRAS, 294, 118
- (30) Reig, P., Coe, M. J., 1999, MNRAS, 302, 700
- (31) Reynolds, A. P., Parmar, A. N., White, N. E., 1993, ApJ, 414, 302
- (32) Sasaki, M., Klochkov, D., Kraus, U., Caballero, I., Santangelo, A., 2010, A&A, 517, A8
- (33) Sasaki, M., Muller, D., Kraus, U., Ferrigno, C., Santangelo, A., 2012, A&A, 540, A35
- (34) Stella, L., White, N. E. & Rosner, R., 1986, ApJ, 208, 669
- (35) Stollberg, M. T., 1997, PhD thesis, Univ.Alabama
- (36) Sun, X.-J., Li, T.-P., Wu, M., Cheng, L.-X., 1994, A&A, 289, 127
- (37) Takahashi, T., et al., 2007, PASJ, 59, S35
- (38) Usui, R., et al., 2012, PASJ, 64, 79
- (39) Wilson, C. A., Fabregat, J., Coburn, W., 2005, ApJ, 620, L99
- (40) Wilson, C. A., Finger, M. H., Camero-Arranz, A., 2008, ApJ, 678, 1263
- (41) Zhang, F., Li, X.-D., Wang, Z.-R., 2004, ApJ, 603, 663