Multifractal age?
Multifractal analysis of cardiac interbeat
intervals in assessing of healthy aging
Abstract
24-hour Holter recordings of 124 healthy people at different age are studied. The nocturnal signals of young people reveal the presence of the multiplicative structure. This structure is significantly weaker in diurnal signals and becomes less evident for elderly people. Multifractal analysis allows us to propose qualitative and quantitative methods to estimate the advancement of the aging process for healthy humans.
Index Terms:
autonomic control, heart rate variability, multifractal spectrumI Introduction
The structure-function-based multifractal analysis relies on scaling properties of some statistical measure of the data set (see [1]). Namely, if is a time series for which the multifractality is investigated, and is a function that measures a certain property of a signal in the th box containing consecutive points of data (boxes do not overlap), then the multifractal analysis considers scaling properties of all real value moments of . Then, the question is whether the following power-law dependence on box size exists or not for various real ’s:
| (1) |
where denotes averaging over the corresponding data sets. When it is found that such a power-law scaling is present for some , then we say that the studied process has fractal structure. Furthermore, if the scaling exponent function is not linear in then it is said that the process is multifractal. The multifractal spectrum of such a process: is obtained from the scaling exponent function by the Legendre transformation .
Different values of correspond to certain statistical properties of a signal. For example, when , the method provides estimates for the Hurst exponent, . If then we get information about large changes in the signal, while characterizes the smooth parts of a series. These properties support and motivate our efforts in developing methods based on the multifractal approach.
It often appears that the scaling curves, namely vs plots are, at least at the first sight, linear. Hence, according to the above given arguments, the signal can be classified as fractal. However, more careful investigation allows one to distinguish different scaling regimes. One type of scaling is present for the short-time scales and another one for the long ones. Such variations of scaling can be related to changes in the intrinsic properties of the considered time series [5, 6].
The cardiac interbeat time intervals, so called RR-signals, are studied in four generally accepted [7] frequency regimes:
-
•
high-frequency (HF) Hz,
-
•
low-frequency (LF) Hz,
-
•
very-low-frequency (VLF) Hz,
-
•
ultra-low-frequency (ULF) Hz.
Such a division is associated with different, physiologically distinguishable aspects of cardiac rhythm control. Therefore, by considering time scales in the scaling procedure corresponding to the listed frequency bands, we hope to get insights into these aspects. In practical application, assuming that the mean cardiac interbeat is 0.8 s, we have assigned size of ”boxes” for investigation of the scaling properties in signals. In particular, we assume RR-intervals as corresponding to the VLF band
Multifractal analysis based on the study of structure functions must be applied with care. If the data exhibits noise properties then the partial summation must be performed before the proper analysis [1]. On the other hand, if the data has some features of the random walk, there is no need for partial summation. Therefore, before multifractal analysis one needs to decide whether the data should be treated as a noise process or as a random walk. In the following we will show what additional information can be gained if the initial data is considered both as a noise process and as a random walk.
The method summarized above was applied to 24-hour Holter recordings of cardiac time interbeat signals obtained from healthy persons. The obtained results led to the estimators which allowed us to describe and (at least to some extent) quantify the advance of the aging process. The specific details are given in [2, 3, 4]. Extensive discussion, numerous examples are presented in just cited articles. Here we focus only on the essentials.
II Methods
24-hour Holter monitoring of ECG was performed for 124 healthy subjects: young adults: 36 persons (age 18-26), middle-aged adults: 40 persons (age 45-53), elderly: 48 persons (age 65-94). Thus, we have analyzed RR-signals consisting of time intervals between consecutive normal cardiac contractions which originated in the sinus node.
Multifractal analysis, similarly as in the time-domain statistics, is found to be robust to data removal (see [9]). However, multifractal statistics requires long consecutive series to have access to large pool of scales. Additionally, studied series should have a stable character. Therefore, we carefully divided the obtained signals into two parts corresponding to nocturnal and diurnal (daily) activities. The high levels of meanRR, SDNN and pNN50 were assumed to specify sleep hours. For each RR-signal the period of the six consecutive hours with high levels of these quantities was extracted and labeled as sleep. Then, the part corresponding to the typical afternoon activity was labeled as wake.
Multifractal analysis relying upon the study of structure functions was performed with the well-known approach called Wavelet Transform Modulus Maxima (WTMM) [8]. The WTMM-based analysis was performed for each person, both for wake and sleep parts of his/her signals. This was done not only for the proper signal, but also for the corresponding integrated one. The scaling properties were estimated for scales corresponding to the VLF band. Then, after the necessary Legendre transformation, the multifractal spectra were obtained for wake and sleep parts of every individual RR-signal.
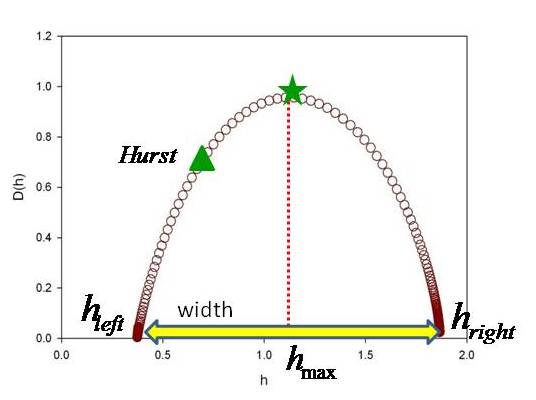
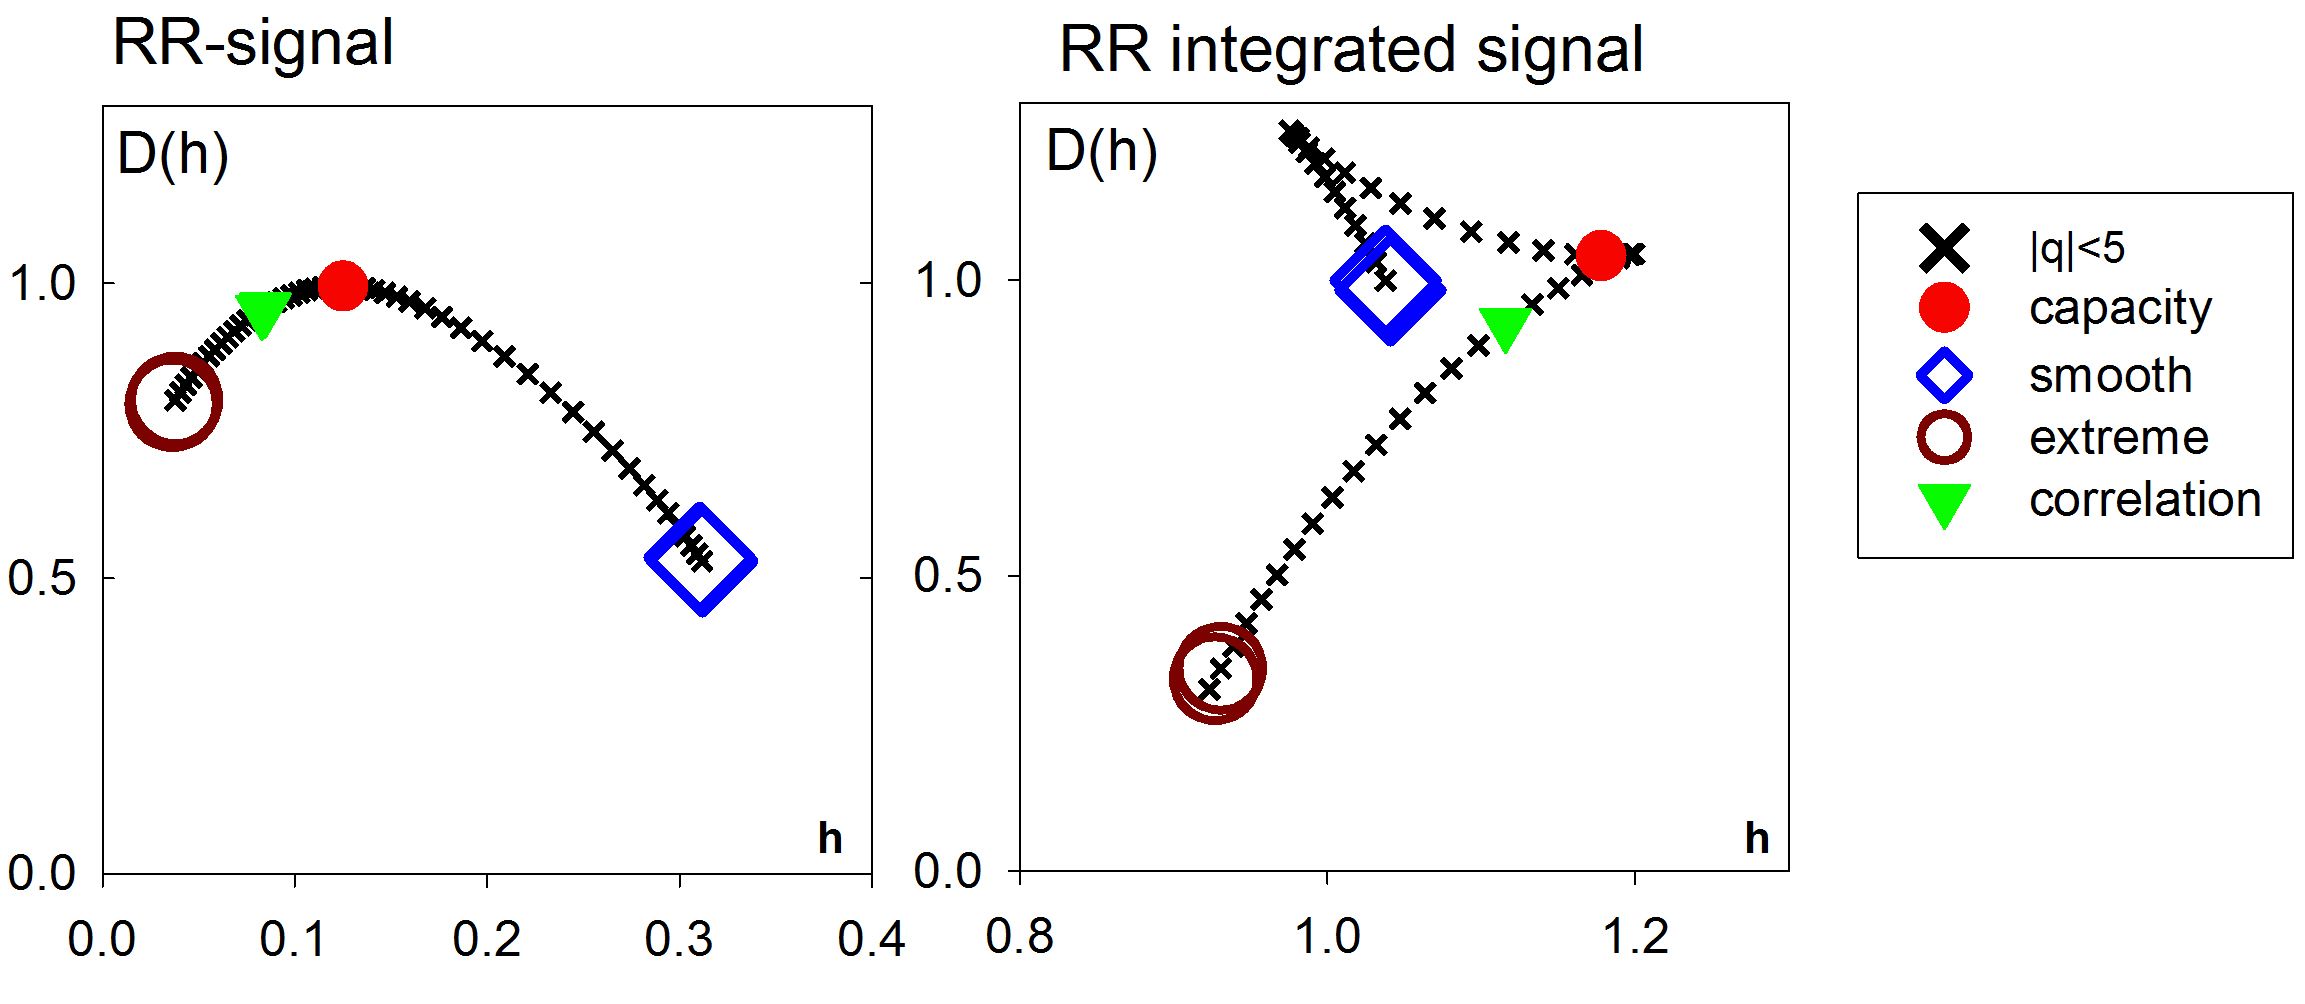
In Fig. 1 we present the typical multifractal spectrum and collect the main parameters characterizing such a spectrum. However, real spectra obtained from cardiac time series differ considerably from typical ones. Examples of such spectra are presented in Fig. (2). The evident irregularities (especially in the integrated signals) require special care and the corresponding analysis is quite time-consuming. The details concerning such spectra (examples and their discussion) can be found in [4].
III Results
III-A in cardiac signals
The distance between in the spectrum obtained from the integrated signal and in a spectrum obtained in a signal plays a very important role. It allows to distinguish additive from multiplicative processes. We have found that such a distinction can be made for diurnal and nocturnal parts of the signals. The main observation is that the nocturnal signals possesses multiplicative character in the VLF region. Such organization is quite weak in the diurnal signals. Moreover, it was found that the multiplicative features are less and less pronounced when the age of the investigated individuals grows. Hence, weakening of multiplicativity can be considered as an indicator of aging.
III-B Multifractal age
In our analysis we have tested several parameters to characterize typical multifractal spectra. In particular, for each person, we have examined: , (Hurst), , , – the width (see Fig.1 for the corresponding illustration) in his/herwake and sleep parts of the signals and their integrated counterparts.
Tedious statistical analysis for sleep and wake parts of the signals allowed as to formulate the following five criteria.
| (2) |
| (3) |
| (4) |
| (5) |
| (6) |
The notation was explained above and the additional superscripts seem to be self-evident. These criteria were applied to all 124 signals obtained from all age groups.
The results are summarized in the table below. The first row tells us how many positive answers were given to the question whether each (out of 5) criterion is fulfilled. The main body of the table presents the percentage of the number of positive answers obtained for three investigated age groups.
The number of positive answers clearly increases with age and the table has a characteristic skew form. The skewness of the table contents suggests that we can associate the number of positive answers to criteria (2) – (6) as indicators of the multifractal age.
IV Conclusions
We have applied the multifractal analysis to 124 24-hour RR signals divide into wake and sleep parts. The main conclusions can be summarized as follows
-
•
The skewness of the presented table stems from the careful multifractal analysis of Holter recordings of RR signal obtained from healthy individuals. The number of positive answers whether the criteria are met, clearly increases with age. Thereby, we suggest that the term multifractal age may be useful in the studies of healthy aging.
-
•
The quantity leads to distinction between additivity and multiplicativity of the investigated RR signals. Hence, we suggest that should be accepted as an additional parameter characterizing multifractality of the time series.
References
- [1] J. Gao, Y. Cao, WW. Tung and J. Hu Multiscale analysis of complex time series. Integration of chaos and random fractal theory, and beyond John Wiley& Sons Inc., 2007.
- [2] D. Makowiec, A. Dudkowska, R. Gała̧ska and A. Rynkiewicz Multifractal estimates of monofractality in RR-heart series in power spectrum ranges Physica A. 388:3486–502, 2009.
- [3] D. Makowiec, A. Rynkiewicz, R. Gała̧ska, J. Wdowczyk-Szulc and M. Żarczyńska - Buchowiecka Reading multifractal spectra: Aging by multifractal analysis of heart rate EPL. 94:68005-p1–p6, 2011.
- [4] D. Makowiec, A. Rynkiewicz, J. Wdowczyk-Szulc, M. Żarczyńska-Buchowiecka R. Gała̧ska and S. Kryszewski Aging in autonomic control by multifractal studies of cardiac interbeat intervals in the VLF band Physiol. Meas.32:1–19, 2011.
- [5] S. Stoev, MS. Taqqu, Ch. Park and JS. Marron On the wavelet spectrum diagnostic for Hurst parameter estimation in the analysis of Internet traffic Comp. Networks 48:423–45, 2005.
- [6] JW. Kantelhardt Fractal and multifractal time series in Encyclopedia of Complexity and Systems Science RA. Meyers(Ed.) Springer, 2009.
- [7] Heart rate variability. Standards of measurement, physiological interpretation, and clinical use Task Force of the European Society of Cardiology the North American Society of Pacing and Electrophysiology. Eur. Heart J. 17: 354–81, 1996.
- [8] JF. Muzy, E. Bacry and A. Arneodo Multifractal formalism for fractal signals: the structure-function approach versus the wavelet-transform modulus-maxima method Phys. Rev. E. 47:875–95 1993.
- [9] GD. Clifford ECG Statistics, Noise, Artifacts and Missing Data pp.55–92 in Advanced Methods and Tools for ECG Data Analysis GD. Clifford, F. Aznajeand PE. McSharr (Eds.) Artech House Inc., 2006.